Technical Report
NREL/TP-560-46719 November 2009
Lifecycle Cost Analysis of
Hydrogen Versus Other
Technologies for Electrical
Energy Storage
Technical Report
NREL/TP-560-46719 November 2009
Lifecycle Cost Analysis of
Hydrogen Versus Other
Technologies for Electrical
Energy Storage
D. Steward, G. Saur, M. Penev, and T. Ramsden
Prepared under Task No. H278.3400NOTICE
This report was prepared as an account of work sponsored by an agency of the United States government. Neither the United States government nor any agency thereof, nor any of their employees, makes any warranty, express or implied, or assumes any legal liability or responsibility for the accuracy, completeness, or usefulness of any information, apparatus, product, or process disclosed, or represents that its use would not infringe privately owned rights. Reference herein to any specific commercial product, process, or service by trade name, trademark, manufacturer, or otherwise does not necessarily constitute or imply its endorsement, recommendation, or favoring by the United States government or any agency thereof. The views and opinions of authors expressed herein do not necessarily state or reflect those of the United States government or any agency thereof.
Available electronically at
Available for a processing fee to U.S. Department of Energy and its contractors, in paper, from:
U.S. Department of Energy
Office of Scientific and Technical Information P.O. Box 62
Oak Ridge, TN 37831-0062 phone: 865.576.8401 fax: 865.576.5728
email:
Available for sale to the public, in paper, from: U.S. Department of Commerce
National Technical Information Service 5285 Port Royal Road
Springfield, VA 22161 phone: 800.553.6847 fax: 703.605.6900
email:
online ordering:
Executive Summary
As renewable electricity becomes a larger portion of the electricity generation mix, new strategies will be required to accommodate fluctuations in energy generation from these sources. One of the primary strategies proposed for integrating large amounts of
renewable energy is using energy storage to absorb excess electricity-generating capacity during times of low demand and/or high rates of generation by renewable sources and then reconverting this stored energy into electricity during periods of high demand and/or low renewable generation.
Various energy storage technologies have been developed or proposed. The goal of this analysis was to develop a cost survey of the most-promising and/or mature energy storage technologies and compare them with several configurations employing hydrogen as the energy carrier. A simple energy arbitrage scenario was developed for a mid-sized energy storage system consisting of a 300-MWh nominal storage capacity that is charged during off-peak hours (18 hours per day on weekdays and all day on weekends) and discharged at a rate of 50 MW for 6 peak hours on weekdays.
For all the hydrogen cases, off-peak and/or excess renewable electricity is used to electrolyze water to produce hydrogen, which is stored in compressed gas tanks or underground geologic formations. The hydrogen is reconverted into electricity using a polymer electrolyte membrane (PEM) fuel cell or hydrogen expansion combustion turbine. The hydrogen storage scenarios are compared with the use of several battery systems (nickel cadmium, sodium sulfur, and vanadium redox), pumped hydro, and compressed air energy storage (CAES).
All the energy storage systems are evaluated for the same energy arbitrage scenario using consistent financial and operational assumptions. Costs and performance parameters for the technologies were gathered from literature sources and, in the case of the hydrogen expansion combustion turbine, Aspen Plus modeling. Producing excess hydrogen for use in vehicles or backup power is also evaluated. Two production levels are analyzed: 1,400 kg/day (roughly equivalent to the U.S. Department of Energy's standard model for small-scale distributed hydrogen production) and 12,000 kg/day. As for the purely energy arbitrage scenarios, it is assumed that hydrogen would be produced with
off-peak/renewable electricity. Cost results for the analysis are presented in terms of the annualized (“levelized”1
Figure ES - 1
) cost for producing the energy output from the storage system: electricity fed back onto the grid during peak hours ($/kWh) and, in the case of producing excess hydrogen for vehicles, hydrogen ($/kg).
summarizes the comparison of levelized cost of delivered electricity for hydrogen (green bars) and competing technologies (blue bars). For each technology, high-cost, mid-range, and low-cost cases were analyzed, and sensitivity analyses were
performed to generate a range of possible costs for each case. In Figure ES - 1, the bottom of the bars represents the low end of the range for the low-cost cases, and the top of the bars represents the high end of the range for the high-cost cases. The numerals shown are the nominal values of the mid-range cases; these mid-range values do not represent a statistical determination of most-probable costs.
The range of costs for each system reflects the range found in the literature and estimates of potential cost reductions as technologies develop. The hydrogen fuel cell scenario cost range reflects the comparative immaturity of fuel cell technologies for this application. It is anticipated that costs for fuel cells will decrease as the technology matures. Hydrogen combustion turbines could prove to be viable for energy storage applications and could provide additional flexibility to utilities through co-firing of mixtures of natural gas and hydrogen. Hydrogen technologies are competitive with battery systems for this
application and could be a viable alternative to pumped hydro and CAES at sites where those technologies are not feasible.
Figure ES - 1. Ranges of levelized cost of output electricity for electricity storage systems Using hydrogen for energy storage provides unique opportunities for integration between the transportation and power sectors. An analysis was performed to evaluate the potential cost implications of producing excess hydrogen for vehicles in addition to what is needed for the electricity storage scenario. Producing a small amount of excess hydrogen (five 280-kg tanker-truck loads or 1,400 kg per day) for the vehicle market was evaluated by
0.0 20.0 40.0 60.0 80.0 100.0 120.0
FC/ a
boveg
round
FC/ g
eolog
ic
Hydro
gen ex
pans
ion/com
busti
on tur
bine
NiCd
batter
y
NaS ba
ttery
Vanadi
um red
ox bat
tery
Pum
ped hy
dro
CAES
Lev
el
iz
ed c
os
t o
f ou
tpu
t e
le
ct
ric
ity
(¢
/K
W
h)
28 24
19
83
25 28
adding a hydrogen load to the mid-range energy storage case with aboveground storage of hydrogen. Producing this small amount of excess hydrogen reduces the overall levelized cost of energy for this scenario by about 6% compared with the purely energy arbitrage scenario.2
2 The levelized cost of energy includes electricity fed to the grid plus hydrogen for vehicles but not
The excess hydrogen is produced for $4.69/kg. Excess hydrogen produced in this way is still not competitive with hydrogen produced in a dedicated, distributed electrolysis process with the same daily output of hydrogen ($4.00/kg untaxed). However, for producing larger volumes of excess hydrogen to feed into a hydrogen pipeline, the scenario with energy storage plus excess hydrogen could be competitive with a dedicated hydrogen production facility. The energy storage plus excess hydrogen scenario produces 500 kg/hour (12,000 kg/day) of excess hydrogen for $3.33/kg (untaxed). A dedicated, centralized, 500-kg/hour electrolysis facility produces hydrogen for $6.86/kg (untaxed).
Table of Contents
Executive Summary ... iii
Acroynms and Abbreviations ... vii
1 Introduction ... 1
2 Analysis Methodology ... 1
2.1Scenario Definitions...1
2.1.1Energy Arbitrage Scenario ...1
2.1.2Excess Hydrogen for the Vehicle Market ...2
2.2HOMER Model ...3
2.3Cost and Sensitivity Analyses ...3
3 Energy Storage Technologies and Costs ... 6
3.1Hydrogen Systems ...6
3.1.1Hydrogen Fuel Cell System Description ...10
3.1.2Hydrogen Fuel Cell System Cost Results ...14
3.1.3Hydrogen Expansion Combustion Turbine System Description ...17
3.1.4Hydrogen Expansion Combustion Turbine System Cost Results ...18
3.1.5Excess Hydrogen for the Vehicle Market System Description and Costs ....21
3.2Batteries ...24
3.2.1Vanadium Redox Batteries ...24
3.2.2Nickel Cadmium Batteries ...27
3.2.3Sodium Sulfur Batteries ...28
3.2.4Net Present Costs and Sensitivity Analyses for Battery Systems ...29
3.3Pumped Hydro ...34
3.3.1Net Present Costs and Sensitivity Analyses for Pumped Hydro Systems ....35
3.4Compressed Air Energy Storage ...37
3.4.1Net Present Costs and Sensitivity Analyses for Compressed Air Energy Storage Systems ...39
4 Conclusions ... 41
4.1Energy Arbitrage Benchmarking Cost Analysis ...41
4.2Excess Hydrogen Production for Vehicles ...44
4.3Non-Economic Benefits and Drawbacks ...44
4.4Future Analysis Work ...45
Acroynms and Abbreviations
AC alternating currentBoP balance of plant
CAES compressed air energy storage DC direct current
DOE U.S. Department of Energy EPRI Electric Power Research Institute FC fuel cell
H2 hydrogen
ICE internal combustion engine
IGCC integrated gasification combined cycle KOH potassium hydroxide
LCOE levelized cost of energy LHV lower heating value LPG liquefied petroleum gas MP mass production
MYPP Multi-Year Research, Development, and Demonstration Plan NaS sodium sulfur
NiCd nickel cadmium NOx nitrogen oxides NPC net present cost
O&M operating and maintenance PCS power conditioning system PEM polymer electrolyte membrane VR vanadium redox
1 Introduction
This report presents the results of an analysis evaluating the economic viability of
hydrogen for medium- to large-scale electrical energy storage applications compared with three other storage technologies.
• Batteries
• Pumped hydro
• Compressed air energy storage (CAES)
2 Analysis Methodology
Potentially viable hydrogen production and storage scenarios were developed, and a lifecycle economic analysis was performed to determine the levelized cost of delivering energy for these scenarios. The results were benchmarked against the three competing technologies on an “apples to apples” basis. Sensitivity analyses were performed for three cost cases for each technology.
2.1 Scenario Definitions
An energy arbitrage scenario was developed to simulate the storage and dispatch back to the grid of electricity at favorable cost, supply, and demand conditions. Additional scenarios were developed to simulate the production of excess hydrogen along with the energy storage and dispatch functions.
2.1.1 Energy Arbitrage Scenario
Although each utility service area is unique, analysis of a utility’s hour-by-hour marginal costs generally shows that a percentage of electricity demand is met at very low cost— typically $0.02–$0.03 per kWh or less—using baseload-generation units. Above that, the marginal production cost from peak-generation units increases to $0.04–$0.10 or more per kWh (Ramsden et al. 2008). Systems that store electricity during low-demand/cost periods and supply it during high-demand/cost periods displace this higher-marginal-cost peaking power. A study by Sioshansi et al. (2008) for the PJM system3
An energy arbitrage scenario matching the scenario in Ramsden et al. (2008) was used in this study in which grid electricity from renewable or other sources is stored when electricity demand and cost are low and/or when renewable sources must be used in the absence of equivalent demand. The stored energy is converted back to electricity and dispatched to the grid during periods of peak electricity demand and cost. The scenario
showed that, for small energy storage devices for which the electricity produced for energy storage does not affect grid electricity prices, more than 50% of the total capturable arbitrage value of the system is obtained during the first four hours of discharge. With longer-term storage allowing inter-day arbitrage and weekend charging, eight hours of storage captures about 85% of the potential value. Six hours of discharge was selected for this study.
3 PJM Interconnection is a regional transmission organization that coordinates the movement of wholesale
corresponds to the bulk energy storage application definition used by Schoenung and Hassenzahl (2003). Table 1 lists key parameters of this scenario.
The primary figure of merit for this scenario is levelized cost of delivered electricity (LCOE), defined as the total annualized cost of the storage system divided by the annual energy output from the system. In the case of the purely energy arbitrage scenario, the output energy is the yearly total of electricity fed onto the grid during peak hours on weekdays. For the scenarios including production of excess hydrogen for the vehicle market, the output energy for the system is the yearly electricity production plus the yearly production of hydrogen used for vehicles. The annualized costs include the initial capital investment, replacement costs, end-of-life costs or credits, and fixed and variable operating costs summed over the lifetime of the facility and divided by the facility
lifespan. The storage system might also meet requirements for spinning reserve and other services, but no value is assigned to these services because of the wide variety of factors affecting the value of these services for a particular utility and the variations in
requirements for different utilities. Off-peak electricity costs used in this study do not include transmission and distribution charges. The analysis also does not include consideration of business taxes.
Table 1. Key Parameters of Energy Arbitrage Scenario
Energy storage system capacity 50 MW for 6 peak hours each weekday (300 MWh/day)1
Plant life 40 years2
Interest rate on debt 10%3
Debt financing 100%3
Off-peak/renewable electricity
cost $0.025–$0.06/kWh; $0.038/kWh is used as the baseline renewable/off-peak electricity price for this study4
Natural gas cost (CAES system) $7/MMBtu
1The remaining 18 hours per day on weekdays and all day on weekends are assumed to be off-peak hours when the
system can be charged.
2Some equipment is replaced at more frequent intervals.
3100% debt financing and 10% interest rate is equivalent to the H2A model standard assumption of 100% equity financing
and 10% IRR.
4$0.038/kWh is the value used for wind-generated electricity in Ramsden et al. (2008) and is consistent with current
estimates for wind-generated electricity costs. $0.06/kWh represents a conservative cost for electricity from renewable sources. $0.025/kWh represents very-low-cost, off-peak electricity for sensitivity analyses.
2.1.2 Excess Hydrogen for the Vehicle Market
Using hydrogen for large-scale energy storage could also provide an economical source of hydrogen for fuel cell vehicles. Two basic scenarios for production of excess hydrogen for vehicles were evaluated. In both scenarios, the energy storage scenario remains unchanged, but additional hydrogen is produced for use in vehicles.
In the first scenario, it is assumed there would be demand for five 280-kg (1,400-kg/day) gaseous tankers of hydrogen per day from the storage system. This scenario produces 511,000 kg of hydrogen per year for vehicle use, which is roughly equivalent to the output from one forecourt hydrogen station and about 12% of the hydrogen produced for the energy storage scenario.4 It is assumed that the electrolyzer system would be sized
slightly larger but would operate on the same schedule as the energy storage scenarios to take advantage of low electricity prices and provide additional load during times of low electricity demand. It is assumed that the hydrogen would be stored in aboveground steel tanks that could be loaded onto a trailer.
The second scenario is similar to the first in that the electrolyzer system is sized to accommodate production of additional hydrogen during off-peak hours. However, in this scenario, approximately the same amount of hydrogen is produced for vehicles on a yearly basis as is produced to fuel the fuel cell for peak electricity production. This scenario assumes that 500 kg/hour of hydrogen flows into a pipeline at all times. Geologic storage and pipeline transport of the hydrogen is assumed. Costs were developed for production and storage of the hydrogen for both scenarios. Costs for transport of the hydrogen to refueling stations were not considered.
2.2 HOMER Model
The facility lifecycle economic analyses were performed using HOMER, the National Renewable Energy Laboratory's distributed-generation economic model.5
HOMER defines LCOE as the average cost per kWh of useful electrical energy (and hydrogen if produced as a product rather than as a storage medium) produced by the system. To calculate the LCOE, HOMER divides the annualized cost of producing electricity and/or hydrogen (the total annualized cost minus the cost of serving the thermal load) by the total useful electric and hydrogen energy production. For the energy arbitrage system modeled in this study, the cost of electricity is simply the total
annualized cost of the system ($/yr) divided by the total primary AC load served (kWh/yr). Details on the calculations can be found in Lambert et al. (2006).
System components, available energy resources, and loads were modeled hour by hour for a single year with energy flows and costs held constant over a given hour. HOMER requires inputs such as subsystem component options and performance, capital and replacement costs, fuel and electricity costs, and resource availability. It uses these inputs to simulate different system configurations and generate a list of feasible configurations sorted by net present cost (NPC). HOMER also reports the cost of energy produced for each feasible system configuration, reported on a $/kWh basis. Because the energy storage systems modeled in this study always produce the same amount of electricity, the system configuration with the lowest NPC is also the configuration with the lowest cost of electricity. As such, the system configuration with the lowest cost of energy is also the most economic solution.
2.3 Cost and Sensitivity Analyses
The energy arbitrage scenario was analyzed for four energy storage technologies and three cost values:
• Hydrogen (fuel cell production of electricity and hydrogen combustion turbine)
• Batteries (vanadium redox, nickel cadmium, and sodium sulfur)
• Pumped hydro
• CAES
High cost. These cost and efficiency values represent a conservative estimate for current technologies. In most cases, the values were derived from studies that compiled costs from actual installations. In many cases, these costs represent first-generation
installations and conservative estimates of costs for installations that could be built at the time the referenced study was developed.
Mid-range cost. These values were derived from estimated technology improvement, size scale-up, and bulk manufacturing cost reductions projected to be available in the near future (3 to 5 years).
Low cost. These values were derived assuming optimal or “fully mature” technologies and many large-scale installations. In some cases, they were derived from existing studies, and in some cases they were based on percentage reductions in cost that are consistent with projections for similar technologies.
Pumped hydro is the most mature technology considered in this analysis. Pumped hydro systems of varying sizes, including very large installations up to nearly 3,000 MW, have been installed throughout the world. The remaining technologies included in this analysis are much less established. Although CAES involves well-established commercial
technologies (compressors and gas turbines), and many designs and projects have been proposed, only two facilities have been built. Battery systems are also commercially available but have not been implemented extensively for bulk energy storage.
Electrolyzers and hydrogen fuel cells are also commercially available but have never been combined for bulk energy storage applications. The timeframe for achieving the low-cost case may be much greater for the fuel cell systems than for more established technologies.
Costs for energy storage systems depend on the power (kW) and energy (kWh) capacity of the systems in addition to fixed costs that are independent of system size (EPRI 2007). Costs that depend on system power capacity include the power conditioning system (PCS), cell stack for fuel cells and flow batteries, and pumping or compression
equipment for pumped hydro and CAES systems. Costs that depend on energy storage capacity include battery capital costs, some balance of plant (BoP), and electrolyte and electrolyte storage systems for vanadium redox batteries. Fixed costs include, for example, control systems, construction management, and permitting. The total capital cost for the system can be described by the following equation (EPRI 2007):
Capital Cost = (power capacity × $/kW) + (duration × $/kWh) + fixed cost Eq. 1 Although this equation generally holds, capital cost components are represented
differently in different references used in this analysis. To maintain consistency and allow for comparisons between different sources, values in this report are presented using the breakdown shown in Equation 1. These may differ from the presentation in the
information are shown in their original units. All values used in the cost modeling for this study were escalated to $2008 using the GDP Implicit Deflator Price Index.6
The storage system must be sized to account for energy losses during the electricity conversion and storage processes as well as equipment mechanical or voltage limitations that prevent the system from being discharged fully during operation (Schoenung and Hassenzahl 2003). Cost modeling must account for the oversizing of the system needed to provide the required delivered electricity. Voltage/capacity limitations are especially important for sizing of battery systems. The HOMER battery model accounts for these limitations based on default or user-input battery profiles. Cost information is typically presented based on the net power capacity per discharge cycle and net power output of the plant. Therefore, all capacity-related costs ($/kWh) are based on 300 MWh (50 MW ×
6 hours), and all power-related costs ($/kW) are based on 50-MW net power output for the plant.
Lifecycle costs for each of the technology cases were calculated using HOMER. Results are presented for initial capital investment and system NPC, including operating costs. Low-cost, mid-range, and high-cost cases were developed for each technology.
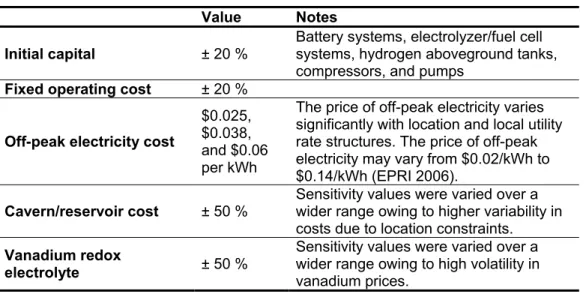
Sensitivity analyses were performed for each of the three cost cases for all the technologies. Sensitivity analyses include initial capital costs, cost of electricity for charging the system, and fixed operating costs. Additional sensitivity analyses were performed for the cavern/tank/reservoir costs for CAES, fuel cell, and pumped hydro systems and the CAES system cost sensitivity to the price of natural gas fuel for the combustion turbine. Table 2 lists the sensitivity values used in the analysis.
Table 2. Values for Energy Storage Technology Sensitivity Analyses Value Notes
Initial capital ± 20 % Battery systems, electrolyzer/fuel cell systems, hydrogen aboveground tanks, compressors, and pumps
Fixed operating cost ± 20 %
Off-peak electricity cost
$0.025, $0.038, and $0.06 per kWh
The price of off-peak electricity varies significantly with location and local utility rate structures. The price of off-peak electricity may vary from $0.02/kWh to $0.14/kWh (EPRI 2006).
Cavern/reservoir cost ± 50 % Sensitivity values were varied over a wider range owing to higher variability in costs due to location constraints.
Vanadium redox
electrolyte ± 50 %
Sensitivity values were varied over a wider range owing to high volatility in vanadium prices.
6 GDP Implicit Price Deflator (Index, 2000 = 100), available from Short Term Energy Outlook, Table 9a,
3 Energy Storage Technologies and Costs
The energy storage technologies analyzed in this study range in maturity from novel concepts to commercial systems used for decades. Current cost and performance
information was combined with projections of future technological development to model each technology and cost case.
3.1 Hydrogen Systems
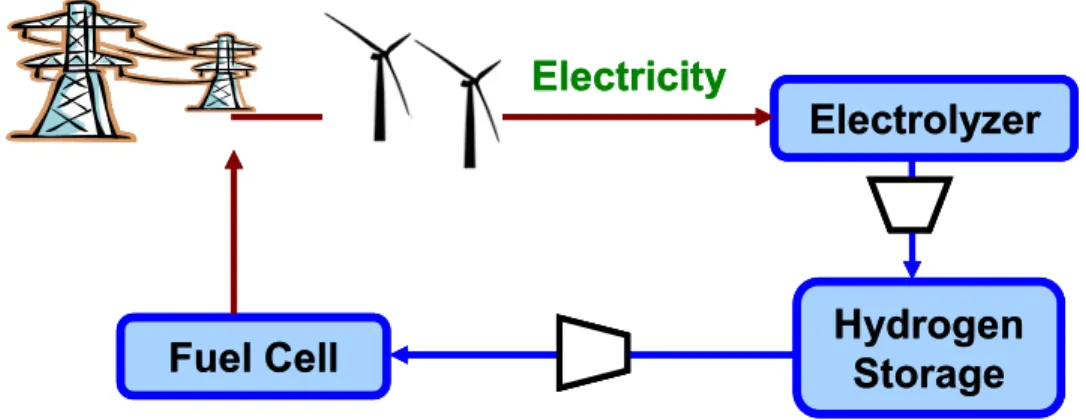
The energy arbitrage scenario was analyzed for three hydrogen cases. In each case, an electrolyzer system converts electricity into hydrogen (by electrolyzing water), which is stored in either steel tanks or geologic caverns for later conversion back into electricity. In the first two cases, a fuel cell system converts the hydrogen into electricity (Figure 1). In the third case, the hydrogen fuels an expansion/combustion turbine system.
Electricity
Hydrogen
Storage
Electrolyzer
Fuel Cell
Electricity
Hydrogen
Storage
Electrolyzer
Fuel Cell
Hydrogen
Storage
Electrolyzer
Fuel Cell
Figure 1. Hydrogen electrical energy storage and dispatch scenario
Ramsden et al. (2008) evaluated use of a hydrogen internal combustion engine (ICE) for production of electricity from the storage system. They found that the low roundtrip efficiency of between 21% and 36% for the ICE cases compared with 36% to 50% roundtrip efficiency for the fuel cell cases did not compensate for the potentially lower cost of the ICE. The initial capital cost of the ICE system was, in fact, higher than the initial capital costs for the comparable fuel cell scenario that was also based on steel tank (aboveground) storage. The capital cost for the hydrogen ICE was only slightly less than the cost for the fuel cell: $720/kW ($2005) for the ICE versus $740/kW ($2005) for the fuel cell for the near-term case. The low efficiency of the hydrogen ICE required both increased hydrogen storage capacity and a larger electrolyzer system, which increased the overall cost. Therefore, a fuel cell was used for electricity generation from the storage system in most cases evaluated in this study. However, the use of hydrogen in place of natural gas as the fuel for the combustion turbine in a compressed air/compressed hydrogen comparison was analyzed (see Section 3.1.3).
• Case 1—Compressed hydrogen stored aboveground in steel tanks and polymer electrolyte membrane (PEM, also called proton exchange membrane) fuel cell for conversion of the stored hydrogen energy into electricity.
• Case 2—Compressed hydrogen stored underground (i.e., geologic storage) in salt caverns and PEM fuel cell for conversion of the stored hydrogen energy into electricity.
• Case 3—Compressed hydrogen stored underground (i.e., geologic storage) in salt caverns and hydrogen combustion turbine for conversion of hydrogen energy into electricity.
The use of hydrogen for energy storage provides unique opportunities for integration between the transportation and power sectors. Additional analyses were performed to evaluate the potential cost implications of producing excess hydrogen for use in vehicles, in addition to what is needed for the electricity storage scenario. See Section 2.1.2 for a description of these scenarios.
Geologic Storage
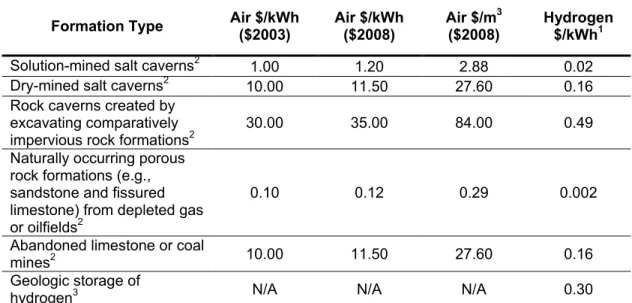
In general, geologic hydrogen storage is anticipated to be considerably cheaper than storing hydrogen in steel tanks. However, development of geologic storage reservoirs is highly dependant on the characteristics of the geologic formation. EPRI-DOE (2003) cost estimates for developing underground storage facilities for CAES systems range from $0.10/kWh ($2003) for porous rock formations to $30/kWh ($2003) for excavation of hard-rock formations. The storage volume required for a hydrogen-based system would be orders of magnitude less than the volume required for an equivalent-energy-capacity CAES reservoir because of the higher caloric value of the hydrogen. Crotogino and Huebner (2008) estimated the energy density for a typical CAES system at 2.4 kWh/m3; for a comparable hydrogen reservoir, they estimated 170 kWh/m3. Table 3 shows the range of costs for geologic storage cavern development for CAES and hydrogen assuming the energy density values given by Crotogino and Huebner. Geologic storage costs for hydrogen developed for the H2A Delivery Components Model (Argonne National Laboratory 2009/2009a) are shown for comparison. That analysis is based on a natural gas storage facility in Saltville Virginia.7
7 Spectra Energy, Saltville Gas Storage:
The values given in the H2A Delivery Components Model are used for the geologic storage costs in this report. The current cost estimate for storage of hydrogen in aboveground tanks is $623/kg or ~$19/kWh
(Ramsden et al. 2008).
Table 3. Costs of Geologic Storage Cavern Development for CAES and Hydrogen Formation Type Air $/kWh ($2003) Air $/kWh ($2008) Air $/m($2008) 3 Hydrogen $/kWh1 Solution-mined salt caverns2 1.00 1.20 2.88 0.02
Dry-mined salt caverns2 10.00 11.50 27.60 0.16
Rock caverns created by excavating comparatively
impervious rock formations2 30.00 35.00 84.00 0.49
Naturally occurring porous rock formations (e.g., sandstone and fissured limestone) from depleted gas or oilfields2
0.10 0.12 0.29 0.002
Abandoned limestone or coal
mines2 10.00 11.50 27.60 0.16
Geologic storage of
hydrogen3 N/A N/A N/A 0.30
1Hydrogen storage cavern development cost is calculated assuming the same $/m3 as for CAES cavern development and
energy density from Crotogino and Huebner (2008).
2Source: EPRI (2003) and Crotogino and Huebner (2008).
3Equation from H2A Delivery Scenario Analysis Model Version 2.02, for 41,000-kg usable storage capacity,
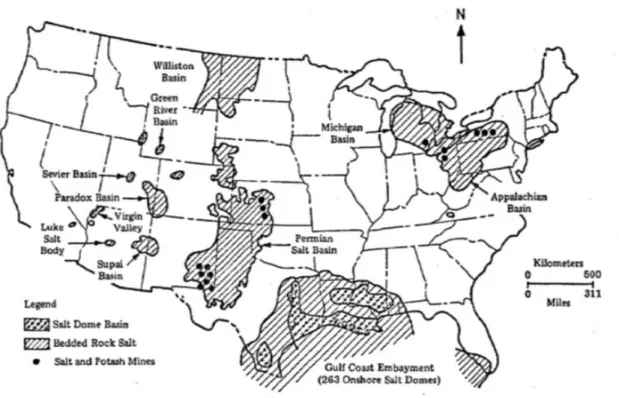
Hydrogen storage in geologic formations would have considerable advantages over comparable air storage. However, systems using geologic storage can be more difficult to site compared with steel tank systems. Hydrogen is currently stored in solution-mined salt domes in the U.S. Gulf Coast. Figure 2 shows the location of known U.S. salt
deposits. A major advantage of solution-mined salt caverns is that they can be developed to any size, allowing use of minimal volumes of cushion gas (the gas required to maintain the minimum pressure in the cavern) even for very small installations such as the one envisioned in this study.
Figure 2. Known U.S. salt deposits (Casey 2009)
Potential issues involved with geologic storage of hydrogen include salt flow over time (shrinkage of approximately 0.25% per year), subsidence, and deformation/breakage of the shaft causing equipment damage (Casey 2009). Alternatives include hydrogen storage, as liquid or as high-pressure gas, in buried tanks, or in hard-rock formations using a water curtain to contain the hydrogen (IKA 2009). Hydrogen stored in caverns may also require purification before it can be used in PEM fuel cells (in stationary or vehicle applications).
Additional types of geologic formations may be suitable for hydrogen storage. The U.S. Department of Energy (DOE) Fuel Cell Technologies Program has investigated the potential for hydrogen storage in geologic formations and identified areas for further research (Borns and Lord 2008). In general, caverns, whether natural or mined, must provide containment of the gas. In excavated caverns, this can be accomplished by lining the cavern with steel or using hydraulic pressure in the surrounding rock. In addition to salt caverns, depleted gas reservoirs and aquifers were identified as probable candidates for underground storage of hydrogen. Figure 3 and Figure 4 show locations of depleted gas reservoirs and aquifers in the United States. Further research is needed to ensure hydrogen containment and purity, including investigation of hydrogen mobility in different rock types, hydrogen embrittlement, gas mixing, and the effect of hydrogen on rock properties.
Figure 3. Location of major oil and gas fields in the United States (Borns and Lord 2008)
Figure 4. Location of sedimentary basins in the United States (Borns and Lord 2008)
3.1.1 Hydrogen Fuel Cell System Description
Stationary PEM fuel cells were selected for the energy arbitrage scenario examined in this study (Figure 5). PEM fuel cells may be more appropriate for the study application because of their low operating temperature and ability to cycle on and off more readily
Figure 5. Schematic of a PEM fuel cell (DOE 2009)
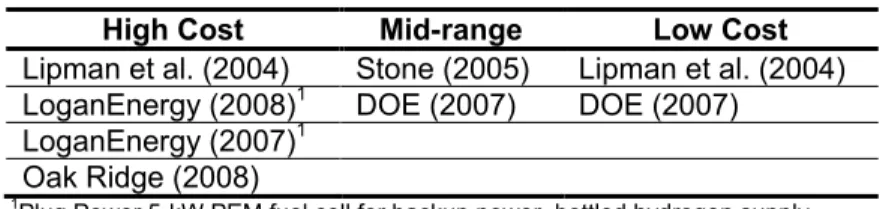
Table 4. References Used to Define PEM Cost and Efficiency Values High Cost Mid-range Low Cost
Lipman et al. (2004) Stone (2005) Lipman et al. (2004) LoganEnergy (2008)1 DOE (2007) DOE (2007)
LoganEnergy (2007)1 Oak Ridge (2008)
1Plug Power 5-kW PEM fuel cell for backup power, bottled hydrogen supply
Figure 6 illustrates the spread in costs for existing stationary PEM fuel cell installations at military bases and stationary PEM fuel cell cost estimates for mass-produced fuel cells (Dhathathreyan and Rajalakshmi 2007, Stone 2005, Lipman et al. 2004). The year is the installation year for the fuel cells installed at military bases and the year referenced in the studies. These costs are presented to illustrate the range in values for cost estimates and actual costs for installations of varying size and purpose. The fuel cells installed at the military bases were very small (5-kW) systems. No attempt was made to convert the dollars to a reference year.
0 2,000 4,000 6,000 8,000 10,000 12,000 14,000 16,000
1999 2000 2001 2002 2003 2004 2005 2006 2007 2008 2009
Year
Co
st
($/
kW
)
Stationary FC Stationary FC (MP) Military installation
Figure 6. Existing PEM fuel cell costs and estimates for mass production (MP) of PEM fuel cells Table 5 lists the specifications for the PEM fuel cell used in this analysis.
Current-timeframe costs presented for the PEM fuel cells are for the fuel cell stack and auxiliary BoP equipment taken from actual installations. Costs for a reformer/shift reactor are not included in these costs. PCS components for the electrolyzer and fuel cell are assumed to be included in the costs for these systems.
The efficiency values for the PEM fuel cell system are derived from DOE’s Multi-Year Research, Development, and Demonstration Plan (MYPP) status and target values for stationary and transportation PEM fuel cell power systems (DOE 2007). The high-cost and mid-range cases are based on large (250 kW and larger) stationary fuel cells. The low-cost case assumes somewhat smaller (80–100 kW) fuel cells typically used in automotive applications. For assessing progress against target values, the MYPP defines electrical efficiency for stationary PEM fuel cell systems as “the ratio of DC output energy to the LHV [lower heating value] of the input fuel (natural gas or LPG [liquefied petroleum gas]) average value at rated power over life of power plant.” The MYPP definition assumes that stationary hydrogen fuel cells will be integrated with a fuel reformer, which converts natural gas into a hydrogen-rich feed stream for the fuel cell. For the analysis of hydrogen energy storage scenarios, however, hydrogen is produced by an electrolyzer rather than by natural gas reforming. Therefore, efficiency values for the fuel cell without the reformer are used here. The MYPP shows an overall system
efficiency (including the reformer) of 32% in 2005 with a target of 40% in 2011.
Assuming an overall system efficiency of 40% and a reformer efficiency of 85% (Stevens and Lightner 2003) gives a fuel cell subsystem efficiency of 47%. The low-cost case efficiency value is based on DOE targets for automotive PEM fuel cells operating at 25%
listed in Table 4. DOE estimates of current costs and near-term targets ($2,500/kW and $750/kW, respectively, in $2005) for stationary PEM fuel cells are comparable to the high-cost and mid-range cases (DOE 2007). The value of $434/kW for the low-cost case is consistent with projected values for stationary fuel cells (Lipman et al. 2004) as well as DOE automotive fuel cell cost targets adjusted to account for low-power operation and increased BoP costs associated with the larger number of fuel cells required. Durability is assumed consistent with projections for stationary fuel cells.
Table 5. Components for Analysis of PEM Fuel Cell System
Component High-Cost Case Values Case Values Mid-Range Low-Cost Case Values Fuel cell system
installed capital
cost ($2008) $3,000/kW $813/kW $434/kW Stack replacement
frequency/cost
13 yr1/30% of initial capital
cost
15 yr/30% of initial capital
cost
26 yr1/30% of initial capital
cost
O&M costs $50/kW-yr2 $27/kW-yr $20/kW-yr2
Fuel cell life hour operation) 13 yr (20,000- hour operation) 15 yr (24,000- hour operation) 26 yr (40,000-Fuel cell system
efficiency (LHV) 47% 53%3 58%4
1DOE (2007), Chapter 3.4; 20,000 hours for stationary PEM reformate system fuel cells 5–250 kW has been
demonstrated. The goal for 2011 is, “By 2011, develop a distributed generation PEM fuel cell system operating on natural gas or LPG that achieves 40% electrical efficiency and 40,000 hours durability at $750/kW.” Validated by 2014. Twenty thousand hours (13 years) was used for the high-cost value, and 40,000 hours (26 years) was used for the low-cost value.
2Values are from Lipman et al. (2004).
3Current technology value for stack efficiency is approximately 55% (O’Hayre et al. 2006). Value is mid-way
between the high and low estimates.
4Assumed stack efficiency of 60% (MYPP 2010 target for direct hydrogen fuel cells for transportation) with 2%
conversion losses for integrated system.
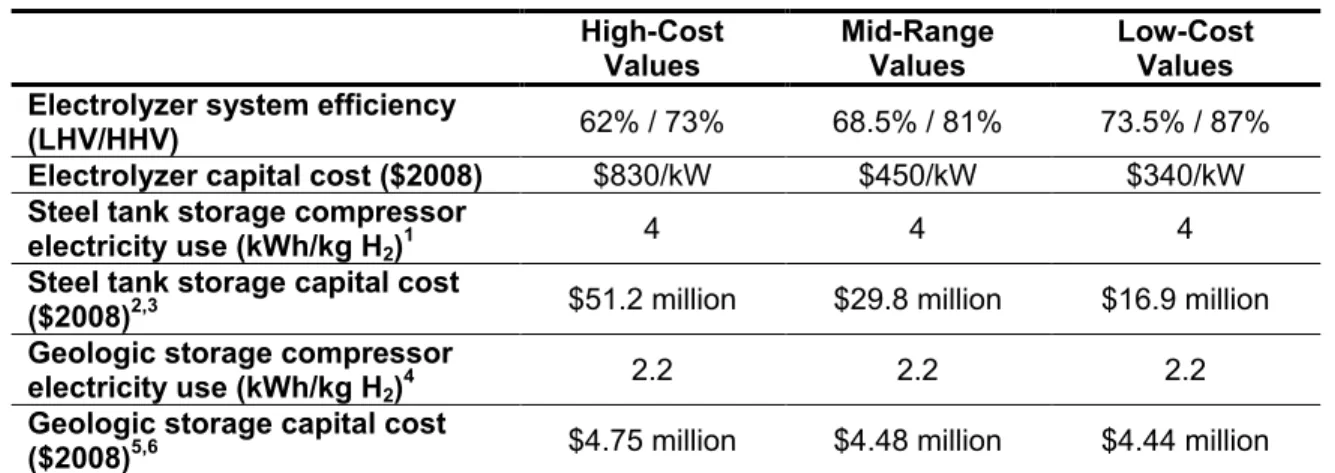
Table 6 shows electrolyzer and storage system efficiency and costs. The electrolyzer system is based on the H2A central electrolysis cost analysis models.8
8 Current Central Hydrogen Production from Grid Electrolysis version 2.1.1 and Future Central Hydrogen
Production from Grid Electrolysis version 2.1.1
The system modeled is a standalone, grid-powered electrolyzer system based on the Hydro bipolar alkaline electrolyzer (Atmospheric Type No. 5040 - 5150 Amp DC). Each electrolyzer is capable of producing 1,049 kg/day of hydrogen. The electrolyzer units use process water for electrolysis and cooling water for cooling. Potassium hydroxide (KOH) is needed for the electrolyte in the system. The system includes the following equipment: transformer, thyristor, electrolyzer unit, lye tank, feed water demineralizer, hydrogen scrubber, gas holder, two compressor units, deoxidizer, and twin tower dryer.
Table 6. Hydrogen fuel cell system efficiency and cost High-Cost
Values Mid-Range Values Low-Cost Values Electrolyzer system efficiency
(LHV/HHV) 62% / 73% 68.5% / 81% 73.5% / 87% Electrolyzer capital cost ($2008) $830/kW $450/kW $340/kW
Steel tank storage compressor
electricity use (kWh/kg H2)1 4 4 4
Steel tank storage capital cost
($2008)2,3 $51.2 million $29.8 million $16.9 million
Geologic storage compressor
electricity use (kWh/kg H2)4 2.2 2.2 2.2
Geologic storage capital cost
($2008)5,6 $4.75 million $4.48 million $4.44 million 1Hydrogen compression for tube trucks (05D_H2A_Delivery_Scenario_Analysis_Model_Version_2.02.xls).
2Capital cost includes tanks, compressor, and BoP. 3Hydrogen compressed to 2,500 psi.
4Hydrogen compression for bulk storage (05D_H2A_Delivery_Scenario_Analysis_Model_Version_2.02.xls). 5Hydrogen compressed to 1,800 psi.
6Cavern and compressor.
3.1.2 Hydrogen Fuel Cell System Cost Results
Figure 7 presents the NPC values for the hydrogen fuel cell energy arbitrage scenario with geologic hydrogen storage. For all the fuel cell cases, purchase of off-peak electricity constitutes a significant fraction of the overall cost. This is due to the low overall roundtrip efficiency of the systems. The roundtrip LHV efficiencies are 28%, 35%, and 41% for the high-cost, mid-range, and low-cost cases, respectively.
$0 $50,000,000 $100,000,000 $150,000,000 $200,000,000 $250,000,000 $300,000,000 $350,000,000 $400,000,000 El ect rici ty Fuel C el l El ect ro lyze r H yd rogen T ank Fi xe d O &M To ta l syst em El ect rici ty Fuel C el l El ect ro lyze r H yd rogen T ank Fi xe d O &M To ta l syst em El ect rici ty Fuel C el l El ect ro lyze r H yd rogen T ank Fi xe d O &M To ta l syst em Net P resen t C ost Capital Replacement O&M Electricity
An additional case was run using the DOE cost target value of $45/kW for automotive PEM fuel cells, which is almost ten times lower than the $434/kW for the PEM fuel cells in the low-cost case (DOE 2007). The automotive fuel cell was assumed to have a 5,000-hour life, about one quarter to one eighth of the expected operating life for stationary PEM fuel cells. The total system NPC for the automotive fuel cell case is approximately $116 million, giving an LCOE of about $0.15/kWh. This compares with a NPC of $134 million and LCOE of about $0.18/kWh for the stationary fuel cell with geologic
hydrogen storage low-cost case. The high replacement frequency for the automotive fuel cell reduces the advantage of the lower capital cost.
Figure 8 presents the NPC for the hydrogen fuel cell energy arbitrage scenario using aboveground steel tank storage for the hydrogen. As for the geologic storage fuel cell cases, purchase of off-peak electricity constitutes a significant fraction of the overall cost. The roundtrip LHV efficiencies are 27%, 34%, and 39% for the high-cost, mid-range, and low-cost cases, respectively.
$0 $50,000,000 $100,000,000 $150,000,000 $200,000,000 $250,000,000 $300,000,000 $350,000,000 $400,000,000 $450,000,000 El ect rici ty Fuel C el l El ect ro lyze r H yd rogen T ank Fi xe d O &M To ta l syst em El ect rici ty Fuel C el l El ect ro lyze r H yd rogen T ank Fi xe d O &M To ta l syst em El ect rici ty Fuel C el l El ect ro lyze r H yd rogen T ank Fi xe d O &M To ta l syst em N et P resen t C ost Capital Replacement O&M Electricity
High-Cost Case Mid-Range Case Low-Cost Case
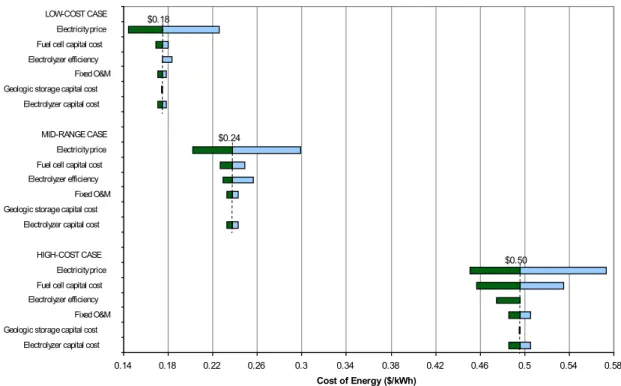
Figure 8. Hydrogen fuel cell energy arbitrage scenario with aboveground storage NPC Figure 9 and Figure 10 present the sensitivities for the hydrogen fuel cell energy arbitrage scenarios. For the fuel cell cases, the electrolyzer efficiency baseline value was varied for the three cost cases (see Table 6). These same values were used in the sensitivity
analysis, resulting in “one-tailed” sensitivities for the low- and high-cost cases. In the mid-range and low-cost geologic storage cases, the electrolyzer efficiency is the second most important cost driver after off-peak electricity price. The overall cost impact of varying the geologic storage cost by ± 50% has a negligible effect on the overall cost of delivered energy for the geologic storage cases because of the very high energy density of
hydrogen. Using aboveground storage rather than geologic storage adds between 6% and 18% to the cost of delivered energy.
Nominal cost values shown may not line up precisely with x-axis values due to rounding.
Figure 9. Cost sensitivity for hydrogen fuel cell scenario with geologic hydrogen storage
0.14 0.18 0.22 0.26 0.3 0.34 0.38 0.42 0.46 0.5 0.54 0.58
Electrolyzer capital cost Geologic storage capital cost Fixed O&M Electrolyzer efficiency
Fuel cell capital cost Electricity price HIGH-COST CASE Electrolyzer capital cost Geologic storage capital cost Fixed O&M Electrolyzer efficiency
Fuel cell capital cost Electricity price MID-RANGE CASE Electrolyzer capital cost Geologic storage capital cost Fixed O&M Electrolyzer efficiency
Fuel cell capital cost Electricity price LOW-COST CASE
Cost of Energy ($/kWh) $0.24
$0.50 $0.18
0.14 0.18 0.22 0.26 0.3 0.34 0.38 0.42 0.46 0.5 0.54 0.58 0.62
Electrolyzer efficiency Electrolyzer capital cost Fixed O&M Tank storage capital cost Fuel cell capital cost Electricity price HIGH-COST CASE Electrolyzer efficiency Electrolyzer capital cost Fixed O&M Tank storage capital cost Fuel cell capital cost Electricity price MID-RANGE CASE Electrolyzer efficiency Electrolyzer capital cost Fixed O&M Tank storage capital cost Fuel cell capital cost Electricity price
LOW-COST CASE $0.20
$0.28
3.1.3 Hydrogen Expansion Combustion Turbine System Description
Several companies are developing hydrogen combustion turbines. Toshiba is developing a hydrogen combustion turbine that generates steam from hydrogen and oxygen to run a steam turbine for electricity under the Japanese World Energy Network (WE-NET) research program. Pilavachi et al. (2009) list the efficiency for a hydrogen combustion turbine in the 70% range (LHV). The technology involves a combustion chamber in which hydrogen and oxygen combine to produce steam, which is then used to drive a turbine. In the energy storage scenario envisioned for this study, pure oxygen is collected from the electrolyzer and used for co-firing with the hydrogen in the plant. Costs for the hydrogen turbine using the efficiency stated in Pilavachi et al. (2009) represent the low-cost case. Collection, compression, and storage of the oxygen are assumed to be included in the costs. In 2005, General Electric and Siemens were awarded DOE research grants for hydrogen gas turbine development as part of advanced hydrogen turbine research for use in integrated gasification combined cycle (IGCC) plants (DOE-FE 2005).
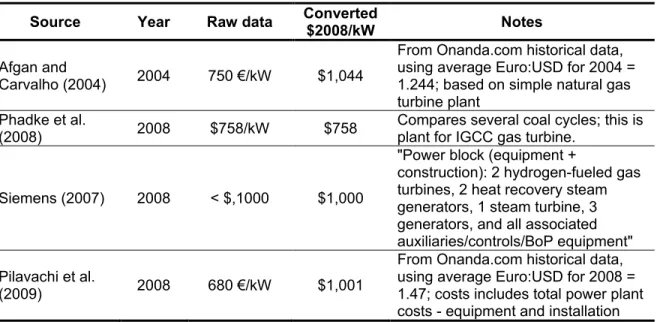
Costs shown in Table 7 were collected for gas turbine power plants that are part of a larger system. Costs include equipment, installation, auxiliaries, and BoP. Costs for hydrogen gas turbines are generally seen in the context of IGCC or biomass IGCC plants.
Table 7. Costs for Conventional and Hydrogen-Fueled Gas Turbine Plants Source Year Raw data Converted $2008/kW Notes
Afgan and
Carvalho (2004) 2004 750 €/kW $1,044
From Onanda.com historical data, using average Euro:USD for 2004 = 1.244; based on simple natural gas turbine plant
Phadke et al.
(2008) 2008 $758/kW $758 Compares several coal cycles; this is plant for IGCC gas turbine. Siemens (2007) 2008 < $,1000 $1,000
"Power block (equipment +
construction): 2 hydrogen-fueled gas turbines, 2 heat recovery steam generators, 1 steam turbine, 3 generators, and all associated auxiliaries/controls/BoP equipment" Pilavachi et al.
(2009) 2008 680 €/kW $1,001
From Onanda.com historical data, using average Euro:USD for 2008 = 1.47; costs includes total power plant costs - equipment and installation
A hydrogen expansion combustion turbine was substituted for the PEM fuel cell in two cases, one using geologic storage and one using aboveground tank storage. Costs for the electrolyzer, compressor, and storage system are the same as for the mid-range cost fuel cell cases. Aspen modeling was performed to derive the energy balance information for the hydrogen combustion turbine cases. A process flow diagram for the geologic storage case is shown in Figure 11. Hydrogen is compressed to a maximum cavern pressure of 1,262 psia using a four-stage compressor with intercoolers.
For the power generation system, hydrogen from the storage system is preheated with combustion exhaust prior to the expander stage. Compression requires approximately 0.76 kWh/kg of hydrogen. Approximately 0.83 kWh/kg is recovered from the preheated hydrogen in the expander. For the cost analysis, it is assumed that additional electricity is purchased for compression and that compression energy is recovered. The combustion turbine efficiency values given in Table 8 include additional energy recovered from expansion. Combustion air is fed to the turbine at a stoichiometric ratio of 3.7. The high airflow provides cooling, which reduces nitrogen oxides (NOx) emissions (Dennis 2008a, Dennis 2008b, Juste 2006). NOx emissions could be reduced further using a catalytic process.
Approximately 58% of the turbine output power is consumed for compression of the air for the modeled combustion turbine. The energy efficiency of the combustion turbine modeled in Aspen was used for the high-cost case. Plant cost values from Phadke et al. (2008) were used for the low-cost case. Cost values for the analysis of the hydrogen combustion turbine are given in Table 8.
Table 8. Components for Analysis of Hydrogen Combustion Turbine System Component1 High-Cost Values (aboveground
storage)
Mid-Range Values
(geologic storage) (geologic storage) Low-Cost Values Expansion combustion
turbine $1,000/kW $1,000/kW $760/kW
Replacement
frequency/cost 20 years / 100% of initial capital cost 20 years / 100% of initial capital cost 20 years / 100% of initial capital cost
Turbine O&M costs $0.008/kW-yr $0.008/kW-yr $0.006/kW-yr
Combustion turbine
efficiency2 42% 70% 70%
1Pilavachi et al. (2009). Costs are presented in Euros. Values are assumed to be in €2009. A conversion rate of $1.47/€
was assumed.
2Pilavachi et al. (2009).
3.1.4 Hydrogen Expansion Combustion Turbine System Cost Results
Figure 12 presents the NPC for the hydrogen expansion combustion turbine energy arbitrage scenario using aboveground steel tank storage for the high-cost case and geologic storage for the mid-range and low-cost cases. The roundtrip (AC-to-AC) efficiency for the low-cost and mid-range cases is 48% (LHV). The roundtrip efficiency for the high-cost case is 29% (LHV).
Figure 11. Process flow diagram for hydrogen combustion turbine system 470 1232 H2-01 264 350 H2-02 -2.8 20 15 AIR-IN 547 350 AIR-BURN 65.6 W-COMPR 1288 350 BURN-OUT 516 15 GT-OUT -47.3 40 1232 SRGOUT 474 15 EXHAUST 70 300 HPH2-01 118 430 HPH2-02 0.1 WCMP1 50 430 HPH2-03 95 617 HPH2-04 0.1 WCMP2 50 617 HPH2-05 95 884 HPH2-06 0.1 WCMP3 50 884 HPH2-07 95 1268 HPH2-08 0.1 WCMP4 20 300 HPWATER -29.4 ELZRUSED 70 300 ELZRMIX 20 15 WATERIN 0.0 W -50.1 TOTALPOW W 0.6 CMPRWORKW -15.9 ELZRLOSS Q -45.3 ELZRTOT Q 70 300 O2 H2-EXP-1 W=-2.8 AIR-CMPR W=65.6 BURNER Q=0.0 G-TRBN W=-47.3 H2HEATER Q=5.9 H2CMPR01 W=0.1 H2CMPR02 W=0.1 H2CMPR03 W=0.1 H2CMPR04 W=0.1 CLR01 Q=-0.2 CLR02 Q=-0.1 CLR03 Q=-0.1 ELZR Q=29.4 WATERPMP W=0.0
WMI X E R
B3 B5 Q=-0.0 Temperature (C) Pressure (psi) Duty (MW) Power(MW) Q Duty (MW) W Power(MW) STORAGE El ec trol yz er sy st em H ydr ogen co m pr es si on H ydr ogen st or age Ai r co m pr es si on Ex pan de r / com bus tio n tur bi ne
$0 $50,000,000 $100,000,000 $150,000,000 $200,000,000 El ect rici ty C om bust ion T ur bi ne El ect ro lyze r H yd rogen T ank Fi xe d O &M To ta l syst em El ect rici ty C om bust ion T ur bi ne El ect ro lyze r G eol ogi c S tor age Fi xe d O &M To ta l syst em El ect rici ty C om bust ion T ur bi ne El ect ro lyze r G eol ogi c S tor age Fi xe d O &M To ta l syst em N et P resen t C ost Capital Replacement O&M Electricity
High-Cost Case Mid-Range Case Low-Cost Case
Figure 12. NPC values for the hydrogen turbine cases
Figure 13 shows the sensitivity of the LCOE to variations in cost and efficiency values for the hydrogen turbine cases. In all cases, off-peak electricity price is the primary cost sensitivity value owing to the low roundtrip efficiency of the system.
0.14 0.16 0.18 0.2 0.22 0.24 0.26 0.28 0.3 0.32 0.34
Steel Tank capital cost Fixed O&M Electrolyzer capital cost Combustion Turbine capital cost Electrolyzer efficiency Electricity price HIGH-COST CASE Geologic Storage capital cost Fixed O&M Electrolyzer capital cost Combustion Turbine capital cost Electrolyzer efficiency Electricity price MID-RANGE CASE Geologic Storage capital cost Fixed O&M Electrolyzer capital cost Combustion Turbine capital cost Electrolyzer efficiency Electricity price LOW-COST CASE
Cost of Energy ($/kWh) $0.17
$0.19
$0.26
3.1.5 Excess Hydrogen for the Vehicle Market System Description and Costs
Two scenarios for production of excess hydrogen were evaluated. The mid-range cost cases (aboveground and geologic storage) for the hydrogen energy arbitrage scenario were used as the base case for the analysis of excess hydrogen production.
In the first scenario, it was assumed that demand exists for five gaseous tankers (280 kg per tanker) of excess hydrogen per day. The system was optimized for the hydrogen tank size and electrolyzer system size to meet both the fuel cell demand for hydrogen and supply the gaseous tanker trucks using off-peak electricity (i.e., the electrolyzer is operated for 18 off-peak hours on weekdays and 48 hours over each weekend). It was assumed that the tankers would be filled approximately every two hours. The NPC for the tanker truck excess hydrogen case is presented in Figure 14.
$0 $50,000,000 $100,000,000 $150,000,000 $200,000,000 $250,000,000 El ect rici ty Fuel C el l El ect ro lyze r H yd rogen T ank Fi xe d O &M To ta l syst em El ect rici ty Fuel C el l El ect ro lyze r H yd rogen T ank Fi xe d O &M To ta l syst em N et P resen t C ost Capital Replacement O&M Electricity
Mid-Range Above Ground Case with 5
Tankers Excess Hydrogen per Day Mid-Range Above Ground Case without Excess Hydrogen
Figure 14. NPC comparison for five tanker trucks of excess hydrogen per day The untaxed levelized cost of hydrogen for this scenario is $4.69/kg. This cost compares to a value of $4.98/kg for hydrogen in the equivalent energy arbitrage scenario. For reference, the current forecourt hydrogen production H2A electrolysis case using the same electricity price ($0.038/kWh) and production level (1,400 kg/day) produces hydrogen at an untaxed levelized cost of $4.00/kg for the production process and $5.05/kg at the dispenser.9
A similar comparison was done assuming that hydrogen would be stored in a geologic formation and that excess hydrogen would be fed into a pipeline at the rate of 500
kg/hour (12,000 kg/day). The pipeline demand for hydrogen in this case is approximately
9 Current Forecourt Hydrogen Production from Grid Electrolysis (1,500 kg per day) version 2.1.2, 100%
equal to the demand for hydrogen for the energy arbitrage scenario. As for the tanker case, it was assumed that the electrolyzer would be operated only during off-peak hours. The NPC for the pipeline excess hydrogen case is presented in Figure 15.
$0 $50,000,000 $100,000,000 $150,000,000 $200,000,000 $250,000,000 $300,000,000 El ect rici ty Fuel C el l El ect ro lyze r G eol ogi c st or age Fi xe d O &M To ta l syst em El ect rici ty Fuel C el l El ect ro lyze r G eol ogi c st or age Fi xe d O &M To ta l syst em N et P resen t C ost Capital Replacement O&M Electricity
Mid-Range Geologic Storage Case with
500 kg/h Excess Hydrogen Mid-Range Geologic Storage Case without Excess Hydrogen
Figure 15. NPC comparison for 500 kg/hour excess hydrogen
The levelized cost of hydrogen for this scenario is $3.33/kg. This cost compares to a value of $4.21 for hydrogen in the equivalent energy arbitrage scenario. For reference, the current central hydrogen production H2A electrolysis case using the same electricity price ($0.038/kWh) and production level (12,000 kg/day) results in an untaxed hydrogen levelized cost of $6.86.10
Sensitivity analyses for the two excess hydrogen cases are presented in Figure 16 and Figure 17. The price of off-peak electricity is the predominant cost driver for the cost of delivered energy in both the excess hydrogen cases. Reducing the price of off-peak electricity from $0.038/kWh to $0.025/kWh reduces the cost of delivered energy by 14% for the five-tanker-per-day excess hydrogen scenario and 13% for the equivalent energy arbitrage scenario (mid-range case with tank storage). The cost of energy is reduced by 19% for the 500 kg/hour case. In contrast, the cost of energy is reduced by 15% for the mid-range geologic storage fuel cell energy arbitrage case. The increased sensitivity of the excess hydrogen cases to the price of off-peak electricity is due to the increased impact of the electrolyzer operating parameters on the overall cost of energy.
The nominal cost value shown does not line up precisely with the x-axis value due to rounding.
Figure 16. Sensitivity analysis for five tankers per day of excess hydrogen production
The nominal cost value shown does not line up precisely with the x-axis value due to rounding.
Figure 17. Sensitivity analysis for 500 kg/hour excess hydrogen production
0.25 0.26 0.27 0.28 0.29 0.3 0.31 0.32 0.33 0.34 0.35 0.36 0.37
Fuel cell life [41,000 hrs - 20,000 hrs]
Electrolyzer efficiency [87% - 73%] Fuel cell efficiency [58% - 47%] Fuel cell and hydrogen tanks capital cost [0.8/0.5 - 1.2/1.5 multiplier]
Electricity price [2.5 c/kWh -6c/kWh]
Cost of Energy ($/kWh) $0.30
0.29 0.32 0.35 0.38 0.41 0.44 0.47 0.5
Electrolyzer capital cost Fixed O&M Geologic Storage capital cost Fuel Cell capital cost Electrolyzer efficiency Electricity price
Cost of Energy ($/kWh) $0.37
3.2 Batteries
Lead-acid batteries have been used for large-scale energy storage for more than a century, and bulk energy storage systems employing other battery technologies are now being built (Schoenung and Hassenzahl 2003). A nickel-cadmium, ½-hour, 26-MW system has been installed in Fairbanks, Alaska. High-temperature sodium sulfur batteries have been installed for bulk energy storage applications in Japan and the United States. Vanadium redox batteries are a newer technology with demonstrated systems up to 1.5 MWh and power ratings up to 1.5 MW.
Costs used in this analysis are primarily derived from two reports by Schoenung (Schoenung and Hassenzahl 2003, Schoenung and Eyer 2008) and two Electric Power Research Institute (EPRI) publications (EPRI-DOE 2003, EPRI 2007). The EPRI reports provide information about the costs included in BoP estimates for batteries. It was assumed that these costs are common to all battery energy storage systems unless
otherwise noted. EPRI estimates BoP at $100/kW for commercial but not fully integrated systems and $50/kW for fully integrated systems (EPRI-DOE 2003). The EPRI
commercial but not fully integrated estimate was used for the mid-range cases. BoP items include the following:
• Project engineering
• Construction management
• Grid connection (transformers, breakers/switches, extension of power lines) connection at 13.8 KV
• Land
• Access
• Procurement
• Permitting
In the EPRI-DOE (2003) report, the battery cost includes an environmentally controlled building, if needed, at $100/ft2 + 20% add-on for a multi-story building. This accounts for roughly $70/kWh or $17/kW (EPRI-DOE 2003). For the Schoenung studies, building costs are included in the BoP. BoP costs are presented in $/kWh or $/kW depending on the source of the estimate. Following are descriptions of vanadium redox, nickel cadmium, and sodium sulfur batteries.
3.2.1 Vanadium Redox Batteries
Vanadium redox (reduction-oxidation) batteries, a type of flow battery, are based on the transfer of electrons between forms of vanadium. The power and storage capacity can be specified separately for the particular application. The size of the electrolyte tanks describes the nominal storage capacity, and the size of the cell converter rates the power level capability. Currently, the major suppliers of vanadium redox batteries are Prudent Energy, which purchased VRB Power Systems Inc. in early 2009, and Sumitomo Electric Industries of Japan. There are three somewhat newer companies in the field as well:
2008, Schoenung and Hassenzahl 2003) and EPRI (EPRI 2007, EPRI-DOE 2003). Demonstrated installations range in size from 3 MW for 1.5 seconds of storage to 500 kW for up to 10 hours of storage. Typical power ranges are 100 kW to 3 MW, and storage capacity is typically less than 3 MWh (EPRI-DOE 2003). Cost values for the various systems are presented in Table 9.
The electrolyte of vanadium redox batteries exhibits little signs of degradation, and the reports suggest that it will not need replacement during the life of the plant. Lifetimes of the electrolyte solution are predicted to be greater than 50 years, at which time the electrolyte can be reused or the more precious vanadium extracted. The capacity of the electrolyte is approximately 20–30 Wh/L (EPRI 2007). If the long-term cost of vanadium pentoxide stabilizes around $4.00–$5.00/lb, it should not become an economic hindrance, but it does constitute approximately 35% of the capital cost of a plant. Prices between 2001 and 2007 have ranged from $1.50–$26.00/lb but are expected to stabilize around $4.00–$5.00/lb (EPRI 2007). Figure 18 illustrates the recent volatility in vanadium prices. The price of the vanadium pentoxide electrolyte for vanadium redox batteries is expected to track vanadium prices.
Figure 18. Vanadium prices 1996–2005 (Metalprices.com 2009) Capital cost for the electrolyte and electrolyte storage tank are included in energy capacity ($/kWh) costs in Table 9. Power-related costs ($/kW) for vanadium redox batteries include the cell stack and PCS.
Table 9. Literature Values for Vanadium Redox Battery Costs Source of
Estimate
Power Related Costs ($/kW)
Energy Capacity Related Cost
($/kWh)
BoP Cost ($/kW)
Replacement Cost ($/kWh) / Frequency
Fixed O&M ($/kW-yr) / Fixed Costs
Schoenung and Hassenzahl
(2003)1 175 600
30
($/kWh) 600/10 yr 20
Schoenung and
Eyer (2008)2 175 350 ($/kWh) 30 350/10 yr 20
EPRI-DOE
(2003)3 397 213 100 50% mature price/10 yr 54.8
EPRI (2007)4
(current 2007$) 1,800 300 500 300 ($/kW) 54.8/250,000
EPRI (2007)5
(future 2013$) 750 210 500 300 ($/kW) 54.8/280,000
EPRI (2006) * 300–6506 * * *
EPRI (2003) [DR/peak shaving 1MW/4MWh] (prototype/first/ nth)
2,260/700/
500 550/230/150 * * 12/4/2
EPRI (2003) [spinning reserve
10MW/20MWh] (prototype/first/ nth)
2,150/608/
426 1,050/410/ 250 * * 1.2/0.4/0.2
EPRI (2003) [windfarm stabilization/ dispatch 10MW/80MWh] (prototype/first/ nth)
2,150/608/
426 300/140/100 * * 1.2/0.4/0.2
* Not available/not applicable
1The application referenced in the study is for a 2.5-MW, 10-MWh facility for Boulder City, UT.
2Schoenung and Eyer (2008) use adjusted costs for the battery with respect to the previous study by Schoenung and
Hassenzahl (2003). Therefore, replacement and other costs are provided per the previous study.
3The application referenced in the study requires that the system provide 10-hour load shifting of stored energy from
periods of low value to periods of high value. The reference duty cycle for analysis is scheduled 10 hours, 1 event per day, 250 events per year.
4“Capital Cost = $2,300 x (kW rating) + $300 x (kWh rating) + $250,000 (2007 dollars). This equation produces figures
within about 5% of the cost figure estimated through the use of the more sophisticated cost model built for this analysis, for systems with power capacities ranging from 200 kW to 10 MW, and with durations from 2 hours to 16 hours.”
5“Capital Cost = $1,250 x (kW rating) + $210 x (kWh rating) + $280,000 (2013 dollars). This equation produces figures
within about 5% of the cost figure estimated through the use of the more sophisticated cost model built for this analysis, for systems with power capacities ranging from 200 kW to 10 MW, and with durations from 2 hours to 16 hours.”
6VRB Power Systems Inc. was purchased by Prudent Energy in 20
3.2.2 Nickel Cadmium Batteries
Nickel cadmium is one of five nickel-based battery types and the most common nickel electrode battery in the utility industry (EPRI-DOE 2003). There are several commercial suppliers of nickel cadmium, including Alcad, Hoppecke Batterien GmbH, Marathon Power Technologies Company, Saft, and Varta. Information regarding the nickel cadmium batteries comes primarily from Schoenung and Eyer (2008), EPRI (2006), Schoenung and Hassenzahl (2003), and EPRI-DOE (2003). The most significant demonstrated utility-scale project is a 13-MWh (26 MW at 30 min.) system outside Fairbanks, Alaska, composed of 13,760 Saft batteries. Nickel cadmium batteries have generally good energy density, more tolerance to abuse, and longer lifetimes than lead-acid batteries; Table 10 lists advantages and disadvantages. Nickel cadmium batteries require enclosure in a temperature-controlled building. Building costs are included in the battery costs for the EPRI studies and in the BoP costs for the Schoenung studies. Cost values for the nickel cadmium batteries are presented in Table 11.
Table 10. Advantages and disadvantages of nickel cadmium batteries
Advantages Disadvantages
• Durability, long operational life: for sintered plate NiCd life = 3,500 cycles @ 80% depth of discharge = 13 years @ 260 cycles/year1
• Lower maintenance cost than lead-acid batteries: sealed batteries require cleaning, vented batteries require adding water several times per year to counter losses from
electrolysis and evaporation2
o Visual inspection for damage, leakage, etc.
o Cleaning
o Measuring voltage, resistance, specific gravity
o Water replacement
o Measuring resistance between terminals
o Retorquing terminal connections o Checking accuracy of DC voltage,
DC current, temperature sensors o Fixed O&M labor = $50/hr,
$900/module per year, includes property taxes and insurance at 2% of initial capital cost
• High variability with temperature: batteries must be cooled; assume 20% battery-life reduction for every 10°C operating temperature rise
• Poor charge retention (2%–5% per month at room temperature, vs. lead acid ~1% per month), highest immediately after charging, higher at higher temperature, mitigated by:
o Regular cleaning to avoid deposition of KOH (current path between electrodes)
o Charging cold, slight warming before discharge to maximize capacity (highest cold) and discharge voltage (highest at high temperatures)
• Low power density
• Gas evolution during operation – H2 and O2 evolved from electrolysis of electrolyte during charging; for vented systems, H2 monitors are needed
• Higher cost than lead-acid batteries • Use of toxic metal cadmium: no exposure
during operation, most recycled
1Values of 10, 13, and 15 years were used in sensitivity cases. 2Vented system assumed.