ADVANCE COPY
A UNEP Synthesis Report
2014
United Nations Environment Programme P.O. Box 30552 - 00100 Nairobi, Kenya
Tel.: +254 20 762 1234 Fax: +254 20 762 3927 e-mail: [email protected]
www.unep.org
www.unep.org
978-92-807-3413-3 DEW/1833/NA
UNEP promotes
environmentally sound practices
globally and in its own activities. This
report is printed on paper from sustainable
forests including recycled fibre. The paper is
chlorine free, and the inks vegetable-based.
Our distribution policy aims to reduce
without special permission from the copyright holder, provided acknowledgement of the source is made. UNEP would appreciate receiving a copy of any publication that uses this publication as a source.
No use of this publication may be made for resale or any other commercial purpose whatsoever without prior permission in writing from the United Nations Environment Programme. Applications for such permission, with a statement of the purpose and extent of the reproduction, should be addressed to the Director, DCPI, UNEP, P. O. Box 30552, Nairobi 00100, Kenya.
Disclaimers
Mention of a commercial company or product in this document does not imply endorsement by UNEP or the authors. The use of information from this document for publicity or advertising is not permitted. Trademark names and symbols are used in an editorial fashion with no intention on infringement of trademark or copyright laws. The views expressed in this publication are those of the authors and do not necessarily reflect the views of the United Nations Environment Programme. We regret any errors or omissions that may have been unwittingly made. © Images and illustrations as specified.
Citation
This document may be cited as:
UNEP 2014. The Emissions Gap Report 2014. United Nations Environment Programme (UNEP), Nairobi A digital copy of this report along with supporting appendices are available at
http://www.unep.org/emissionsgapreport2014/
This project is part of the International Climate Initiative. The Federal Ministry for the Environment, Nature Conservation, Building and Nuclear Safely supports this initiative on the basis of a decision adopted by the German Bundestag.
Cover Photo Credits
© Soloviova Liudmyla/Shutterstock © WDG Photo
A UNEP Synthesis Report
2014
without special permission from the copyright holder, provided acknowledgement of the source is made. UNEP would appreciate receiving a copy of any publication that uses this publication as a source.
No use of this publication may be made for resale or any other commercial purpose whatsoever without prior permission in writing from the United Nations Environment Programme. Applications for such permission, with a statement of the purpose and extent of the reproduction, should be addressed to the Director, DCPI, UNEP, P. O. Box 30552, Nairobi 00100, Kenya.
Disclaimers
Mention of a commercial company or product in this document does not imply endorsement by UNEP or the authors. The use of information from this document for publicity or advertising is not permitted. Trademark names and symbols are used in an editorial fashion with no intention on infringement of trademark or copyright laws. The views expressed in this publication are those of the authors and do not necessarily reflect the views of the United Nations Environment Programme. We regret any errors or omissions that may have been unwittingly made. © Images and illustrations as specified.
Citation
This document may be cited as:
UNEP 2014. The Emissions Gap Report 2014. United Nations Environment Programme (UNEP), Nairobi A digital copy of this report along with supporting appendices are available at
http://www.unep.org/emissionsgapreport2014/
This project is part of the International Climate Initiative. The Federal Ministry for the Environment, Nature Conservation, Building and Nuclear Safely supports this initiative on the basis of a decision adopted by the German Bundestag.
Cover Photo Credits
© Soloviova Liudmyla/Shutterstock © WDG Photo
ii
A
cknowledgments
The United Nations Environment Programme (UNEP) would like to thank the members of the steering committee, the lead and contributing authors, reviewers and the secretariat for their contribution to the preparation of this assessment report.
Authors and reviewers have contributed to the report in their individual capacities. Their affiliations are only mentioned for identifi-cation purposes.
Project steering committee
Jacqueline McGlade (United Nations Environment Programme), Bert Metz (European Climate Foundation), Ji Zou (National Centre for Climate Change Strategy and International Cooperation), John Christensen (United Nations Environment Programme), Katia Simeonova (United Nations Framework Convention on Climate Change), Klaus Müschen (Federal Environment Agency of Germany), María Paz Cigarán (Libélula), Merlyn van Voore (United Nations Environment Programme), Mónica Araya (Nivela), Simon Maxwell (Climate and Development Knowledge Network), Youba Sokona (South Centre)
Chapter 1
Lead authors: Joseph Alcamo (University of Kassel), Daniel Puig (UNEP DTU Partnership), Joeri Rogelj (ETH Zurich / International Institute for Applied Systems Analysis)
Chapter 2
Lead authors: Joeri Rogelj (ETH Zurich / International Institute for Applied Systems Analysis), David McCollum (International Institute for Applied Systems Analysis), Steven Smith (Pacific Northwest National Laboratory)
Contributing authors: Katherine Calvin (Pacific Northwest National Laboratory), Leon Clarke (Pacific Northwest National Laboratory), Monica Crippa (European Commission’s Joint Research Centre) , Amit Garg (Indian Institute of Management Ahmedabad), Kejun Jiang (Energy Research Institute), Volker Krey (International Institute for Applied Systems Analysis), Jason Lowe (Hadley Centre), Greet Maenhout (European Commission’s Joint Research Centre), Keywan Riahi (International Institute for Applied Systems Analysis), Michiel Schaeffer (Climate Analytics), Detlef van Vuuren (PBL Netherlands), Chen Wenying (Tsinghua University)
Chapter 3
Lead authors: Michel den Elzen (PBL Netherlands), Taryn Fransen (World Resources Institute)
Contributing authors: Jusen Asuka (Tohoku University), Thomas Damassa (World Resources Institute), Hanna Fekete (NewClimate Institute), Jørgen Fenhann (UNEP DTU Partnership), Andries Hof (PBL Netherlands), Kejun Jiang (Energy Research Institute), Kelly Levin (World Resources Institute), Ritu Mathur (The Energy and Resources Institute), Mark Roelfsema (PBL Netherlands), Roberto Schaeffer (Federal University of Rio de Janeiro)
Chapter 4
Lead authors: Kornelis Blok (Ecofys), Tim Farrell (Copenhagen Centre on Energy Efficiency), Niklas Höhne (NewClimate Institute), Ritu Mathur (The Energy and Resources Institute), Daniel Puig (UNEP DTU Partnership), Lisa Ryan (University College Dublin)
Contributing authors: Andreas Ernst (University of Kassel), Lewis Fulton (University of California at Davis), Kelly Levin (World Resources Institute),
iii
Neha Pahuja (The Energy and Resources Institute),Lynn Price (Lawrence Berkeley National Laboratory), Julia Reinaud (European Climate Foundation), Hans-Paul Siderius (Netherlands Enterprise Energy), Diana Ürge-Vorsatz (Central European University)
Reviewers
Mónica Araya (Nivela), Jusen Asuka (Tohoku University), Juliane Berger (Federal Environment Agency of Germany), Monica Crippa (European Commission’s Joint Research Centre), Thomas Damassa (World Resources Institute), Rob Dellink (Organisation for Economic Co-operation and Development), Michel den Elzen (PBL Netherlands), Lewis Fulton (University of California at Davis), Tatsuya Hanaoka (National Institute for Environmental Studies), Andries Hof (PBL Netherlands), Lisa Hunsinger (Federal Environment Agency of Germany), Ariane Labat (European Commission), Benoît Lebot (International Partnership for Energy Efficiency Cooperation), Simone Lucatello (Instituto Mora), Greet Maenhout (European Commission’s Joint Research Centre), Simon Maxwell (Climate and Development Knowledge Network), Bert Metz (European Climate Foundation), Axel Michaelowa (Perspectives), Lera Miles (World Conservation Monitoring Centre), Klaus Müschen (Federal Environment Agency of Germany), Elizabeth Sawin (Climate Interactive), Roberto Schaeffer (Federal University of Rio de Janeiro), Katia Simeonova (United Nations Framework Convention on Climate Change), Christopher Taylor (Department of Energy and Climate Change), Zhao Xiusheng (Tsinghua University)
Thanks also to
Unnada Chewpeecha (Cambridge Econometrics), Vijay Deshpande (Copenhagen Centre on Energy Efficiency), Philip Drost (United Nations Environment Programme), María Elena Gutiérrez (Libélula), Séraphine Häussling (United Nations Environment Programme), Kimon Keramidas (Enerdata), Tom Kober (ECN Netherlands), Cecilie Larsen (UNEP DTU Partnership), Prakriti Naswa (UNEP DTU Partnership), Ksenia Petrichenko
(Copenhagen Centre on Energy Efficiency), Hector Pollitt (Cambridge Econometrics), Uwe Remme (International Energy Agency), Aristeidis Tsakiris (Copenhagen Centre on Energy Efficiency), Steffi Richter (Federal Environment Agency of Germany)
Chief Scientific Editor
Joseph Alcamo (University of Kassel)
Editorial team
Daniel Puig (UNEP DTU Partnership), Bert Metz (European Climate Foundation), Volodymyr Demkine (United Nations Environment Programme)
Project coordination
Daniel Puig (UNEP DTU Partnership), Volodymyr Demkine (United Nations Environment Programme), Emma A. Igual (UNEP DTU Partnership), Anne Olhoff (UNEP DTU Partnership), Lene Thorsted (UNEP DTU Partnership)
Media support
Shereen Zorba (United Nations Environment Programme), Mette Annelie Rasmussen (UNEP DTU Partnership), Tamiza Khalid (United Nations Environment Programme), Kelvin Memia (United Nations Environment Programme), Waiganjo Njoroge (United Nations Environment Programme), Surabhi Goswami (UNEP DTU Partnership)
Gap model calculations
Jørgen Fenhann (UNEP DTU Partnership)
Emission scenario calculations
Joeri Rogelj (ETH Zurich / International Institute for Applied Systems Analysis)
Copy editing
Bart Ullstein
Design, layout and printing
Audrey Ringler (United Nations Environment Programme), Lene Søjberg (Phoenix Design Aid), UNON Publishing Services (ISO 14001:2004 certified)
iv
Acknowledgments . . . . ii
Glossary . . . . v
Acronyms . . . . viii
Foreword . . . . x
Executive Summary . . . .xiii
Chapter 1: Introduction . . . 1
Chapter 2: What emission levels will comply with temperature limits? . . . 3
2.1 Current global emission levels . . . 3
2.2 Business-as-usual emission levels . . . 5
2.3 Global emission levels linked with global warming limits . . . 6
Chapter 3: Emissions pledges and the emissions gap . . . .21
3.1 How big will the emissions gap be in 2020 and 2030? . . . .21
3.2 Progress towards pledges: a closer look at major economies . . . .27
3.3 Summing up . . . .31
Chapter 4: Improving energy efficiency and reaping development and climate benefits . . . .33
4.1 Climate mitigation in a development context . . . .33
4.2 Spotlight: energy efficiency has benefits for all . . . .37
References . . . . 49
v
The entries in this glossary are adapted from definitions provided by authoritative sources, such as theIntergovernmental Panel on Climate Change.
Additionality: A criterion sometimes applied to projects aimed at reducing greenhouse gas emissions. It stipulates that the emission reductions accomplished by the project must not have happened anyway had the project not taken place.
Aerosols: Airborne solid or liquid particles, with a typical size of between 0.01 and 10 micrometer (a millionth of a meter) that reside in the atmosphere for at least several hours. They may influence the climate directly through scattering and absorbing radiation, and indirectly by modifying the optical properties and lifetime of clouds.
Annex I parties/countries: The group of countries listed in Annex I to the United Nations Framework Convention on Climate Change. Under Articles 4.2 (a) and 4.2 (b) of the convention, Annex I Parties were committed to adopting national policies and measures with the non-legally binding aim to return their greenhouse gas emissions to 1990 levels by 2000. By default, the other countries are referred to as Non-Annex I Parties.
Biomass plus carbon capture and storage (BioCCS or BECCS): Use of energy produced from biomass where the combustion gases are then captured and stored underground or used, for example, in industrial processes. It excludes gases generated through, for example, a fermentation process (as opposed to combustion).
Biomass: The total mass of living organisms in a given area or volume, including products, by-products, and waste of biological origin (plants or animal matter) and excluding material embedded in geological formations and transformed to fossil fuels or peat.
Black carbon: The substance formed through the incomplete combustion of fossil fuels, biofuels, and biomass, which is emitted in both anthropogenic and naturally occurring soot. It consists of pure carbon in several linked forms. Black carbon warms the Earth by absorbing heat in the atmosphere and by reducing albedo – the ability to reflect sunlight – when deposited on snow and ice.
Bottom-up model: In the context of this assessment, a model that represents a system by looking at
its detailed underlying parts. Compared to so-called top-down models, which focus on economic inter-linkages, bottom-up models of energy use and emissions can provide greater resolution with regards to sectors or mitigation technologies.
Business-as-usual: A scenario that describes future greenhouse gas emission levels in the absence of additional mitigation efforts and policies (with respect to an agreed set).
Carbon dioxide emissions budget: For a given temperature rise limit, for example a 1.5 or 2 °C long-term limit, the corresponding carbon budget reflects the total amount of carbon emissions that can be emitted to stay within that limit. Stated differently, a carbon budget is the area under a greenhouse gas emissions trajectory that satisfies assumptions about limits on cumulative emissions estimated to avoid a certain level of global mean surface temperature rise.
vi
Carbon credits: An entitlement allocated by a government to a legal entity (company or other type of emitter) to emit a specified amount of a substance. These entitlements, which may be transferrable and tradable, can be used to reduce emissions of greenhouse gases (by giving them a monetary value) or can be used for accounting of emissions.
Carbon dioxide equivalent: A way to place emissions of various radiative forcing agents on a common footing by accounting for their effect on climate. It describes, for a given mixture and amount of greenhouse gases, the amount of carbon dioxide that would have the same global warming ability, when measured over a specified time period. For the purpose of this report, greenhouse gas emissions (unless otherwise specified) are the sum of the basket of greenhouse gases listed in Annex A to the Kyoto Protocol, expressed as carbon dioxide equivalents assuming a 100-year global warming potential.
Carbon leakage: Phenomenon whereby the reduction in emissions (relative to a baseline) in a jurisdiction or sector associated with the implementation of mitigation policy is offset to some degree by an increase outside of that jurisdiction or sector which can be causally linked to the aforementioned reduction.
Conditional pledges: Greenhouse gas emissions reduction pledges made by some countries that are
contingent on the ability of national legislatures to enact the necessary laws, ambitious action from other countries, realization of finance and technical support, or other factors.
Double counting: In the context of this assessment, double counting refers to a situation in which the same emission reductions are counted towards meeting two countries’ pledges.
Emission pathway: The trajectory of annual global greenhouse gas emissions over time.
Global warming potential: An index, based on the radiative properties of greenhouse gases, measuring the radiative forcing following a pulse emission of a unit mass of a given greenhouse gas in the present-day atmosphere integrated over a chosen time horizon, relative to that of carbon dioxide. The global warming potential represents the combined effect of the differing times these gases remain in the atmosphere and their relative effectiveness in causing radiative forcing.
Greenhouse gases covered by the Kyoto Protocol: The six greenhouse gases listed in Annex A to the
Kyoto Protocol: carbon dioxide (CO2); methane (CH4); nitrous oxide (N2O); hydrofluorocarbons (HFCs);
perfluorocarbons (PFCs); and sulphur hexafluoride (SF6)1.
Integrated assessment models: Models that seek to combine knowledge from multiple disciplines in
the form of equations and/or algorithms in order to explore complex environmental problems. As such, they describe the full chain of climate change, from production of greenhouse gases to atmospheric responses. This necessarily includes relevant links and feedbacks between socio-economic and bio-physical processes.
International cooperative initiatives: Initiatives outside of the United Nations Framework Convention on Climate Change aimed at reducing emissions of climate forcers by, for example, promoting actions that are less greenhouse gas intensive, compared to prevailing alternatives. Cooperative initiatives also involve national and sub-national partners (they are often referred to as, simply, ‘cooperative initiatives’). Kyoto Protocol: A protocol to the United Nations Framework Convention on Climate Change that contains legally binding commitments, in addition to those included in the UNFCCC. Countries included in Annex B of the Protocol (most Organisation for Economic Cooperation and Development countries and countries with economies in transition) agreed to reduce their anthropogenic greenhouse gas emissions (carbon dioxide, methane, nitrous oxide, hydrofluorocarbons, perfluorocarbons, and sulphur hexafluoride) by at least five per cent below 1990 levels in the commitment period 2008–2012.
____________________
1 Nitrogen trifluoride (NF
vii
Later-action scenarios: Climate change mitigation scenarios in which emission levels in the near term,typically up to 2020 or 2030, are higher than those in the corresponding least-cost scenarios.
Least-cost scenarios: Climate change mitigation scenarios assuming that emission reductions start
immediately after the model base year, typically 2010, and are distributed optimally over time, such that aggregate costs of reaching the climate target are minimized.
Lenient rules: Pledge cases with maximum Annex I land use, land-use change and forestry (LULUCF)
credits and surplus emissions units, and maximum impact of double counting.
Likely chance: A likelihood greater than 66 per cent. Used in this assessment to convey the probabilities of meeting temperature limits.
Medium chance: A likelihood of 50–66 per cent. Used in this report to convey the probabilities of meeting temperature limits.
Montreal Protocol: The Montreal Protocol on Substances that Deplete the Ozone Layer is an international treaty that was designed to reduce the production and consumption of ozone-depleting substances in order to reduce their abundance in the atmosphere, and thereby protect the Earth’s ozone layer.
Non-Annex I countries/parties: See Annex I countries/parties.
Pledges: For the purpose of this assessment, pledges include Annex I targets and non-Annex I actions, as included in Appendix I and Appendix II to the Copenhagen Accord, and subsequently revised and updated in some instances.
Radiative forcing: Change in the net, downward minus upward, irradiance, expressed in watt per square
meter (W/m2), at the tropopause due to a change in an external driver of climate change, such as, for
example, a change in the concentration of carbon dioxide or the output of the Sun. For the purposes of this assessment, radiative forcing is further defined as the change relative to the year 1750 and, unless otherwise noted, refers to a global and annual average value.
Scenario: A description of how the future may unfold based on if-then propositions. Scenarios typically include an initial socio-economic situation and a description of the key driving forces and future changes in emissions, temperature or other climate change-related variables.
Strict rules: Pledge cases in which the impact of land use, land-use change and forestry (LULUCF) credits and surplus emissions units are set to zero.
Top-down model: A model that applies macroeconomic theory, econometric and/or optimisation
techniques to aggregate economic variables. Using historical data on consumption, prices, incomes, and factor costs, top-down models assess demand and emissions for goods and services from main sectors, such as energy conversion, transportation, buildings, agriculture and industry.
Transient climate response: Measure of the temperature rise that occurs at the time of a doubling of carbon dioxide concentration in the atmosphere.
Transient climate response to cumulative carbon emissions: Measure of temperature rise per unit of
cumulative carbon emissions.
Unconditional pledges: Pledges made by countries without conditions attached.
20th–80th percentile range: Results that fall within the 20–80 per cent range of the frequency distribution
viii
AR5 fifth Assessment Report of the Intergovernmental Panel on Climate Change
BaU business-as-usual
BC black carbon
BECCS bio-energy with carbon capture and storage
CCS carbon capture and storage
CDM Clean Development Mechanism
CER certified emission reduction
CFC chlorofluorocarbon
CO2e carbon dioxide equivalent
COP Conference of the Parties to the United Nations Framework Convention on Climate Change
EDGAR Emissions Database for Global Atmospheric Research
ERU emission reduction unit
EU-ETS European Union Emissions Trading System
FF&I fossil fuels and industry
GDP gross domestic product
GEA Global Energy Assessment
GHG greenhouse gas
Gt gigatonne
GWP global warming potential
HCFC hydrochlorofluorocarbon
HFC hydrofluorocarbon
IAM integrated assessment model
ICI international cooperative initiative
ix
IEA International Energy Agency
IPCC Intergovernmental Panel on Climate Change
LED Light-emitting diode
LULUCF Land use, Land-Use Change and Forestry
NAMA Nationally Appropriate Mitigation Action
NGO non-governmental organisation
OC organic carbon
ODS ozone-depleting substances
OECD Organisation for Economic Cooperation and Development
PAM policies and measures
REDD+ reduced emissions from deforestation and forest degradation
SE4ALL Sustainable Energy for All
SO2 sulphur dioxide
SOC soil organic carbon
TCR transient climate response
TCRE transient climate response to cumulative carbon emissions
UNEP United Nations Environment Programme
UNFCCC United Nations Framework Convention on Climate Change
x
F
oreword
The Fifth Assessment Report by the Intergovernmental Panel on Climate Change, released earlier this year, is a sobering reminder that climate change is unequivocal, that it is essentially driven by human activity, and that it represents one of the biggest challenges of our time. The risks of inaction are too high to be ignored, and the effects of global warming can already be felt in many aspects of human life. Further to the Copenhagen Accord of 2009 and the Cancun agreements of 2010, over 90 countries have made voluntary pledges and commitments toward cutting their emission levels. However, despite these and related efforts, current pledges and commitments are not sufficient to keep the average rise in global temperature below 2° Celsius, compared to pre-industrial levels: the associated “gap” in required emission reductions is growing, not closing.
Over the past four years the “emissions gap” series published by the United Nations Environment Programme has analysed the size of the gap and has provided insights on options to close it. This fifth report provides an updated measure of the emissions gap. In addition, this year’s update of
xi
the analysis calculates an emissions gap relative to expected emission levels in 2030, in recognition of the growing focus that action beyond 2020 is gaining in international climate change negotiations. Not least, the report provides an assessment of the carbon budget that is consistent with the 2° Celsius temperature target.
Consistent with the findings of the 2014 assessment by the Intergovernmental Panel on Climate Change, our analysis reveals a worrisome worsening trend. Continued emissions of greenhouse gases will lead to an even warmer climate and exacerbate the devastating effects of climate change. Failure to curb climate change does not only undermine prosperity for millions of people, most acutely in the developing world: it threatens to roll back decades of development and to hamper the capacity of countries to achieve key societal goals, such as poverty reduction or economic growth.
Against this background, this report explores the multiple benefits of tried and tested development
policies – benefits in terms of, for example, employment creation, economic growth, improved environmental quality and, not least, reduced greenhouse gas emissions. Unlike previous editions of the report, this year’s update does not focus on a specific sector. Instead, we illustrate the multiple benefits of one greenhouse gas mitigation option – energy efficiency improvements – across a wide range of sectors. Our findings show that multiple benefits, including climate change mitigation, can indeed be achieved by implementing fundamentally simple and well-known development policies.
The conclusions of the report are a stark reminder that, to meet the goals of the United Nations Framework Convention on Climate Change, consistent and decisive action is required without any further delay. I hope that the analysis presented in this fifth “emissions gap” report will help parties to the climate change convention negotiate positions that result in increased action. Everyone will gain if the outcome will enable more ambitious actions by more actors – sooner rather than later.
Achim Steiner
xii
xiii
The world is moving towards a crucial new climateagreement in 2015, which could provide the long-needed global plan to slow down climate change and enable humanity to adapt to the unavoidable part of a changing climate. While recognizing that some climate change is unavoidable, global
leaders at the 2010 Cancun Climate Conference1
agreed to limit global warming to 2 °C in this century, relative to the pre-industrial period. They also decided to review this limit to see if it should be further lowered to 1.5 °C.
Given the aim to limit global temperature, the critical question has now become what level of global emissions would make this possible? The United Nations Environment Programme (UNEP) has tackled this question since 2010 by convening a large group of knowledgeable scientists to
prepare the Emissions Gap reports. These reports
have examined the gap in 2020 between emission levels consistent with the 2 °C limit, and levels expected if country pledges/commitments are met. In earlier reports the scientists conveyed the message that indeed a large gap exists, but also that there were many promising opportunities for bridging the gap.
e
xecutive
s
ummAry
1 . What is the focus of this year’s report? The focus of this year’s update is on the emissions budget for staying within the 2°C limit .
This fifth Emissions Gap report has a different focus
from previous years. While it updates the 2020 emissions gap analysis, it gives particular attention to the implications of the global carbon dioxide emissions budget for staying within the 2 °C limit beyond 2020. It does so because countries are giving increasing attention to where they need to be in 2025, 2030 and beyond. Furthermore, this year’s update of the report benefits from the findings on the emissions budget from the latest series of Intergovernmental Panel on Climate
Change (IPCC) reports2.
As noted by the IPCC, scientists have determined that an increase in global temperature is proportional to the build-up of long-lasting greenhouse gases in the atmosphere, especially carbon dioxide. Based on this finding, they have estimated the maximum amount of carbon dioxide that could be emitted over time to the atmosphere and still stay within the 2 °C limit. This is called the carbon dioxide emissions budget because, if the world stays within this budget, it should be possible to stay within the 2 °C global warming limit. In the hypothetical case that carbon dioxide was the only human-made greenhouse gas, the IPCC estimated a total carbon dioxide budget
____________________
1 The 16th Conference of Parties of the United Nations Framework Convention on Climate Change.
2 Another reason for changing the report’s focus is that previous reports have concentrated on findings from least-cost scenarios that begin in 2010 or earlier.
However, these scenarios have become decreasingly useful because emissions in recent years have been consistently higher than, and thus not in line with, these scenarios. Second, it will be increasingly difficult to implement new large-scale emission control measures by 2020. Hence, looking beyond 2020 becomes even more important. Third, the move towards sustainable development goals will directly or indirectly influence climate targets, with countries likely to settle on 2025 and 2030 as the target year for these goals.
xiv
of about 3 670 gigatonnes of carbon dioxide
(Gt CO2) for a likely chance of staying within the 2
°C limit3. Since emissions began rapidly growing
in the late 19th century, the world has already
emitted around 1 900 Gt CO2 and so has used
up a large part of this budget. Moreover, human activities also result in emissions of a variety of other substances that have an impact on global warming and these substances also reduce the
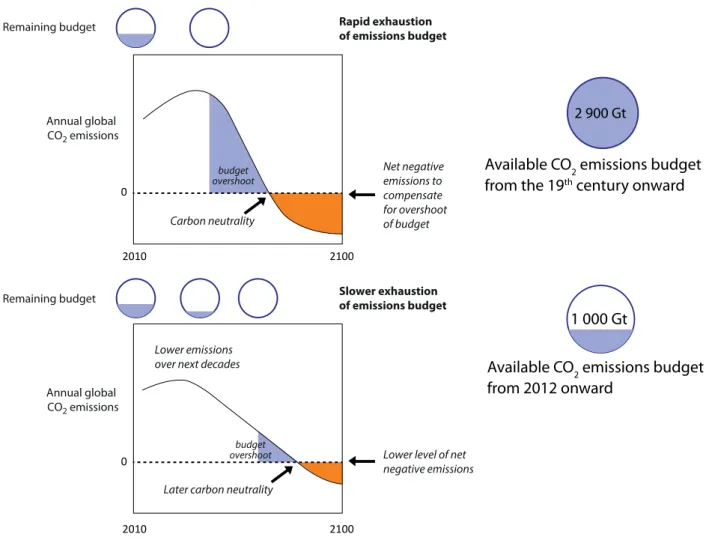
total available budget to about 2 900 Gt CO2. This
leaves less than about 1 000 Gt CO2 to “spend” in
the future4. The key questions are: how can these
emissions best be spread out over time; at what
point in time should net carbon dioxide emissions fall to zero – that is, when should we become budget neutral in the sense that we sequester as much as we emit; and how much can we spend of the budget at different points in the future and still stay within the temperature limit? To tackle
these questions this year’s Emissions Gap report
analyses the scenarios published in the latest IPCC reports. It also examines the great potential for improving energy efficiency, which would not only reduce greenhouse gas emissions but also meet many other societal goals. Key findings from these analyses are presented in the following sections.
____________________
3 A likely chance denotes a greater than 66 per cent chance, as specified by the IPCC.
4 The Working Group III contribution to the IPCC AR5 reports that scenarios in its category which is consistent with limiting warming to below 2 °C have carbon
dioxide budgets between 2011 and 2100 of about 630-1 180 Gt CO2. See main text.
2010 2100
2010 0
0
2100 Remaining budget
Remaining budget Slower exhaustionof emissions budget
Rapid exhaustion of emissions budget
Annual global CO2 emissions
Annual global CO2 emissions
Carbon neutrality
Lower emissions over next decades
budget overshoot
budget overshoot
Later carbon neutrality
Net negative emissions to compensate for overshoot of budget
Lower level of net negative emissions
Available CO2 emissions budget
from the 19th century onward
Available CO2 emissions budget
from 2012 onward
2 900 Gt
1 000 Gt
xv
2 . What does the budget approach say aboutemission levels and their timing to meet the 2 °C limit?
To stay within the 2 °C limit, global carbon neutrality will need to be achieved sometime between 2055 and 2070 .
Using the carbon budget approach and information from integrated assessment models it is possible to estimate when or if global carbon
neutrality will need to be reached during the 21st
century in order to have a likely chance of staying within the 2 °C limit.
Here global carbon neutrality means that annual
anthropogenic carbon dioxide emissions5 are net
zero on the global scale (Figure ES.1). Net zero implies
that some remaining carbon dioxide emissions could be compensated by the same amount of carbon dioxide uptake (negative emissions) so long as the net input of carbon dioxide to the atmosphere due to human activities is zero.
The fact that global emissions will continue to be larger than zero in the immediate future means that at some point we will exhaust the carbon
dioxide emissions budget and annualnet emissions
will have to drop to zero to avoid exceeding the budget. If we do exceed the budget, then negative emissions will be required to stay within the 2 °C limit (Figure ES.1).
Based on a subset of scenarios from the IPCC Fifth
Assessment Report (AR5) scenario database6, the best
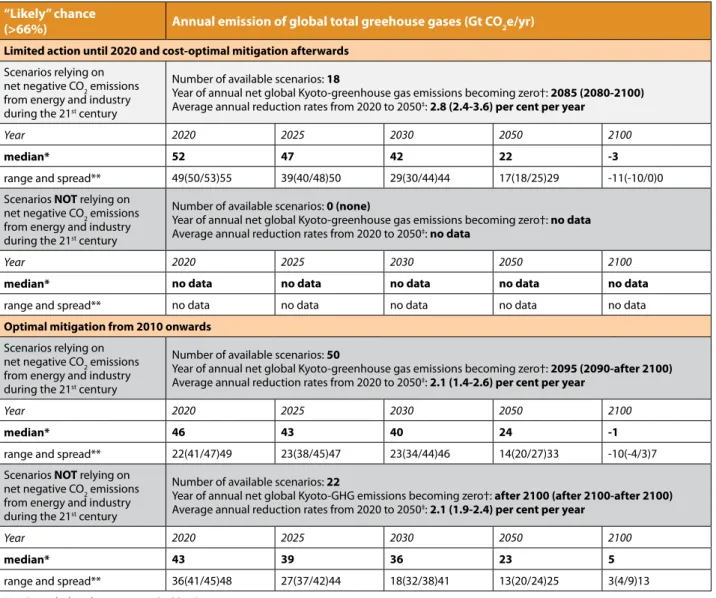
estimate is that global carbon neutrality is reached between 2055 and 2070 in order to have a likely chance of staying within the 2 °C limit. This same subset of scenarios is used throughout this Summary for calculating emissions consistent with the 2 °C limit, with the exception of the calculation of the 2020 gap, as explained in Section 5 of the Summary. To stay within the 2 °C limit, total global greenhouse gas emissions need to shrink to net zero some time between 2080 and 2100 . An important point about carbon neutrality is that it only refers to carbon dioxide emissions. Nonetheless, it is well known that other greenhouse gases also cause global temperature increases. Among these are methane, nitrous oxide and hydrofluorocarbons. Current and likely future emissions of these and other non-carbon dioxide greenhouse gases have been taken into account in the above estimation of when carbon neutrality should be reached. The next question is, when
must total greenhouse gas emissions (carbon
dioxide plus non-carbon dioxide)7 reach net zero
in order to stay within the emissions budget? Based on additional assumptions about
non-carbon dioxide emissions8, it has been estimated
that global total greenhouse gas emissions will need to reach net zero sometime between
____________________
5 In this Summary emissions always refer to anthropogenic emissions.
6 This subset (called Least-cost 2020 scenarios in this report) consists of scenarios that begin in 2010, have a likely chance of staying within the 2 °C limit, have modest
emission reductions up to 2020, assume country pledges are fully implemented in 2020, and follow least-cost emission pathways leading to rapid reductions after 2020. Modest here means that the pace of emission reductions up to 2020 is significantly slower than in scenarios that have a likely chance of staying within the 2 °C limit and follow a least-cost emission pathway beginning in 2010. A least-cost emission pathway is an emissions pathway that takes advantage of lowest cost options for emission reductions and minimizes total costs of reduction up to 2100. These scenarios are often called delayed action or later action scenarios because they begin their least-cost pathway in 2020 rather than 2010.
This subset of scenarios is used for three main reasons. First, because actual emissions since 2010 have been higher than in other types of scenarios in the IPCC scenarios database, particularly those that meet the 2 oC target and have a least-cost pathway beginning in 2010 rather than 2020. (These are called Least-cost 2010
scenarios in this report. These scenarios have lower global emissions up to 2020 than the Least-cost 2020 scenarios because they follow a least-cost pathway from 2010 rather than 2020.) Second, because the Least-cost 2020 scenarios seem to be more in accord with current projections of emissions for 2020. Global emissions in 2020 under various pledge cases are estimated to be about 52–54 Gt CO2e. The Least-cost 2020 scenarios used here have global emissions close to this range
(50–53 Gt CO2e). The Least-cost 2010 scenarios have much lower global emissions in 2020 (41–47 Gt CO2e). Third, the Least-cost 2020 scenarios are consistent with negotiations to deliver a new climate agreement, which provides a framework for higher ambition beginning in 2020. (Current negotiations aim to “further raise the existing level of ... action and stated ambition to bring greenhouse gas emissions down.”) For these reasons, the Least-cost 2020 scenarios are used for calculating emissions consistent with the 2 °C limit, with the exception of the 2020 gap, as explained in Section 5 of the Summary.
7 Total greenhouse gas emissions here and elsewhere in the report refer to the sum of the six greenhouse gases covered by the Kyoto Protocol (carbon dioxide,
methane, nitrous oxide, hydrofluorocarbons, perfluorinated compounds and sulphur hexaflouride).
8 Since most scenarios assume that it will be difficult to remove 100 per cent of non-carbon dioxide emissions (for example, all of methane from agriculture) the
scenarios assume that these residual emissions will be compensated for by net negative carbon dioxide emissions after total net zero greenhouse gas emissions are achieved. Under these circumstances, it is logical that first carbon neutrality is reached, and then net zero total greenhouse gas emissions.
xvi
2080 and 2100. Although this is somewhat later than the timing for carbon neutrality it does not assume slower reductions of non-carbon dioxide emissions. On the contrary, non-carbon dioxide and carbon dioxide emissions are assumed to be
reduced with about the same level of effort9.
The estimates here are again based on a subset of scenarios that have a likely chance of staying within
the 2 °C limit10. As in the case of carbon neutrality,
the net part of net zero emissions means that any global residual emissions from society could be compensated by enough uptake of carbon dioxide and other greenhouse gases from the atmosphere (negative emissions) to make sure that the net input of total greenhouse gases to the atmosphere is zero.
Bringing global emissions down to below the pledge range in 2020 allows us to postpone the timing of carbon neutrality and net zero total emissions .
An important consequence of the carbon budget is that the lower the annual emissions in the immediate future, including in the years up to 2020, the relatively higher they can be later, and
the longer the time we have before exhausting the emissions budget. This would allow us to push back the timing of carbon neutrality and net-zero total emissions. Hence taking more action now reduces the need for taking more extreme action later to stay within the 2 °C limit.
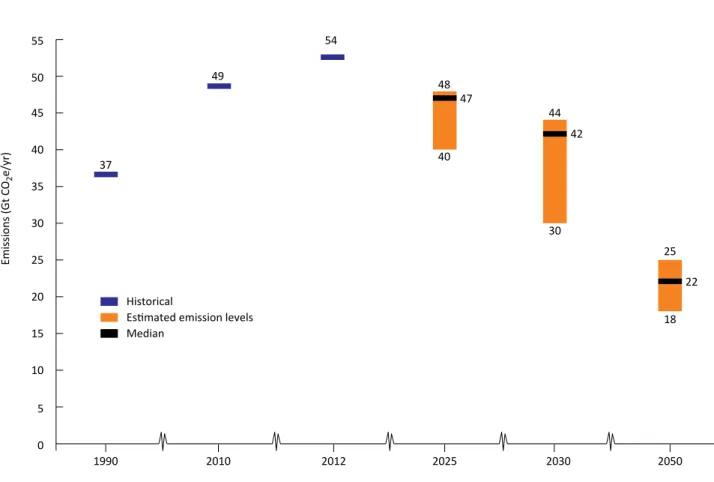
Following the budget approach, the levels of annual global emissions consistent with the 2 °C limit have been estimated. Under these circumstances, global emissions in 2050 are around 55 per cent below 2010 levels . By 2030 global emissions have already turned the corner and are more than 10 per cent below 2010 levels after earlier peaking .
Countries took the important decision at the
Durban Climate Conference11 to pursue a new
climate agreement, expected to enter into effect in 2020. This raises the crucial question about which global emission levels after 2020 are consistent with staying within the 2 °C limit. The estimates in the following table (Table ES.1) were made with
this question in mind12.
These estimates are based on the same subset of scenarios from the IPCC AR5 database as used
____________________
9 “About the same level of effort” means that both non-carbon dioxide and carbon dioxide emissions are assumed to be reduced in the scenarios if they have similar
costs (per carbon-equivalent) of reduction. The reason for the later timing of net zero total greenhouse gas emissions is explained in Footnote 8.
10 The same scenarios described in Footnote 6.
11 The 17th Conference of the Parties of the United Nations Framework Convention on Climate Change.
12 Emission levels in this table are higher than those reported in the Emissions Gap report 2013. The reason is that the 2013 report used scenarios that assumed
least-cost emission pathways (with stringent reductions of global emissions) beginning in 2010. Hence, emission levels in that report for the time frame up to 2050 were lower than in this report. It is worth noting, that because the scenarios used in this report have higher emissions over the next few years, they also assume that a much higher level of negative emissions will be needed to compensate for them later in the 21st century (see Section 3 of the Summary).
Year Median
(Gt CO2e) Relative to 1990 emissions Relative to 2010 emissions (Gt CORange 2e) Relative to 1990 emissions Relative to 2010 emissions 2025 47 +27% -4% 40 to 48 +8 to +30% - 2 to -18% 2030 42 +14% -14% 30 to 44 -19 to +19% -10 to -39% 2050 22 -40% -55% 18 to 25 -32 to -51% - 49 to -63% Notes: Since current emissions are 54 Gt CO2e and rising (see Section 4 of the Summary), substantial emission reductions will be needed to reach these levels.
Table ES .1: Required greenhouse gas emission levels (Gt CO2e) for a likely chance of staying within the 2 °C limit
xvii
1990 2010 2012 2025 2030 2050
55 50 45 40
37
49
54
48 47
42
22 40
44
30
25
18 35
30 25 20 15 10 5 0
Emissions (Gt CO
2
e/yr)
Historical
Estimated emission levels Median
____________________
13 These are the scenarios described in Footnote 6. 14 These are the scenarios described in Footnote 6.
Figure ES .2: Emission levels consistent with the 2 °C target above. They have a likely chance of staying within
the 2 °C limit, assume pledge implementation in 2020, and then follow a least-cost emissions
pathway after 202013.
3 . What are the consequences of delayed action?
The consequences of postponing stringent emission reductions will be additional costs and higher risks to society .
The current pathway of global emissions is consistent with scenarios that assume only modest emission reductions up to 2020 and then stringent
mitigation thereafter14. By postponing rigorous
action until 2020, this pathway will save on costs of mitigation in the near term. But it will bring much higher costs and risks later on, such as:
i: much higher rates of global emission reductions in the medium term;
ii: greater lock-in of carbon-intensive infrastructure; iii: greater dependence on using all available
mitigation technologies in the medium-term; iv: greater costs of mitigation in the medium-
and long-term, and greater risks of economic disruption;
v: greater reliance on negative emissions; and vi: greater risks of failing to meet the 2 °C target,
which would lead to substantially higher adaptation challenges and costs.
xviii
Delaying stringent action till 2030 will further aggravate these risks and reduce the likelihood of meeting the 2 °C target to 50 per cent or less. Conversely, putting greater effort into reducing emissions over the next few years would reduce all of these risks and would bring many co-benefits along with climate mitigation (see Section 7 of the Summary).
The higher the emissions level in the near term, the higher the level of negative emissions needed later in the century as compensation . Although scenarios routinely assume a substantial amount of global negative emissions, the feasibility of these assumptions still needs to be explored .
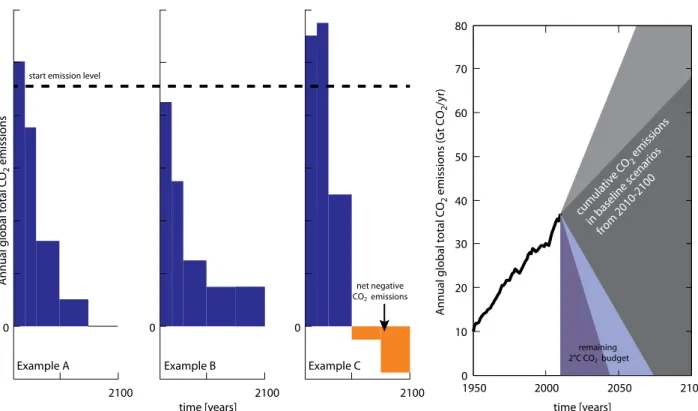
Another consequence of the current pathway of emissions (see Section 2 of the Summary) is that it implies that net negative emissions are needed to stay within the 2 °C limit, to compensate for higher emissions in 2020 and following decades. Theoretically, carbon uptake or net negative emissions could be achieved by extensive reforestation and forest growth, or by schemes that combine bioenergy use with carbon capture
and storage15. But the feasibility of such large-scale
schemes is still uncertain. Even though they seem feasible on a small scale, the question remains as to how much they can be scaled up without having unacceptable social, economic or environmental consequences. As noted above, the quicker emissions are reduced now, the less society will be dependent on negative emissions later.
4 . Where are we headed under business-as-usual conditions?
Although it is clear from the science that emissions soon need to peak to stay within the 2 °C target16, global greenhouse gas emissions continue to rise . Without additional climate
policies global emissions will increase hugely up to at least 2050 .
Since 1990, global emissions have grown by more than 45 per cent and were approximately
54 Gt CO2e in 2012. Looking to the future, scientists
have produced business-as-usual scenarios as benchmarks to see what emission levels would be like in the absence of additional climate policies, also assuming country pledges would not be implemented. Under these scenarios, global greenhouse gas emissions would rise to about 59
Gt CO2e in 2020, 68 Gt CO2e in 2030 and 87 Gt CO2e
in 2050. It is clear that global emissions are not expected to peak unless additional emission reduction policies are introduced.
5 . What about the 2020 emissions gap?
The 2020 gap is not becoming smaller . Country pledges and commitments for 2020 result in only a moderate reduction in global emissions below business-as-usual levels .
As an update of previous Emissions Gap reports,
we have again estimated the expected level of global greenhouse gas emissions in 2020 under five pledge cases, which cover a range of variants for complying with country pledges and commitments. The range of median estimates
is 52–54 Gt CO2e, about the same as in the 2013
report. It is 6–12 per cent above 2010 emissions of
49 Gt CO2e and about 7–12 per cent lower than the
business-as-usual level in 2020.
The 2020 emissions gap has been updated in this report. The gap in 2020 is defined as the difference between global emission levels consistent with the 2 °C target and the emission levels expected if country pledge cases are implemented. Global emissions in 2020 should not be higher than 44
Gt CO2e to have a likely chance of staying within
____________________
15 Here and elsewhere in this Summary we refer to net negative emissions, meaning that on a global level, the sum of negative emissions exceeds any residual positive
emissions to the atmosphere. Also, these are anthropogenic negative emissions and would have to be additional to any natural uptake of greenhouse gases by the biosphere or oceans.
16 About 85 per cent of scenarios in the IPCC scenario database with a likely chance of staying within the 2 °C limit have peak global greenhouse gas emissions in 2020
xix
the 2 °C target17. However, the range of expected
global emissions (median estimates) from the
pledge cases is 52–54 Gt CO2e in 2020, as noted
above. The gap in 2020 is therefore 8–10 Gt CO2e
(52 minus 44 and 54 minus 44). This is of the same magnitude as given in the 2013 report.
For continuity, we base these estimates on the
same kind of scenarios used in previous reports18.
But these scenarios were computed some years ago and assume that a least-cost pathway with stringent emission reductions begins in 2010, whereas actual global emissions in recent years have been consistently higher. Hence, the 2020 gap estimate is becoming increasingly uncertain.
Previous Emissions Gap reports pointed out that
the potential exists to reduce emissions and narrow the gap in 2020, although this is becoming increasingly difficult as we get closer to that year. Nevertheless, the lower the emissions between now and 2020, the lower the risks caused by delaying emission reductions, as noted above. Without further action current pledges will not be met by a number of countries and global emissions could be above the top end of the pledge range .
Above we saw that the current implementation level of pledges is not adequate for bridging the 2020 emissions gap, but it does slow down the growth in emissions. A further important question is whether countries are on track to realize the pledges.
After reviewing available evidence from the G20 (with the EU 28 taken as a group) it appears that five parties to the United Nations Framework Convention on Climate Change – Brazil, China, the EU28, India and the Russian Federation – are
on track to meet their pledges. Four parties – Australia, Canada, Mexico and the USA – are likely to require further action and/or purchased offsets to meet their pledges, according to government and independent estimates of projected national emissions in 2020. Conclusions are not drawn for Japan, the Republic of Korea, Indonesia and South Africa because of various uncertainties, nor for Argentina, Turkey and Saudi Arabia because they have not proposed pledges.
On the global scale, this report estimates that
emissions will rise to 55 (rounded from 54.5) Gt CO2e
in 2020 if countries do not go beyond their current climate policies. This is above the top of the pledge
range of 54 Gt CO2e (rounded median estimate).
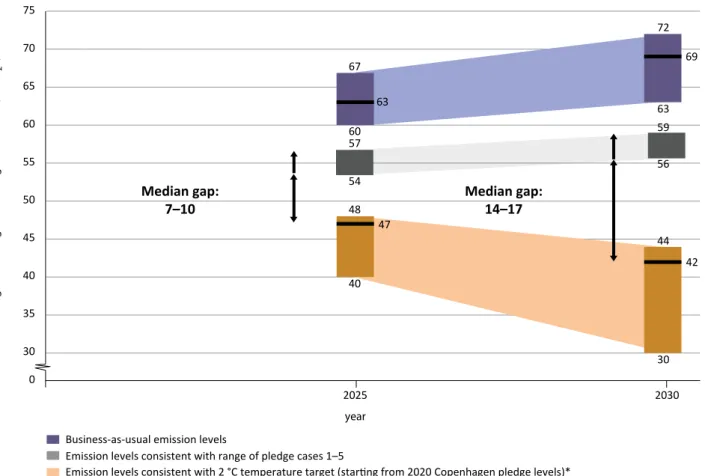
6 . What about the emissions gap in 2030? The emissions gap in 2030 is estimated to be about 14–17 Gt CO2e but can be closed if the available global emissions reduction potential is exploited .
As countries discuss the contours of a new climate agreement for the period after 2020, the question arises whether an emissions gap will occur in 2030. The gap in 2030 is defined as the difference between global emission levels consistent with the 2 °C target versus the emissions levels expected if the pledge cases are extrapolated to 2030.
This report estimates that global emissions in 2030 consistent with having a likely chance of staying
within the 2 °C target are about 42 Gt CO2e19.
As for expected emissions in 2030, the range
of the pledge cases in 2020 (52–54 Gt CO2e)
was extrapolated to give median estimates of
56–59 Gt CO2e in 2030.
____________________
17 This estimate is based on the subset of emission scenarios from the IPCC AR5 database (called Least-cost 2010 scenarios in this report). These are the same type of
scenarios used in previous Emissions Gap reports to compute the 2020 emissions gap. These scenarios begin in 2010, have a likely chance of staying within the 2 °C limit, and follow a least-cost emissions pathway with stringent reductions (exceeding current pledges and commitments) after 2010. Least-cost emission pathway is defined in Footnote 6.
18 See Footnote 17.
19 This estimate is based on the subset of emission scenarios from the IPCC AR5 database described in Footnote 6. A different subset of scenarios was used for
xx
Figure ES .3: The emissions gap in 2030
Box S .1: The IPCC AR5 Synthesis Report*
The findings in this report are consistent with those of the IPCC AR5 Synthesis Report, but not identical.
Global emission reductions by 2050. The IPCC Synthesis report states: “scenarios that are likely to maintain warming at below 2 oC are characterized by a 40–70 per cent reduction in greenhouse gas emissions by 2050, relative to
2010 levels”. The numbers in this report (49–63 per cent) are consistent with the IPCC estimate.
Timing of carbon neutrality. The IPCC Synthesis Report does not make an explicit statement about the timing of carbon neutrality. However, it can be inferred from Figure SPM.5a in the IPCC report that carbon neutrality is reached in the second half of the 21st century in scenarios of the IPCC’s lowest scenario category, in line with a likely chance of limiting warming to below 2 °C. This is consistent with estimates here that carbon neutrality is reached between 2055 and 2070 (for scenarios that begin a least-cost pathway in 2020, as described in Footnote 6.)
Timing of net zero global greenhouse gas emissions. The IPCC Synthesis report states: “scenarios that are likely to maintain warming at below 2 oC are characterized by ... emissions level[s] near zero or below in 2100”. In this
report it is estimated that global greenhouse gas emissions would reach net zero between 2080 and 2100, also based on scenarios that are likely to maintain warming at below 2 oC, but that specifically begin a least-cost
pathway in 2020 (Footnote 6).
* The Synthesis Report is available online at: http://www.ipcc.ch/pdf/assessment-report/ar5/syr/SYR_AR5_LONGERREPORT.pdf Median gap:
7–10
30 35 40 45 50 55 60 65 70 75
year
2025 2030
0
30 44
42 48
47
40
72 67
60 63
69
63 59 56 57
54
Median gap: 14–17
* Copenhagen Pledges in these scenarios were assumed to result in a range of 52 (50–53) Gt CO2e total greenhouse gas emissions by 2020. This is lower than the current pledge assessment for 2020.
Emission levels consistent with range of pledge cases 1–5
Emission levels consistent with 2 °C temperature target (starting from 2020 Copenhagen pledge levels)* Results for the business-as-usual emission levels and emission levels consistent with 2 °C temperature targets are expressed as median, 20 and 80 percentiles
Business-as-usual emission levels
Annual global total greenhouse gas emissions (Gt CO
2
e)
xxi
The emissions gap in 2030 is therefore estimatedto be 14–17 Gt CO2e (56 minus 42 and 59 minus
42). This is equivalent to about a third of current global greenhouse emissions (or 26–32 per cent of 2012 emission levels).
As a reference point, the gap in 2030 relative to business-as-usual emissions in that year
(68 Gt CO2e) is 26 Gt CO2e. The good news is that
the potential to reduce global emissions relative to
the baseline is estimated to be 29 Gt CO2e, that is,
larger than this gap. This means that it is feasible to close the 2030 gap and stay within the 2 °C limit. 7 . How can climate change mitigation be linked with actions to promote sustainable development?
There is a strong case for integrating climate change mitigation in a policy framework that can deliver economic growth, social development and climate and environmental protection .
Actions to mitigate climate change often have close synergies with policies that countries need for achieving domestic goals of improved energy access and energy security, or reduction in air pollution. The Sustainable Development Goals presented in the report of the Open Working
Group20 underscore the many synergies between
development goals and climate change mitigation goals. For example, efforts to eradicate energy poverty, promote universal access to cleaner forms of energy, and double energy efficiency, if fully realised, would go a long way towards bringing the world back to a path consistent with the temperature target set by the United Nations Framework Convention on Climate Change. Linking development with climate mitigation also helps countries build energy efficient and low-emissions infrastructure for the coming decades, and achieve deep transformational changes in the economy and society worldwide.
Policies and measures are being applied worldwide that promote both sustainable development and reduce greenhouse gas emissions .
The good news is that countries and other actors are already widely applying policies that are very beneficial to both sustainable development and climate mitigation. About half the countries in the world have national policies for promoting more efficient use of energy in buildings, such as heating and/or cooling. About half are working on raising the efficiency of appliances and lighting. Other national policies and measures are promoting electricity generation with renewable energy, reducing transport demand and shifting transport modes, reducing process-related emissions from industry, and advancing sustainable agriculture. Significant public and private investments are flowing into energy efficiency (US$ 310–360 billion in 2012) and renewable energy (US$ 244 billion in the same year).
Non-state actors such as regions, cities and companies are also promoting policies that advance both sustainable development and emission reductions. Some of these non-state actors have come together (in some cases with governments) to form international cooperative initiatives (ICIs) for pursuing specific sustainable development, energy, environmental and climate mitigation objectives. These ICIs have the potential to significantly reduce greenhouse gas emissions in support of, and potentially beyond, national emission reduction pledges. The interest and importance of these initiatives is increasing and a plethora of new such initiatives were proposed at the UN Secretary General’s Climate Summit in New
York in September 201421.
____________________
20 The report is available online at: http://sustainabledevelopment.un.org/focussdgs.html 21 Further details are available online at: http://sustainabledevelopment.un.org/index.html
xxii
If climate mitigation actions already taking place were to be replicated and scaled up, they would provide a huge potential to reduce greenhouse gas emissions .
Experience shows that countries can make rapid progress in climate mitigation when they integrate climate policy into their core development strategy, lay out a long-term strategic vision, and build wide-ranging political support for those changes. Scaling up the many feasible actions that reduce emissions and promote sustainable development yields a large potential for reducing global emissions. In 2030 this potential adds up
to no less than 29 Gt CO2e. As a reference point,
this is equivalent to nearly 60 per cent of global emissions in 2010.
New polices and measures based on proven approaches can provide the necessary incentives to achieve the full potential of climate mitigation and the associated short-term development benefits .
New government policies are needed to overcome barriers and create the right incentives for climate mitigation. One approach is to adjust fuel prices, through carbon taxes or emissions trading systems, so that they incorporate the costs of climate change and other environmental damages. Another is to reduce or abolish subsidies on fossil fuels, estimated to be more than US$ 600 billion annually, and thereby avoid this huge annual governmental expenditure. To make investments in low-carbon and resource-efficient assets attractive, risks need to be reduced, the general investment climate improved, financing costs lowered and government budget support made available. New policies are needed to promote the diffusion of innovative technologies in order to overcome the risk aversion of potential users, and other obstacles. But the transition to a low-carbon future may create losers in some companies and
segments of the population. The impact of new policies on these groups needs to be considered and enterprises and society need to be given time to adjust to the new paradigm.
8 . How can energy efficiency help to promote development while contributing to emission reductions?
Energy efficiency has multiple social, economic and environmental benefits .
Past Emissions Gap reports have focused on good
practices in different sectors and their ability to stimulate economic activity and development, while reducing emissions. Following this tradition, this report focuses on the vast potential to improve energy efficiency across many different sectors. Globally the energy intensity between 2002 and 2012 was estimated to have improved on average
by 1.6 per cent annually22. Improvements in
energy efficiency in 18 Organisation of Economic Co-operation and Development (OECD) countries over the period 2001–2011 have resulted in cumulative energy savings of 1 731 million tonnes of oil equivalent (Mtoe) – more than the equivalent of the total energy demand of the EU in 2011. As a result, energy efficiency is increasingly called the ‘first fuel’.
Improving energy efficiency comes with substantial multiple benefits. Not only does it reduce or avoid greenhouse emissions, but it has long been considered a main way to increase productivity and sustainability, primarily through the delivery of energy savings. Moreover, energy efficiency measures can contribute to economic growth and social development by increasing economic output, employment and energy security. In a scenario with carbon prices of US$ 70 per tonne, for example, improvements in energy efficiency are estimated to result in a
____________________
22 Energy intensity and energy efficiency are not exactly equivalent since energy intensity is a function of both the economic structure and energy efficiency of an
economy. However, as is often the case, if the economic structure does not change significantly over time, then the changes in energy intensity can be used as a proxy for changes in energy efficiency.
xxiii
0.2–0.5 per cent increase in gross domestic product(GDP) in 2030, relative to a baseline level23.
Improving energy efficiency also has important positive social impacts. It reduces, for example, air pollution and its public health risks: nearly 100 000 premature deaths related to air pollution in six regions – Brazil, China, the EU, India, Mexico and the USA – could be avoided annually by 2030 through energy efficiency measures in the transport, buildings and industrial sectors. In many cases these benefits have a higher priority for governments than climate change mitigation. Hence improving energy efficiency can be seen as an excellent opportunity for linking sustainable development with climate mitigation.
Improving energy efficiency has a high potential for reducing global emissions, and in a very cost effective way .
Between 2015 and 2030, energy efficiency improvements worldwide could avoid
22–24 Gt CO2e (or 2.5–3.3 Gt CO2e annually in 2030)
relative to a baseline scenario and assuming a carbon price of US$ 70 per tonne. This corresponds to a reduction in primary energy demand of about 5–7 per cent over the same 15-year period and relative to the same baseline scenario. Improvements in energy efficiency represent about one-fifth of all cost-effective emission reduction measures
over the same 15-year period24. Depending on the
assumptions, estimates are higher. For example, the International Energy Agency reports that end-use
fuel and electricity efficiency could save 6.8 Gt CO2e
in 2030, and power generation efficiency and fossil
fuel switching could save 0.3 Gt CO2e, also in 2030.
An assessment by the German Aerospace Centre
estimates that 13 Gt CO2e could be saved in 2030
through energy efficiency improvements alone.
Many energy efficiency measures can be implemented with negative or very low long-term
costs due to reduced energy bills that offset the sometimes higher upfront costs, compared to less efficient technologies, not even considering positive economic effects and multiple societal benefits. There are great opportunities for improving the energy efficiency of heating, cooling, appliances and lighting in the buildings sector . There is tremendous potential for improving energy efficiency in the buildings sector. Because of advances in materials and know-how, new energy efficient buildings use 60–90 per cent less energy than conventional buildings of a similar type and configuration, and are cost-effective in all countries and climate zones.
As compared to developed countries, the rate of new building construction in developing countries is much higher, which means that energy efficiency in buildings can best be achieved through regulations for building energy performance or codes for new construction. Several developing countries, and virtually all OECD countries, have some form of building code in place. Because they have an older building stock with a low rate of turnover, most developed countries also need to pay special attention to renovating their existing buildings in an energy efficient manner.
The provision of heating, cooling and hot water is estimated to account for roughly half the global energy consumption in buildings. Some cities are providing both thermal and electrical energy to buildings in a very efficient manner through district energy systems. Although these systems have been used mostly in cooler climates in the northern hemisphere, they are also becoming a popular way to cool buildings efficiently, for example in Dubai, Kuwait and Singapore.
Appliances and lighting also account for a significant amount of energy use in buildings, and
____________________
23 These improvements correspond to a reduction in primary energy demand of nearly 10 per cent and a reduction in final energy consumption of 6–8 per cent,
compared with a baseline scenario in 2030.
24 These emission reduction estimates relate to abatement costs that would be economically efficient to incur in the period to 2030 (on average, worldwide) if carbon