Measuring
child poverty
New league tables of child poverty
in the world’s rich countries
Which countries
are included?
Data on child deprivation rates are drawn from the 2009 round of the European Union Statistics on Income and Living Conditions and are therefore available for 29 countries, i.e. all 27 countries of the European Union plus Norway and Iceland. Most of these (23 out of 29) are also members of the Organisation for Economic Co-operation and Development (OECD). The exceptions are Bulgaria, Cyprus, Latvia, Lithuania, Malta and Romania, which are EU member states, but not members of the OECD. Data on relative child poverty rates are also available for six additional OECD countries (Australia, Canada, Japan, New Zealand, Switzerland, and the United States). The analysis of relative child poverty therefore includes the following 35 countries:
Australia, Austria, Belgium, Bulgaria, Canada, Cyprus, Czech Republic, Denmark, Estonia, Finland, France, Germany, Greece, Hungary, Iceland, Ireland, Italy, Japan, Latvia, Lithuania, Luxembourg, Malta, the Netherlands, New Zealand, Norway, Poland, Portugal, Romania, Slovakia, Slovenia, Spain, Sweden, Switzerland, United Kingdom, United States.
Two background papers from the UNICEF Innocenti Research Centre support this Report:
1. Bradshaw, J., Y. Chzhen, C. de Neubourg, G. Main, B. Martorano and L. Menchini (2012), ‘Relative Income Poverty among Children in Rich Countries’, Innocenti Working Paper 2012-01, UNICEF Innocenti Research Centre, Florence.
www.unicef-irc.org/publications/pdf/iwp_2012_01.pdf
2. de Neubourg, C., J. Bradshaw, Y. Chzhen, G. Main, B. Martorano and L. Menchini (2012), ‘Child Deprivation, Multidimensional Poverty and Monetary Poverty in Europe’, Innocenti Working Paper 2012-02, UNICEF Innocenti Research Centre, Florence.
www.unicef-irc.org/publications/pdf/iwp_2012_02.pdf
The UNICEF Innocenti Research Centre would like to acknowledge the generous support for Report Card 10 provided by the Andorran, Belgian, Swiss and United Kingdom National Committees for UNICEF. Any part of this Innocenti Report Card may be freely reproduced using the following reference:
UNICEF Innocenti Research Centre (2012), ‘Measuring Child Poverty: New league tables of child poverty in the world’s rich countries’, Innocenti Report Card 10, UNICEF Innocenti Research Centre, Florence.
The Report Card series is designed to monitor and compare the performance of economically advanced countries in securing the rights of their children.
The Innocenti Research Centre (IRC) was established in Florence, Italy in 1988 to strengthen the research capability of the United Nations Children’s Fund (UNICEF) and to support its advocacy for children worldwide. IRC is the dedicated research hub of the UNICEF Office of Research (OOR), which provides global leadership for the organization’s strategic research agenda around children. The Office aims to set out a comprehensive framework for research and knowledge within the organization, in support of its global programmes and policies. Through strengthening research partnerships with leading academic institutions and development networks in both the North and South, the Office seeks to leverage additional resources and influence in support of efforts towards policy reform in favour of children.
The Centre's publications are contributions to a global debate on child rights and help facilitate full implementation of the Convention on the Rights of the Child in low-, middle- and high-income countries. The views expressed are those of the authors and researchers and do not necessarily reflect the policies or views of UNICEF.
© United Nations Children’s Fund (UNICEF), May 2012 ISBN: 978-88-8912-965-4
ISSN: 1605-7317
UNICEF Innocenti Research Centre Piazza SS. Annunziata, 12
50122 Florence, Italy Tel: (+39) 055 2033 0 Fax: (+39) 055 2033 220 [email protected] www.unicef-irc.org
This report sets out the latest internationally comparable data on
child deprivation and relative child poverty. Taken together, these
two different measures offer the best currently available picture
of child poverty across the world’s wealthiest nations.
Previous reports in this series have shown that failure to
protect children from poverty is one of the most costly mistakes
a society can make. The heaviest cost of all is borne by the
children themselves. But their nations must also pay a very
significant price – in reduced skills and productivity, in lower
levels of health and educational achievement, in increased
likelihood of unemployment and welfare dependence, in the
higher costs of judicial and social protection systems, and in
the loss of social cohesion.
The economic argument, in anything but the shortest term, is
therefore heavily on the side of protecting children from poverty.
Even more important is the argument in principle. Because
children have only one opportunity to develop normally in mind
and body, the commitment to protection from poverty must be
upheld in good times and in bad. A society that fails to maintain
that commitment, even in difficult economic times, is a society
that is failing its most vulnerable citizens and storing up
intractable social and economic problems for the years
immediately ahead.
It is for these reasons that this comparative snapshot of child
poverty in the industrialized nations is presented for the
attention of political leaders, press and public.
UNICEF
Romania Bulgaria Hungary Latvia Portugal Poland Lithuania Slovakia Greece Italy Estonia France Belgium Malta Germany Czech Republic Austria Slovenia Spain Cyprus United Kingdom Ireland Luxembourg Netherlands Denmark Finland Norway Sweden Iceland
72.6 56.6 31.9 31.8 27.4 20.9 19.8 19.2 17.2 13.3 12.4 10.1 9.1 8.9 8.8 8.8 8.7 8.3 8.1 7.0 5.5 4.9 4.4 2.7 2.6 2.5 1.9 1.3 0.9
Child deprivation
(% of children lacking two or more items)
0 10 20 30
New league tables of child poverty
in the world’s rich countries
T W O V I E W S O F C H I L D P O V E R T Y
Fig. 1a A league table of child deprivation, 29 economically advanced countries
Figure 1a shows the percentage of children (aged 1 to 16) who lack two or more of the following 14 items because the households in which they live cannot afford to provide them.
1. Three meals a day
2. At least one meal a day with meat, chicken or fish (or a vegetarian equivalent)
3. Fresh fruit and vegetables every day 4. Books suitable for the child’s age and
knowledge level (not including schoolbooks)
5. Outdoor leisure equipment (bicycle, roller-skates, etc.)
6. Regular leisure activities (swimming, playing an instrument, participating in youth organizations etc.)
7. Indoor games (at least one per child, including educational baby toys, building blocks, board games, computer games etc.)
8. Money to participate in school trips and events
9. A quiet place with enough room and light to do homework 10. An Internet connection 11. Some new clothes (i.e. not all
second-hand)
12. Two pairs of properly fitting shoes (including at least one pair of all-weather shoes)
13. The opportunity, from time to time, to invite friends home to play and eat 14. The opportunity to celebrate special
occasions such as birthdays, name days, religious events, etc.
Note: Data refer to children aged 1 to 16. Source: Calculations based on EU-SILC 2009.
The data are drawn from the 2009 round of the European Union Statistics on Income and Living Conditions (EU-SILC) and are not available for non-European countries of the Organisation for Economic Co-operation and Development (OECD).
Romania USA Latvia Bulgaria Spain Greece Italy Lithuania Japan Portugal Poland Canada Luxembourg United Kingdom Estonia New Zealand Slovakia Australia Hungary Belgium Malta France Germany Ireland Switzerland Czech Republic Austria Sweden Denmark Slovenia Norway Netherlands Cyprus Finland Iceland 4.7
5.3 6.1 6.1 6.1 6.3 6.5 7.3 7.3 7.4 8.1 8.4 8.5 8.8 8.9 10.2 10.3 10.9 11.2 11.7 11.9 12.1 12.3 13.3 14.5 14.7 14.9 15.4 15.9 16.0 17.1 17.8 18.8 23.1 25.5
0 10 20 30 40
Child poverty rate
(% of children living in households with equivalent income lower than 50% of national median)
Some OECD countries – Australia, Canada, Japan, New Zealand, Switzerland and the United States – are included in the league table of relative child poverty (Figure 1b) but could not be included in the league table of child deprivation (Figure 1a) because relevant data are not available. Child deprivation data are drawn from the European Union Statistics on Income and Living Conditions and are therefore only available for the 27 EU countries plus Iceland and Norway.
Introduction
The league tables on these pages present the latest available data on child poverty across the world’s rich nations. Figure 1a, made available here for the first time, shows the proportion of
children in each country who are deprived – i.e. ‘lacking two or more’ of 14 items considered normal and necessary for a child in an economically advanced country (see opposite for the full list).
Figure 1b shows the percentage of children living in relative poverty, defined as living in a household whose income, when adjusted for family size and composition, is less than 50% of the median income for the country in which they live.
Fig. 1b A league table of relative child poverty, 35 economically advanced countries
Figure 1b shows the percentage of children (aged 0 to 17) who are living in relative poverty, defined as living in a household in which disposable income, when adjusted for family size and composition, is less than 50% of the national median income.
Note: Data refer to children aged 0 to 17.
Sources: Calculations based on EU-SILC 2009, HILDA 2009, SLID 2009, SHP 2009, PSID 2007. Results for New Zealand are from Perry (2011). Results for Japan are from Cabinet Office, Gender Equality Bureau (2011).
As may be seen at a glance, the two league tables project two very different pictures of child poverty in the world’s rich nations. What these different pictures mean – the relationship between them and the controversies surrounding them – is the subject of this Report Card.
Slipping down the agenda
In the wake of statistics following the post-2008 economic crises, the child poverty rate has rarely surfaced.
“In a downturn,” says Sharon Goldfeld,
National Director of the Australian Early Development Index, “the first
thing that happens is that children drop off the policy agenda.” Yet it is arguable that
the child poverty rate is one of the most important of all indicators of a society’s health and well-being. For the here and now, it is a measure of what is happening to some of society’s most vulnerable members. For the years to come, it is a pointer to the well-being and cohesion of society as a whole. Previous reports in this series have presented the evidence for the close association between child poverty and a long list of individual and social risks – from impaired cognitive development to increased behavioural difficulties, from poorer physical health to underachievement in school, from lowered skills and aspirations to higher risks of welfare dependency, from the
greater likelihood of teenage
pregnancy to the increased probability of drug and alcohol abuse. That there are many exceptions – many children who grow up in economically poor families who do not fall into any of these categories – does not alter the fact that poverty in childhood is closely and consistently associated with measurable disadvantage both for individuals and for the societies in which they live.i
A commitment to protecting children from poverty is therefore more than a slogan or a routine inclusion in a political manifesto; it is the hallmark of a civilized society.
Box 1
Children and recession
There are almost no internationally comparable data on what is happening to child poverty as a result of the economic downturn of the last three years.
It is nonetheless evident that front-line services for families are everywhere under strain as austerity measures increase the numbers in need while depleting the services available. It is also clear that the worst is yet to come. Many families, even those on low incomes, have some form of ‘cushion’ – whether in the form of savings, assets, or help from other family members – by which to maintain spending during difficult times. There is therefore almost always a time lag between the onset of an economic crisis and the full extent of its impact.
Commitment
In Ireland, a leader in both the theory and practice of monitoring child poverty, some data are available to estimate the effects on children and families of a severe contraction in the national economy. Between 2009 and 2010, for example, Ireland’s own child deprivation index showed a rise of almost 7 percentage points, from 23.5% to 30.2%.1 Over the same period, falling median incomes meant that relative child poverty rose by less than one percentage point – again showing the value of using the two different measures
discussed in this report.
The possible impact of the economic downturn on efforts to reduce child poverty rates has also recently been estimated for the United Kingdom, where the Child Poverty Act of 2010 has set legally binding targets for reducing child poverty. By 2020, the relative child poverty rate is to be halved to no more than 10%. (‘Absolute income poverty‘ – defined as living on an income below 60% of the median income for the benchmark year 2010 and updated only for inflation – is to be cut from 20% to 5%.)
But as the Act came into force, the economic crisis was already beginning to threaten social protection programmes. Child benefits, for example, have been frozen for three years – meaning that in real terms they will fall in value. Child tax credits and other programmes designed to protect the poorest children have been cut back.
What difference are such changes likely to make to the UK’s long-term efforts to bring down child poverty rates?
Reversal
According to an October 2011 report from the Institute for Fiscal Studies (IFS),2 the likeliest prospect is that the
progress of recent years will be thrown into reverse. Although currently thought to be stable, the child poverty rate is predicted to begin rising again in 2013.
* EU-SILC 2009: data on income refers to 2008, other data to 2009. Poverty data was released in early 2010.
A crisis of monitoring
In practice, making good on this commitment is impossible without close monitoring of what is happening to children’s lives. It is monitoring that makes possible evidence-based policy, political accountability, informed advocacy and the cost-effective use of limited public resources. The
availability of timely data is therefore in itself an indicator of whether the commitment to protecting children is being taken seriously or not.
The two league tables, Figures 1a and 1b, therefore reveal more than the percentages of children living in different kinds of poverty. They also
reveal a crisis of monitoring. In both cases the data they present, although the latest available, are mostly drawn from surveys conducted in 2009. They are therefore at least two to three years old.* This would be bad enough at the
best of times. But these are not the best of times. And it is a significant failing, on behalf of many governments of OECD countries, that the available data on children’s lives do not yet reflect the impact of the economic downturn (see Box 1: Children and recession). Underlying weak monitoring is the lack of any robust public or political consensus on how child poverty should be defined and measured.
“The discourse on poverty is very confusing,”
says Jonathan Bradshaw, Professor of Social Policy at the University of York and one of the authors of the statistical analysis on which this report draws:ii
“We tend to mix up concepts and measures
and use different words to describe the same thing and the same words to describe different things.”iii
Many of the questions and confusions about the measurement of child poverty are encompassed by the two league tables with which this report begins. It may therefore be helpful to summarize the principal differences between them.
Looking further ahead, levels of ‘relative’ and ‘absolute’ child poverty are expected to reach 24% and 23% respectively by 2020/21 – compared to the target figures of 10% and 5%. This would mean a return to the relative child poverty levels of two decades ago.
Such forecasts, says the IFS, are “always highly uncertain.” In particular, they cannot accurately predict the impact of, and responses to, the tax and benefit changes currently in the pipeline. They are nonetheless the best available independent estimate of “what might happen to poverty under current government policies.” Since these forecasts were made, the commitment to increase child credits by more than the rate of inflation in 2012 and 2013 has been abandoned. According to IFS calculations, this decision alone is likely to mean that another 100,000 children will fall below the relative poverty line.
1 Central Statistics Office Ireland, Government of Ireland, 2011. 2 Brewer, M., J. Browne and R. Joyce (2011). Child and Working-age
Poverty from 2010 to 2020, Institute for Fiscal Studies, London.
Source: Data from the Institute for Fiscal Studies, London, October 2011. The graph shows the percentage of children living in households below 60% of equivalized median income before housing costs. For illustrative purposes, the 'Target' line assumes linear progress towards the 2020 goal.
Relative child poverty rate, United Kingdom, 1998–2020
10 12 14 16 18 20 22 24 26 28
1998 2000 2002 2004 2006 2008 2010 2012 2014 2016 2018 2020
Predicted
Malta
($24,804)
Slovakia ($22,875)
Hungary ($20,275)
Estonia ($19,690)
Poland
($18,925)
Lithuania ($17,059)
Latvia
($16,166)
R
omania ($14,216) Bulgaria ($13,764
)
56.6 72.6
31.8
19.8 20.9 12.4
31.9
19.2 8.9
% Children deprived
0 10 20 30 40 50 60 70 80
(per capita GDP in parentheses)
27.4
8.8 8.3 17.2
7.0 8.1 13.3
10.1
5.5 2.5
Finland ($35,254)
United Kingdom
($35,145)
France
($33,349)
Italy
($32,413)
Spain
($32,262)
Cyprus ($30,728) Greece ($29,303) Slovenia ($27,556)
Czech R
epublic ($25,572) Portugal ($25,058)
% Children deprived
(per capita GDP in parentheses)
0 5 10 15 20 25 30
A deprivation index
Figure 1a, a League Table of Child Deprivation, represents a significant new development in the international monitoring of child poverty. For the first time, the European Union Statistics
on Income and Living Conditions,
sampling more than 125,000 households in 29 European countries, has included a section on the lives of children aged 1 to 16. Using this data, the UNICEF Innocenti Research Centre has constructed the 14-item
Child Deprivation Index on which
League Table 1a is based.
The 14 items in the index encompass the ability of households to afford:
1. Three meals a day
2. At least one meal a day with meat, chicken or fish (or a vegetarian equivalent)
3. Fresh fruit and vegetables every day
4. Books suitable for the child’s age and knowledge level (not including schoolbooks)
5. Outdoor leisure equipment (bicycle, roller-skates, etc.)
6. Regular leisure activities (swimming, playing an
instrument, participating in youth organizations etc.)
7. Indoor games (at least one per child, including educational baby toys, building blocks, board games, computer games etc.)
8. Money to participate in school trips and events
9. A quiet place with enough room and light to do homework
10. An Internet connection
11. Some new clothes (i.e. not all second-hand)
12. Two pairs of properly fitting shoes (including at least one pair of all-weather shoes)
13. The opportunity, from time to time, to invite friends home to play and eat
14. The opportunity to celebrate special occasions such as birthdays, name days, religious events etc.
Overall, the league table shows that approximately 85% of the almost 85 million children (aged 1 to 16) in 29 European countries have at least 13 of the 14 items in the deprivation index and are therefore ‘not deprived’. The second most obvious feature of the table is that the highest rates of deprivation are to be found in some of the newest and poorest member countries of the European Union. Over 30% are seen to be deprived in Hungary and Latvia, over 50% in Bulgaria and over 70% in Romania. For Central and Eastern European countries, therefore, the league table of child deprivation makes grim reading. Among the richest 15 countries, all except France and Italy have child deprivation rates below 10%. But clearing a bar that is set so low does not warrant any great applause. In the world’s wealthiest nations the proportion of children lacking two or more of these basic items should be at or close to zero. Yet in practice only Denmark, Finland, Iceland, the Netherlands, Norway and Sweden have
Fig. 2a Percentage of children deprived in countries with GDP per capita between $13,000 – $25,000 (PPP)
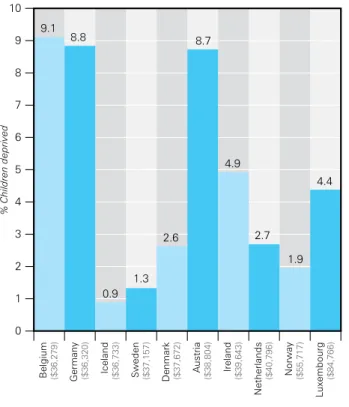
Fig. 2b Percentage of children deprived in countries with GDP per capita between $25,000 – $36,000 (PPP)
9.1 8.8 0.9 1.3 2.6 8.7 4.9 2.7 1.9 4.4 Luxembourg ($84,766) Norway ($55,717) Netherlands ($40,796) Ireland ($39,643) Austria ($38,804) Denmark ($37,672) Sweden ($37,157) Iceland ($36,733) Germany ($36,320) Belgium ($36,279) 0 1 2 3 4 5 6 7 8 9 10
% Children deprived
(per capita GDP in parentheses)
child deprivation rates below 3%. For Austria, Belgium and Germany, the rate climbs to 8% or more. In France and Italy the rate rises above the 10% mark.
More with less
Looked at as a whole, the child deprivation table may therefore seem to present little more than a blurred reflection of each country’s level of per capita income. But a closer look reveals that some countries are in fact achieving much more – and some much less – than their income levels would predict. Estonia, Hungary and Poland, for example, have roughly equivalent per capita incomes but widely varying rates of child deprivation (see Figure 2a). Portugal and the Czech Republic both have per capita incomes of about PPP $25,000, but Portugal’s child deprivation level is three times higher (see Figure 2b). Belgium and Germany have similar per capita incomes to Denmark and Sweden – but child deprivation rates that are about three and seven times higher (see Figure 2c).
Relative poverty league
The second of the two league tables (Figure 1b) paints a very different picture of child poverty in the world’s advanced economies.
It includes six OECD countries that do not participate in EU-SILC (Australia, Canada, Japan,
New Zealand, Switzerland and the United States), and is based on the definition of relative poverty used by the OECD. Under this definition, a child is deemed to be living in relative poverty if he or she is growing up in a household where disposable income, when adjusted for family size and composition, is less than 50% of the median disposable household income for the country concerned.* By this
standard, more than 15% of the 200 million children in the 35 countries listed in Figure 1b are seen to be living in relative poverty.
The top five positions in the league table are occupied by Iceland, Finland, Cyprus, the Netherlands and Norway (with Slovenia and Denmark close
behind). All of these countries have relative child poverty rates below 7%. Another eight countries including two of the largest – Germany and France – have rates between 7% and 10%. A third group, including Australia, Canada, New Zealand and the United Kingdom, post rates of between 10% and 15%. A further six, including populous Italy and Spain, show rates of between 15% and 20%. In only two countries are more than 20% of children living in relative poverty – Romania and the United States.
Overall, the divide between the wealthy and not-so-wealthy nations is much less clear-cut. Hungary, Slovakia and Estonia, for example, are seen to have a smaller proportion of children living in relative poverty than the United Kingdom, Italy, Spain, or the United States. Clearly, this is not because a smaller proportion of their children are poor in an absolute sense; it is because the incomes of most poor households in these former centrally-planned economies do not fall as far behind the median level of income for the nation as a whole.
Finally, it is worth noting that – despite the very different measures of child poverty employed in these two league tables – seven countries are ranked in the top 10 in both – Cyprus, Denmark, Finland, Iceland, the Netherlands, Norway and Sweden.
Controversy
What are we to make of these two very different pictures of child poverty in the world’s richest nations? First, it is important to resist the temptation to see the two different views presented in Figures 1a and 1b as contradictory or mutually exclusive. Both are valid. Both can inform policy. And both make it clear that some countries are doing a much better job than others at protecting their children from poverty.
Fig. 2c Percentage of children deprived in countries with GDP per capita between $36,000 – $85,000 (PPP)
Note: Data refer to children aged 1 to 16. Sources: Calculations based on EU-SILC 2009 for child deprivation and on World Development Indicators (2011) for GDP per capita, PPP (current international $).
* Most European Union countries draw the relative poverty line at 60% of national median income. For purposes of international comparison, the OECD (and this Report Card series) uses a relative poverty line drawn at 50% of median income.
The two measures are, however, profoundly different in concept. The most important difference between them is that the child deprivation table uses a fixed measure for all 29 countries surveyed; the criterion applied (lacking two or more from the same list of 14 items) is exactly the same for Sweden or the United States as it is for Bulgaria or Romania. Inevitably, therefore, it puts the emphasis on the differences between richer and poorer countries. The criterion used to measure relative child poverty, by contrast, changes with the median income of each country; it therefore transfers the emphasis to the gap between the bottom and the middle in the living standards of children within each country. It is because of this difference that the poorer countries in Figure 1a tend to have significantly higher rates of child deprivation but may or may not have higher rates of relative income poverty. For the same reason, the two different measures tend to respond to economic and policy changes in very different ways.iv In periods of sustained
economic growth, for example, the proportion of a nation’s children defined as ‘deprived’ will almost certainly fall as overall incomes rise. The proportion living in relative income poverty, on the other hand, may either rise or fall depending upon whether their household incomes grow by more or less than the median income for the nation concerned. To take a famous example, a decade of sustained economic growth in the Ireland of the 1990s more than doubled the nation’s median income, but the proportion of children living in relative poverty also rose because the incomes of households below the poverty line rose more slowly than the median income for the country as a whole.
Such examples bring us to the heart of one of the principal controversies surrounding the measurement of child poverty.
‘Real’ poverty
It is often argued that relative poverty isn’t ‘real poverty’. Real poverty, it is said, means lacking basics - enough food to eat, adequate clothing, a dry home, an indoor toilet, hot water, and a bed to sleep in. Once you leave such basics behind and start drawing poverty lines based on statistical notions like median income, it is argued, you end up with results that fail to make intuitive sense and so fail to convince either politicians or public. Can the child poverty rate really be said to be rising, for example, at a time when the incomes of the poor are also rising? And can there really be more children in poverty in the United Kingdom or the United States than in Hungary or Lithuania (as shown in Figure 1b)? Or are these findings just statistical artefacts produced by a definition of child poverty that is in effect based on a concern not with poverty but with inequality?
Such are the arguments that push many to reject the relative income measure and to embrace instead the direct measurement of deprivation. Does the child have three meals a day? A few books in the home? And a roof that doesn’t leak? Isn’t this a much more intuitive measure, and one that is more capable of winning public understanding and support? Direct measures of outcomes like deprivation do have advantages over indirect or ‘input’ measures such as household income (see Box 2: The problem with incomes). But the trouble with the argument that deprivation measures ‘real poverty’, whereas relative income does not, is that the intuitively appealing idea on which it rests is that poverty should be measured in an absolute rather than a relative sense. And from here it is but a short step to the belief that the deprivation index presented in Figure 1a is an absolute measure whereas the median income method used for Figure 1b is ‘only’ a relative measure.
This is a mistake. Both are relative measures.
The deprivation index is based on the kind of possessions, services and opportunities that most people would consider normal for a child growing up in a wealthy country today. In other words, it is relative to both time and place. Twenty years ago, for example, such a list would not have included an Internet connection. Go back a little further in time and ‘having at least one meal a day with meat, chicken or fish’ would not have been regarded as normal. In fact the longer the historical view the more obvious it becomes that poverty is an essentially relative concept. Any poverty line intended to represent a minimum acceptable standard of living in the industrialized world today implies higher standards of food, clothing, housing, water supply, sanitation, health care, education, transport and entertainment than were available to even the wealthiest households of previous eras. The whole idea of defining child poverty in an absolute sense therefore rests on shaky ground. Unless we wish to argue that the threshold should be set at the minimum income necessary for sheer physical survival then there can in fact be no such thing as an absolute poverty line.
The real debate, therefore, is not whether poverty lines should be absolute or relative, but how and how often they should be updated to reflect changes in the living standards of society as a whole. If the decision is taken, for example, to draw an ‘absolute’ poverty line at some fixed point and to update it only for inflation, then this means that a relative poverty line is being anchored to an arbitrary point in time. As the years pass and incomes rise, such a poverty line is likely to fall further and further behind the norm for the society and to become less and less useful. This is essentially what has happened over the
Box 2
The problem with incomes
Relative child poverty rates are usually estimated by assuming that household income is a reasonable guide to the material resources available to the child. But this assumption is beset by problems.1
Among the concerns:
σ
σ Data on incomes may not be reliable, especially if derived from surveys, or if a significant proportion of the working population is self-employed or employed in informal work. Under-reporting of earnings varies from country to country, and tends to be greater towards the bottom end of the income scale.
σ
σ Most countries measure household incomes before housing costs. In practice, a family’s capacity to meet children’s needs is more likely to be dependent on income after housing costs (which can vary significantly within as well as between countries).
σ
σ Income does not always reflect the real level of resources available. A family’s economic capacity, its security and spending power, are based not only on household income at a single point in time but also on savings and debts, on home ownership and house values, on previous earnings and future expectations, on the help that may be available from other family members, and perhaps on the value of home-produced goods such as food and clothes.
σ
σ When used to compare child poverty in different countries, income measures cannot take into account the fact that services such as health care and child care may be subsidised or free in some countries but not in others. This may make a substantial difference to real ‘disposable household income’.
σ
σ Similarly, whether or not education, and particularly pre-school education, is free or subsidised may make a substantial difference to disposable incomes. In most advanced economies, primary and secondary education is usually available free of charge. But early childhood education is subsidised to different degrees in different countries. The same is true of tertiary or college education, which may mean that parents in some countries must try to put aside significant sums even when their children are still young. Both of these factors affect real disposable incomes to different degrees in different countries.
σ
σ Income measures cannot reflect the fluctuations in
income experienced by many households (for example as a result of overtime, bonuses, working shorter hours, becoming unemployed, or taking retirement).
σ
σ Calculating a poverty rate from household income data requires that some method be used to convert household income into equivalent individual incomes (see Box 3: Do children have incomes?). To achieve this, an ‘equivalence scale’ must be used. But such scales are not based on any scientific understanding of the different patterns of need in households of different size.
σ
σ Household income measures cannot reflect the fact
that some families may be much more competent than others in managing income or in prioritizing spending (for example by putting children’s needs first). The child of a high-income household, for example, will not be counted as poor even if most of the income is spent on drugs, gambling or alcohol; conversely a child in a low-income household will be counted as poor even if the parents make enormous sacrifices to ensure that the child has the same advantages and opportunities as his or her peers. Some or all of these problems combine to introduce doubts about household incomes as a measure of the real resources available to the child. And they help to explain why surveys have sometimes found that measures of household spending do not correspond to measures of household incomes. At any given level of household income, for example, material living standards tend to vary substantially according to whether they are assessed by incomes or by
expenditures.2 In most advanced economies, household incomes are easier to monitor than expenditures. But expenditure measures would in most cases provide a more reliable guide to the real level of resources available to the household.
1 See for example, Fusco, A., A-C. Guio and E. Marlier (2010). ’Income Poverty and Deprivation in European Countries’, Eurostat Methodologies and Working Papers, European Commission, Luxembourg. 2 Bradshaw, J. and N. Finch (2003). ‘Overlaps in Dimensions of Poverty’.
Norway
Luxembourg
Denmark
Ireland
Iceland
Sweden
Finland
Netherlands
Austria
France
Belgium
Germany
Cyprus
United Kingdom
Italy
Spain
Slovenia
Greece
Malta
Portugal
Czech R
epublic
Estonia
Slovakia
Latvia
Poland
Lithuania
Hungary
Bulgaria
R
omania
0
15,000
110,000
115,000
120,000 125,000
130,000 135,000
140,000
last half century in the United States (see Box 10: The United States: redrawing the line).
The obvious alternative is to update national poverty lines in such a way as to track the norms and living standards of the society. But how often, and by what method? Should the line be updated irregularly in an ad hoc way, subject to political pressures and the competing influences of different interest groups? Or should it be updated in a regular and systematic way in order to preserve its relationship with contemporary living standards? In which case, setting the poverty line at a percentage of each nation’s median income and updating it every year might, after all, be a strong contender. This is why the Innocenti Report Card series, in common with both the European Union and the OECD, continues to use a child poverty line based on a percentage of median household income.
Why, then, is it necessary to complicate the picture by adding a second measure? Why introduce the Child Deprivation Index?
Relative weakness
The answer is that, for all its strengths, the relative income measure has two principal weaknesses.
First, even those who support the principle of measuring child poverty in a relative way would concede that household income may not always be a reliable proxy for the real resources available to the child (see Box 2: The problem with incomes). It is, at best, an indirect measure, leaving open the possibility that children may be deprived in households that are not income-poor and not deprived in households that are income-poor. Second, when comparing relative child poverty rates in different countries, a poverty line drawn at a
percentage of median income only works well if the countries being compared have broadly similar levels of income and living costs. Otherwise ‘relative poverty’ comes to mean very different living standards in different countries: a household with 50% of median income in Bulgaria has an actual income of 11,400 a year; a
household with 50% of median income in Norway has an income of 117,000 a year.
One may argue that this doesn’t really make any difference – that relative poverty means ‘relative to one’s own particular society’ and not to the norms of some other country. But this argument is only fully convincing for the wealthier countries of the OECD where living on an income below 50% of the median is a plausible measure of what it is intended to measure – the sense of falling so far behind the norms of one’s society as to be at risk of social exclusion
Fig. 3 Poverty lines and median incomes, European countries
Note: Income figures for non Euro-zone countries are converted using purchasing power parity (PPP) exchange rates. Sources: Elaboration of 2009 European Union Statistics on Income and Living Conditions data and Eurostat.
USA Spain Italy Japan Canada Luxembourg United Kingdom Australia Belgium France Germany Ireland Switzerland Austria Sweden Denmark Norway Netherlands Finland Iceland
23.1 17.1 15.9 14.9 13.3 12.3 12.1 10.9 10.2 8.8 8.5 8.4 8.1 7.3 7.3 6.5 6.1 6.1 5.3 4.7
0 5 10 15 20 25
Child poverty rate (% of children living in households with equivalent income lower than 50% of the national median)
(see Box 8: The public view). Life at 50% of median income in poorer countries like Bulgaria and Romania may not signify the same level of difference, or imply the same degree of social exclusion, as it does in Denmark or Norway. That said, it should also be noted that at very low levels of income even small differences can make a significant difference to opportunities and living standards. Since the enlargement of the European Union to 25 countries in 2004 and then to 27 countries in 2007, this problem of ‘the meaning of the median’ has become more pressing. Cross-national comparisons in the European Union must now span a group of countries whose annual per capita incomes range from less than
$14,000 to around $85,000. A relative income poverty line based on 50% of median incomes will inevitably struggle to reflect this new diversity. Figure 3 illustrates the problem. This shows, for example, that the 10 richest countries have poverty lines that are higher than the median incomes of the 10 poorest countries. This means that children who are below the relative poverty line in France or Germany may be significantly better off in actual living standards than children who are living at the median income level in Poland or Portugal.v Or to take
another example, a child living at the relative poverty line in the Netherlands has double the income of a child living at the median income level in a country like Hungary (Figure 3).
Finally there is the worry that comparing relative child poverty rates on the basis of household incomes cannot take into account significant differences between countries in the cost of living and especially in the costs of essential goods and services such as health and child care. An income of $30,000 in country A, where such services are free or heavily subsidized, may imply a very different standard of living from the same income in country B where such items must be paid for at market rates. In sum, a relative poverty line drawn at 50% of median income is an attempt to define a concept of poverty on which there is widespread agreement in principle – a concept which says that the poor are those who do not have access to the possessions, amenities, activities and opportunities that are considered normal by most people in the society in which they live (see Boxes 6, 8 and 9). But when using this yardstick to make comparisons between countries, it is probably better to restrict the comparison to those generally wealthier countries where living on incomes below 50% of median implies a similar level of risk of social exclusion. Figure 4, for example, restricts the comparison of relative child poverty rates to the 20 OECD countries with annual per capita incomes of more than $31,000.
Deprivation doubts
These concerns and problems have led to increasing pressure for the relative income measure to be supplemented by a more direct measure of child poverty. Within individual economically advanced countries, direct measures of child deprivation are sometimes available. They have been deployed, for example, in Finland, Germany, Greece, Ireland, the Netherlands, Sweden, and the United Kingdom.vi Internationally,
the Child Deprivation Index presented in Figure 1a is the first attempt to meet this need. As already noted, it is made
Note: Data refer to children aged 0 to 17.
Sources: Calculations based on EU-SILC 2009, HILDA 2009, SLID 2009, SHP 2009, PSID 2007. Results for Japan are from Cabinet Office, Gender Equality Bureau (2011).
Country poverty line at 50% poverty line at 40% poverty line at 60%
Iceland 4.7 1.9 10.1
Finland 5.3 1.5 11.9
Cyprus 6.1 1.8 12.1
Netherlands 6.1 2.9 15.4
Norway 6.1 3.1 11.3
Slovenia 6.3 2.9 11.1
Denmark 6.5 3.6 11.4
Sweden 7.3 3.7 12.7
Austria 7.3 3.2 13.6
Czech Republic 7.4 3.8 13.0
Switzerland 8.1 3.2 17.9
Ireland 8.4 3.5 18.9
Germany 8.5 4.6 14.9
France 8.8 3.7 16.8
Malta 8.9 2.9 20.3
Belgium 10.2 4.1 16.6
Hungary 10.3 3.0 20.6
Australia 10.9 4.3 17.6
Slovakia 11.2 6.6 17.0
New Zealand 11.7 19.4
Estonia 11.9 6.1 20.6
United Kingdom 12.1 5.6 20.8
Luxembourg 12.3 4.2 22.4
Canada 13.3 7.3 21.9
Poland 14.5 7.5 22.9
Portugal 14.7 9.6 22.7
Japan 14.9 9.6 20.5
Lithuania 15.4 8.8 24.3
Italy 15.9 9.7 24.2
Greece 16.0 8.1 23.5
Spain 17.1 11.5 23.6
Bulgaria 17.8 12.2 24.4
Latvia 18.8 12.8 25.0
USA 23.1 16.6 31.1
Romania 25.5 17.8 32.3
possible by the decision of the European Union to include a special section about children’s lives in the EU-SILC survey (see Box 7: The European Union: 2020 vision). At first glance, this alternative sounds quite straightforward: draw up a list of items that most people think of as necessary for a child and conduct a survey to find out what proportion of the child population of each country lacks each of the items.
In practice, this too has its problems. First, deprivation statistics gleaned from surveys may also be unreliable. What people consider to be necessary for their children, for example, may vary with income and aspiration. Presented with a list of items which corresponds to one’s own family possessions, it is likely that most items will be judged as ‘necessary’. A list that includes items that are not affordable, on the other hand, may attract fewer ticks in the ‘necessary’ box. The tendency for what is considered normal to increase with incomes, and to decrease with persistent poverty, has often been observed. And it is not difficult to see how this might affect the results of surveys about child deprivation. Parents in poor households may decide that certain items are unnecessary because they are embarrassed or ashamed to admit that they are unable to provide them.vii
The published survey results may have the appearance of objective data, but behind every statistic of child deprivation is an individual parent answering a survey question about whether or not they can afford to allow their child ‘to participate in school trips and events’, or ‘to invite friends home to play and eat’, or ‘to have a quiet place with enough room and light to do homework’.
Then there is the problem of what items should be included in a deprivation index and what
importance should be attached to each. How do we know that the list reflects a minimum acceptable standard of
living for a given group of countries at a given time? And who should decide? Should the items be chosen by experts? Or by opinion polls to find out which items are regarded as necessary by the population at large? Or should they be selected (and weighted) by investigating what percentage of the population already possesses the items? Giving no ‘weighting’ to the individual items is not a neutral approach – it is a judgement that all the items on the list are of equal importance and that this is true for all of the countries being compared.
Further, there is the problem of the different needs of different age groups. A personal computer, for example, was originally included in a list of necessities proposed by the European Union but subsequently dropped when it was shown that only 30% of the population considered a computer to be ‘absolutely necessary’ or ‘necessary’.viii If the poll had been
conducted among young people, as opposed to the population as a whole, it is reasonable to suppose that a much higher proportion would have categorized a computer as a necessity.
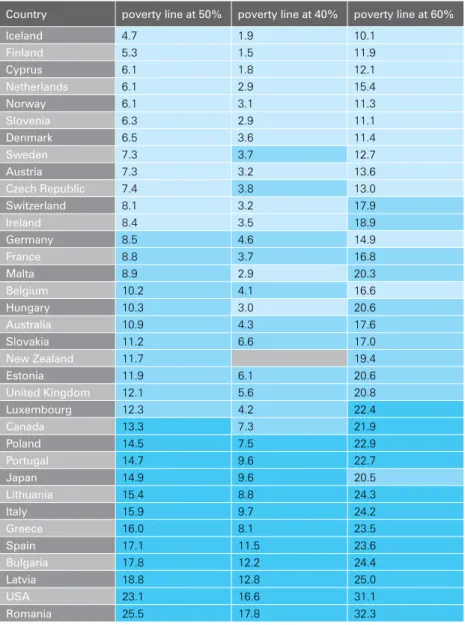
Fig. 5 Child poverty rates by different relative poverty lines
Note: The shading in the last three columns indicates whether a country ranks in the top third (light blue), middle third (mid-blue), or bottom third (dark blue) of the relevant league table.
Sources: Calculations based on EU-SILC 2009, HILDA 2009, SLID 2009, SHP 2009, PSID 2007. Results for New Zealand are from Perry (2011) and refer to 2010. Results for Japan are from Cabinet Office, Gender Equality Bureau (2011).
Country 2+ 3+ 4+ 5+
29 European countries 13.3 9.8 7.4 5.8
Austria 8.7 5.3 3.7 2.4
Belgium 9.1 6.6 4.7 3.1
Bulgaria 56.6 49.2 41.1 36.3
Cyprus 7.0 5.0 3.8 2.1
Czech Republic 8.8 6.1 4.7 3.1
Denmark 2.6 1.5 1.2 0.7
Estonia 12.4 7.7 4.5 3.3
Finland 2.5 0.6 0.2 0.0
France 10.1 6.5 3.9 2.6
Germany 8.8 6.2 3.9 2.8
Greece 17.2 11.7 8.4 6.1
Hungary 31.9 25.1 20.6 16.7
Iceland 0.9 0.3 0.0 0.0
Ireland 4.9 2.5 1.4 0.6
Italy 13.3 10.3 8.3 6.2
Latvia 31.8 25.2 20.7 15.9
Lithuania 19.8 13.8 11.6 10.4
Luxembourg 4.4 3.1 1.7 1.3
Malta 8.9 5.4 3.5 2.5
Netherlands 2.7 1.2 0.6 0.4
Norway 1.9 0.7 0.3 0.1
Poland 20.9 15.3 10.8 8.5
Portugal 27.4 23.0 17.8 13.8
Romania 72.6 62.0 53.8 46.8
Slovakia 19.2 15.2 12.1 10.3
Slovenia 8.3 4.4 2.6 1.5
Spain 8.1 5.3 3.2 2.1
Sweden 1.3 0.7 0.4 0.0
United Kingdom 5.5 2.8 1.7 1.3
Choosing a threshold
Finally, in this summary of the strengths and weaknesses of the different measures used in the two league tables of child poverty, it should be noted that there are problems common to both. First, both the child deprivation measure and the relative income measure must confront the question of where and how the threshold should be drawn.
In the case of relative income poverty, for example, should the line be drawn at 60% of median household income
(as in the European Union) or at 50% (as used by the OECD for purposes of international comparison)? By way of reassurance, Figure 5 shows that there is little change to the relative child poverty rankings when the line is drawn at different percentages of median income. (It should also be borne in mind that in practice there may be little difference between life just below and just above whichever poverty threshold is chosen.) In the case of the deprivation measure, should the threshold be set at ‘lacking two or more’ of the
14 items in the deprivation index? Or at ‘three or more’ or ‘four or more’? For the league table of child deprivation in this report (Figure 1a), the line is drawn at ‘lacking two or more’. But this decision is essentially opportunistic: drawing the line at ‘lacking one or more’ would have given arbitrary emphasis to just one item on the list. It would also have produced extremely high child deprivation rates for the poorest EU countries. Setting the line at ‘lacking three or more’, on the other hand, would have produced extremely low deprivation rates for the wealthier countries.
Secondly, both the deprivation measure and the relative income league table tell us what proportion of each nation’s children fall below the selected thresholds, but they tell us nothing about how far below.
In the case of the deprivation measure, the question of ‘how far below’ can in part be answered by setting a lower threshold for the Child Deprivation Index. Figure 6, for example, shows the proportion of children in each country who lack 2, 3, 4 and 5 or more of the 14 items.
In the case of the relative child poverty measure, the question ‘how far are those below the poverty line allowed to fall?’ finds an approximate answer in Figure 7 which compares 35 countries by the depth of their poverty gaps – the difference between the median income of households below the poverty line and the poverty line itself. The findings of this table will be considered under the heading Assessing
government performance (p.19).
Overlaps
Given the strengths and weaknesses of these two very different ways of measuring and comparing child poverty, there is an obvious
temptation to combine them in some way in order to construct a single overarching measure which would have the strengths of both and the
Note: Data refer to children aged 1 to 16. Source: Calculations based on EU-SILC 2009.
Fig. 6 Proportion of children in each country lacking 2, 3, 4 and 5 items or more on the deprivation index
USA Romania Spain Denmark Bulgaria Latvia Japan Portugal Italy Slovakia Lithuania Germany Canada Sweden Norway Greece Poland Czech Republic Estonia United Kingdom Netherlands Cyprus Belgium Slovenia Malta Switzerland Austria New Zealand France Luxembourg Australia Ireland Iceland Hungary Finland 10.9 11.8 12.8 12.9 13.6 14.6 15.0 16.0 16.1 16.2 16.3 17.6 17.8 17.9 18.4 18.8 20.3 20.6 20.6 20.7 21.0 21.1 21.4 22.3 23.5 27.1 29.8 29.9 31.1 31.3 32.0 32.8 33.1 34.7 37.5
Child poverty gap
(gap between the poverty line and the median income of those below the poverty line)
0 5 10 15 20 25 30 35 40
weaknesses of neither. It has been suggested, for example, that a single measure of child poverty might be constructed by counting as poor only those children who are poor under both definitions – i.e. those who lack two or more of the items on the deprivation index and who live in households where incomes are less than 50% of the national median. But this would be to ignore the
underlying incompatibility – the fact that the deprivation measure is based on a definition which does not vary across countries, whereas the relative income poverty measure is based on a definition which changes from nation to nation. To make the two measures conceptually compatible, it would be necessary to adjust the deprivation index so that both the list of items it contains and the threshold chosen would reflect a standard of living that is considered normal or necessary in
each individual country. This could be
done, either by surveys to establish what proportion of the population considers which items to be ‘necessary’ (consensus weighting) or by weighting each item according to what proportion of households in each country already own or have access to each item (prevalence weighting). But this procedure would raise more problems than it solves while at the same time jettisoning the simplicity and the intuitive appeal of the deprivation index.
When used for international comparison the two measures are therefore separate in concept and should remain so in practice. Both the child deprivation rate and the relative child poverty rate are useful to policymakers, to social scientists, to the media, and to advocates for child well-being. Combining them into a common measure would be like combining oil and water, in that the whole would be less useful than the sum of the parts.
Within individual countries, on the
other hand, it may be useful to combine the two measures by
focusing on the overlap between them – asking what percentage of a nation’s children are both deprived and living in relative income poverty. This approach, currently used for example in Austria, Ireland and the United Kingdom, helps to ease some of the worries surrounding the measurement of poverty by means of household incomes. As Professors Brian Nolan and Christopher Whelan, contributors to the development of Ireland’s official poverty measure, have written:
“Given two relevant pieces of information about the household – income and deprivation – each with limitations from both conceptual and measurement perspectives, incorporating both into the measurement process is one way to seek to improve reliability in identifying the poor.”ix
In practice, household income remains a principal determinant of whether or not the needs of children are
adequately met. But it is not the only determinant. Public spending can also
Notes: The poverty gap is the distance between the poverty line and the median income of those below the poverty line (expressed as a percentage of the poverty line). Calculations are based on a poverty line set at 50% of the national median income. Countries are ranked by increasing levels of the child poverty gap. Sources: Calculations based on EU-SILC 2009, HILDA 2009, SLID 2009, SHP 2009, PSID 2007. Results for New Zealand are from Perry (2011) and refer to 2010. Results for Japan are from Cabinet Office, Gender Equality Bureau (2011).
help parents to meet children’s needs. And for this reason it is not axiomatic that falling household income must always mean rising levels of child deprivation. The governments that are most successful in protecting children from poverty are likely to be those that strive to reduce the number of low-income households and help to provide essential goods, services and opportunities for children growing up in such households. This strategy makes it possible to offer a significant degree of protection to children even in times of economic crisis. And it also illustrates the usefulness of deploying both a relative income measure and a direct measurement of deprivation in the struggle to monitor and mitigate the impact of economic forces on the lives of children.
How should it be done?
How, then, is child poverty best measured, monitored, and compared? In previous Report Cards, some basic principles for the cross-national monitoring of child poverty have been proposed. They are summarized and updated here.
1. Continue to monitor relative child poverty based on national median incomes
Median income is “a strong indicator of
what is considered normal in contemporary society.”x It should therefore continue
to be used as a basis for identifying those at risk of social exclusion (see Boxes 4 and 6).
Most countries have data on incomes, and these data can be used both to compare countries and to monitor changes over time. Tracking the incomes of those at the bottom end of the distribution in relation to the incomes of those at the median shows how the benefits of economic progress or the pain of economic recession are being distributed. It is not a measure of overall inequality in the society; it is a measure of how the poorest are faring in relation to those in the middle.
The argument that the use of this relative poverty measure may mislead the public because it inevitably carries with it a suggestion of ‘absolute poverty’ is a genuine concern. But this is a problem not so much in the concept as in its communication. It can and should be addressed by sticking strictly to the term ‘relative child poverty’ when that is what is meant. To say that ‘child poverty levels’ are higher in the United States than in the Czech Republic is to invite public
misunderstanding and rejection. To say that ‘relative child poverty levels’ are higher risks no such misunderstanding; there is nothing either misleading or meaningless about the statement that a greater proportion of children are allowed to fall significantly below the norms of their societies in the United States than in the Czech Republic. When presented for what it is – an approximate measure not of absolute poverty but of falling so far behind the
Box 3
Do children have incomes?
Most poverty lines are based on household incomes. But to calculate how many individuals live below the poverty line, household incomes must be converted to equivalent individual incomes (including ‘incomes’ for children).
This cannot be done by simply dividing household income by the number of people in the household. It may not be true that ‘two can live as cheaply as one’, but the amount required to maintain a given standard of living does not rise in direct proportion to the number of people in the home. The cost of heating, or a television or an Internet connection, for example, does not double if there are four people rather than two. Many such economies of scale – including being able to buy food or cleaning materials in bigger quantities – are available to larger households.
Unfortunately there is no scientific way of converting household income into individual incomes. Rough and ready methods must therefore be used, of which the most common is the ‘modified OECD equivalence scale’ by which the first adult in each household is counted as 1.0, the second adult as 0.5, and each child under the age of 14 as 0.3. The total then becomes the number of ‘equivalent individuals’ by which household income must be divided. For example, a household with an income of $46,000 for two adults, one 15-year-old, and one pre-school child would be counted as having the equivalent of 2.3 individuals and their ‘equivalized’ individual incomes would be $20,000. It is this figure that is used to establish the median income for the nation as a whole (the point at which exactly half have more and half have less – see Box 4: The median is the message). The relative poverty line is then drawn at a certain percentage of that median. In the European Union, the line is drawn at 60% of equivalized median income.
The number of children estimated to be living in poverty is then calculated as the number of individual children living in households in which the equivalized income is below this line.
normal standard of living in the society as to be excluded from the advantages and opportunities that the majority take for granted – the idea of relative child poverty does make intuitive sense.
2. Measure deprivation directly
Child poverty also needs to be monitored by direct measurement of deprivation. The proportion of children who lack an adequate diet, or a quiet place to do homework, or suitable books and an Internet connection, is the kind of measure that allows actual living standards to be compared across nations. It makes immediate sense to a wide public and contributes towards a more rounded understanding of child poverty. And in so doing, it also helps
to define and defend the simultaneous use of the relative child poverty rate.xi
The special module on child deprivation, included as a one-off experiment in the latest round of EU-SILC, should therefore be developed into a regular and permanent feature of future surveys.
3. Measure depth and duration
As already noted, it is also important to measure how far below the poverty line the poor are being allowed to fall. For this purpose, the median income of those below the poverty line, as a percentage of the poverty line itself, is a useful measure. Figure 7 has presented this calculation for 35
advanced economies in the form of a ‘poverty gap’ league table.
Ideally, the monitoring of child poverty would include its timing and duration as well as its breadth and depth. The earlier the privation and the longer its duration, the greater the potential impact on the child. This is true both because of the inherent vulnerability of the earliest years of life and because the longer a family stays poor the harder it may become to maintain essential expenditures (as savings and assets run down, for example, or as borrowing and other sources of help reach their limits). In other words, child poverty should
Box 4
The median is the message
The words 'average' and 'median' can still cause
confusion in public discourse and even in policy-making. The difference between the two is illustrated in the diagram below.
Imagine a street with a single row of houses numbered 1 to 15. The household with the lowest income in the street lives at number 1, the second poorest household lives at number 2, and so on up to the richest household in number 15.
The average household income is calculated by dividing the total income of the street by the total number of households. In the example given here, this comes to $60,000.
The median household income is the income of the household in the middle of the income scale – the point at which half of the households have more and half have less. In this example, the median income is $40,000 (the income of house No. 8).
As the example shows, there can be significant differences between the average and the median. The two also respond to change in different ways. Imagine, for example, that the two richest people in the street, living in houses Nos. 14 and 15, were to move out and be replaced by Bill Gates and Warren Buffett. In this event, the average household income of the street would rise to several billion dollars. But the median
Average household income$60,000
Total income of all houses $900,000
Number of houses 15
Median household income $40,000
7 houses with lower income 7 houses with higher income
No. 1
be monitored in three dimensions – asking not only how many children fall below national poverty lines but how
far and for how long.
4. Maintain a close monitoring system
Most governments of economically advanced countries are committed in principle to the monitoring of child poverty and social exclusion. But it must be said that collecting and making available the necessary data every few years is not monitoring. It cannot adequately inform policy or alert governments, the media, the public, the children’s organizations, or the academic community to the problems being faced by children whose years of growth and
development are happening now. All OECD countries have the capacity to track key economic indicators – growth, inflation, unemployment, trade balances – on a quarterly basis. It is therefore unacceptable that basic information on what is happening to children’s lives should be so out of date. Key data on basic aspects of child poverty and child well-being should be made available not every four years but every year.
5. Set time-bound targets and build support
Report Card 6 (2005) recommended
that all OECD countries should aim to reduce relative child poverty rates to
below 10%. Countries that had already achieved this were challenged to emulate the Nordic countries by reducing the rate still further – to 5% or less. Since that time, relative child poverty rates have risen in almost every OECD country* (an increase
that does not as yet reflect the impact of the post-2008 economic downturn). As Figure 1b shows, only Iceland now achieves a relative child poverty rate of less than 5%, though Finland remains close at 5.3%. The latest nationally available data suggest that Iceland, too, has allowed its relative child poverty rate to drift above the 5% mark. This upward trend in relative child poverty rates over recent years is in
income would stay the same: the middle house in the income distribution would still be No. 8, and its income would still be $40,000.
For the same reason, it is quite possible to increase the incomes of all the houses with incomes above the median (Nos. 9 to 15) without affecting the median income of the street as a whole.
It is sometimes said that relative poverty, defined as the percentage of households below a certain percentage of median income, can never be abolished because the target is always moving. As incomes rise, the poverty line also rises, and so ‘the poor will always be with us’. But this is not the case. In the above example, those living in houses 1, 2, 3 and 4 are below the poverty line because their household incomes are below 50% of the median for the street as a whole. But if the incomes of those households were to rise to $20,000 then there would be no houses with incomes below 50% of median. Relative poverty would have been abolished. And the median itself would not have changed.
Illustrating the normal
This distinction between average and median can sometimes be critical. For example, the argument over whether pay is generally higher in the public or private sector may well depend on whether the average or the median is used when making the comparison. If the average is chosen, then pay in the private sector may well be higher – because the average can be substantially increased by a small number of people with very high earnings (the equivalent of Gates and Buffet moving into the street). If the median is selected, on the other hand, then pay in the public sector may be higher – because the median level of pay in the private sector is not increased by the incomes of those at the very top of the income distribution.
Many economists now argue that it is the median, rather than average, that should be used to illustrate what is normal in a given society. Nobel prize-winning economist Joseph Stiglitz, for example, points out that in the United States, “median and average behave differently…real median household income has actually dipped since 2000. But G.D.P. per capita has gone up.”1
* The relative child poverty rates published in Report Card 6 are not strictly comparable with the rates given in Report Card 10 (See Figure 1b and Box 3: Do children have incomes?)
1 Quoted in ‘The Rise and Fall of the G.D.P.’ by Jon Gertner, New York Times, 13 May 2010.