2008
Data
Management
and Probability,
Grades 4 to 6
A Guide to Effective Instruction
in Mathematics,
Kindergarten to Grade 6
Data
Management
and Probability,
Grades 4 to 6
A Guide to Effective Instruction
in Mathematics,
Kindergarten to Grade 6
Every effort has been made in this publication to identify mathematics resources and tools (e.g., manipulatives) in generic terms. In cases where a particular product is used by teachers in schools across Ontario, that product is identified by its trade name, in the interests of clarity. Reference to particular products in no way implies an endorsement of those products by the Ministry of Education.
ContEnts
Introduction 1
The Pleasure of Mathematical Surprise and Insight ...1
Working Towards Equitable Outcomes for Diverse Students ...2
Accommodations and Modifications ...3
The Mathematical Processes ...6
Addressing the Needs of Junior Learners ...8
Learning About Data Management and Probability in the Junior Grades ... 10
The “Big Ideas” of Data Management and Probability 11 About Big Ideas ... 11
About the Teaching and Learning of Data Management and Probability ... 13
Big Ideas and Tiered Instruction... 14
The Big Ideas of Data Management and Probability in Grades 4 to 6... 16
Collection and Organization of Data 20 Overview ... 20
Example: Favourite TV Shows ... 20
Method 1: Matching Questions With Methods of Data Collection and Organization... 21
Method 2: Extending the Problem ... 24
Data Relationships 26 Overview ... 26
Example: The Masses of Backpacks ... 26
Method 1: Understanding Data Relationships ... 27
Method 2: Exploring Data Relationships Through Project-Based Learning ... 30
Probability 31 Overview ... 31
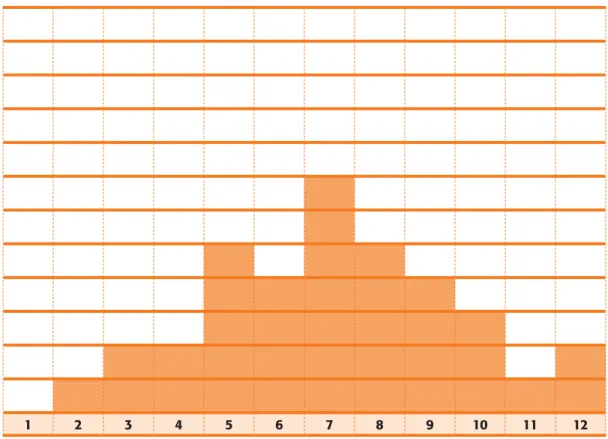
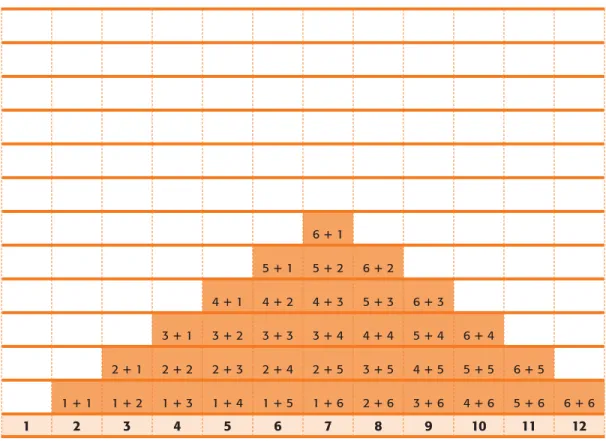
Example: The Sum of Two Number Cubes ... 31
Method 1: Experimental Probability ... 32
References 36
Learning Activities 37
Introduction to the Learning Activities ... 39
Grade 4 Learning Activities 41
Too Much TV
(Collection and Organization of Data; Data Relationships) ... 41 Heads or Tails?
(Probability) ... 55
Grade 5 Learning Activities 68
Daily Physical Activity
(Collection and Organization of Data; Data Relationships) ... 68 Lost Socks
(Probability) ... 81
Grade 6 Learning Activities 93
Paper Airplane Contest
(Collection and Organization of Data; Data Relationships) ... 93 Rock-Paper-Scissors
(Probability) ...104
Appendix: Guidelines for Assessment 115
2
3
4
5
6
7
8
1
2 3
4
5
6
7
8
9
1/2
1/4
1/4
/4
2
3
IntroDuCtIon
Data Management and Probability, Grades 4 to 6 is a practical guide that teachers will find useful in helping students to achieve the curriculum expectations outlined for Grades 4 to 6 in the Data Management and Probability strand of The Ontario Curriculum, Grades 1–8: Mathematics, 2005. This guide provides teachers with practical applications of the principles and theories that are elaborated in A Guide to Effective Instruction in Mathematics,
Kindergarten to Grade 6, 2006.
The first part of the guide provides a detailed discussion of the three “big ideas”, or major mathematical themes, in Data Management and Probability, and provides a discussion of mathematical models and instructional strategies that have proved effective in helping students understand the mathematical concepts related to each big idea. The guide emphasizes the importance of focusing on the big ideas in mathematical instruction to achieve the goal of helping students gain a deeper understanding of mathematical concepts. At the end of the first part of the guide is a list of references cited.
The second part of the guide provides sample learning activities, for Grades 4, 5, and 6, that illustrate how a learning activity can be designed to:
• focus on an important curriculum topic;
• involve students in applying the seven mathematical processes described in the mathematics curriculum document;
• develop understanding of the big ideas in Data Management and Probability.
At the end of the second part of the guide is an appendix that discusses assessment strategies for teachers. There is also a glossary that includes mathematical and other terms that are used in the guide.
the Pleasure of Mathematical surprise and Insight
Young children enter school mathematically curious, imaginative, and capable. They have to learn to be otherwise (Papert, 1980). The aim of this resource is to help consolidate and extend junior students’ mathematical capacity and their potential for mathematical growth by providing ideas and classroom activities that draw their attention to relationships embedded in the big ideas of the Data Management and Probability strand in the Ontario
mathematics curriculum and that offer them opportunities to experience the pleasure of mathematical surprise and insight (Gadanidis, 2004).
The activities in this resource incorporate the ideas and practice of classroom teachers. The activities have been field-tested in Ontario classrooms, and feedback from practising teachers has been used to create the final versions. The chapter “The ‘Big Ideas’ of Data Management and Probability” (pp. 11–19) discusses the big ideas on which the activities have been built and contains additional ideas for classroom activities.
The teaching of mathematics around big ideas offers students opportunities to develop a sophisticated understanding of mathematics concepts and processes, and helps them to maintain their interest in and excitement about doing and learning mathematics.
Working towards Equitable outcomes for Diverse students
All students, whatever their socio-economic, ethnocultural, or linguistic background, must have opportunities to learn and to grow, both cognitively and socially. When students can make personal connections to their learning, and when they feel secure in their learning environment, their true capacity will be realized in their achievement. A commitment to equity and inclusive instruction in Ontario classrooms is therefore critical to enabling all students to succeed in school and, consequently, to become productive and contributing members of society.
To create effective conditions for learning, teachers must take care to avoid all forms of bias and stereotyping in resources and learning activities, which can quickly alienate students and limit their learning. Teachers should be aware of the need to provide a variety of experiences and to encourage multiple perspectives, so that the diversity of the class is recognized and all students feel respected and valued. Learning activities and resources for teaching mathematics should be inclusive, providing examples and illustrations and using approaches that recognize the range of experiences of students with diverse backgrounds, knowledge, skills, interests, and learning styles.
The following are some strategies for creating a learning environment that acknowledges and values the diversity of students and enables them to participate fully in the learning experience:
• providing mathematics problems with situations and contexts that are meaningful to all students (e.g., problems that reflect students’ interests, home-life experiences, and cultural backgrounds and that arouse their curiosity and spirit of enquiry);
• using mathematics examples drawn from diverse cultures, including Aboriginal peoples’; • using children’s literature that reflects various cultures and customs as a source of
mathe-matical examples and situations;
Introduction
For example, a student may come from a culture in which it is considered inappropriate for a child to ask for help, express opinions openly, or make direct eye contact with an adult;
• considering the appropriateness of references to holidays, celebrations, and traditions; • providing clarification if the context of a learning activity is unfamiliar to students
(e.g., describing or showing a food item that may be new to some students);
• evaluating the content of mathematics textbooks, children’s literature, and supplementary materials for cultural or gender bias;
• designing learning and assessment activities that allow students with various learning styles (e.g., auditory, visual, tactile/kinaesthetic) to participate meaningfully;
• providing opportunities for students to work both independently and interdependently with others;
• providing opportunities for students to communicate orally and in writing in their home language (e.g., pairing an English language learner with a first-language peer who also speaks English);
• using diagrams, pictures, manipulatives, sounds, and gestures to clarify mathematical vocabulary that may be new to English language learners.
For a full discussion of equity and diversity in the classroom, as well as a detailed checklist for providing inclusive mathematics instruction, see pages 34–40 in Volume 1 of A Guide to Effective Instruction in Mathematics, Kindergarten to Grade 6, 2006.
Accommodations and Modifications
The learning activities in this document have been designed for students with a range of learning needs. Instructional and assess-ment tasks are open-ended, allowing most students to participate fully in learning experiences. In some cases, individual students may require accommodations and/or modifications, in accordance with their Individual Education Plan (IEP), to support their participation in learning activities.
PROVIDING ACCOMMODATIONS
Students may require accommodations, including special strate-gies, support, and/or equipment to allow them to participate in learning activities. There are three types of accommodations:
• Instructional accommodations are adjustments in teaching strate-gies, including styles of presentation, methods of organization, or the use of technology or multimedia.
The term accommodations is used to refer to the special tea-ching and assessment strategies, human supports, and/or indi-vidualized equipment required to enable a student to learn and to demonstrate learning. Accommodations do not alter the provincial curriculum expectations for the grade.
Modifications are changes made
in the age-appropriate grade-level expectations for a subject … in order to meet a student’s learning needs. These changes may involve developing expecta-tions that reflect knowledge and skills required in the curriculum for a different grade level and/or increasing or decreasing the number and/or complexity of the regular grade-level curriculum expectations.
(Ontario Ministry of Education, 2004, pp. 25–26)
The term accommodations is used to refer to the special tea-ching and assessment strategies, human supports, and/or indi-vidualized equipment required to enable a student to learn and to demonstrate learning. Accommodations do not alter the provincial curriculum expectations for the grade.
Modifications are changes made
in the age-appropriate grade-level expectations for a subject … in order to meet a student’s learning needs. These changes may involve developing expecta-tions that reflect knowledge and skills required in the curriculum for a different grade level and/or increasing or decreasing the number and/or complexity of the regular grade-level curriculum expectations.
(Ontario Ministry of Education, 2004, pp. 25–26)
• Environmental accommodations are supports or changes that the student may require in the physical environment of the classroom and/or the school, such as preferential seating or special lighting.
• Assessment accommodations are adjustments in assessment activities and methods that enable the student to demonstrate learning, such as allowing additional time to complete tasks or permitting oral responses to test questions.
Some of the ways in which teachers can provide accommodations with respect to math-ematics learning activities are listed in the following chart.
Instructional Accommodations
• Vary instructional strategies, using different manipulatives, examples, and visuals (e.g., concrete materials, pictures, diagrams) as necessary to aid understanding.
• Rephrase information and instructions to make them simpler and clearer. • Use non-verbal signals and gesture cues to convey information.
• Teach mathematical vocabulary explicitly. • Have students work with a peer.
• Structure activities by breaking them into smaller steps.
• Model concepts using concrete materials and computer software, and encourage students to use them when learning concepts or working on problems.
• Have students use calculators and/or addition and multiplication grids for computations. • Format worksheets so that they are easy to understand (e.g., use large-size font; an uncluttered
layout; spatial cues, such as arrows; colour cues).
• Encourage students to use graphic organizers and square grid paper to organize ideas and written work.
• Provide augmentative and alternative communications systems. • Provide assistive technology, such as text-to-speech software. • Provide time-management aids (e.g., checklists).
• Encourage students to verbalize as they work on mathematics problems. • Provide access to computers.
• Reduce the number of tasks to be completed. • Provide extra time to complete tasks.
Environmental Accommodations • Provide an alternative workspace.
• Seat students strategically (e.g., near the front of the room; close to the teacher in group settings; with a classmate who can help them).
• Reduce visual distractions. • Minimize background noise. • Provide a quiet setting.
• Provide headphones to reduce audio distractions. • Provide special lighting.
Introduction
Assessment Accommodations• Have students demonstrate understanding using concrete materials, using computer software, or orally rather than in written form.
• Have students record oral responses on audiotape.
• Have students’ responses on written tasks recorded by a scribe. • Provide assistive technology, such as speech-to-text software. • Provide an alternative setting.
• Provide assistive devices or adaptive equipment.
• Provide augmentative and alternative communications systems.
• Format tests so that they are easy to understand (e.g., use large-size font; an uncluttered layout; spatial cues, such as arrows; colour cues).
• Provide access to computers.
• Provide access to calculators and/or addition and multiplication grids. • Provide visual cues (e.g., posters).
• Provide extra time to complete problems or tasks or answer questions. • Reduce the number of tasks used to assess a concept or skill.
MODIFYING CURRICULUM EXPECTATIONS
Students who have an IEP may require modified expectations, which differ from the regular grade-level curriculum expectations. When developing modified expectations, teachers make important decisions regarding the concepts and skills that students need to learn. Most of the learning activities in this document can be adapted for students who require modified expectations. The following chart provides examples of how a teacher could deliver learning activities that incorporate individual students’ modified expectations.
Modified Program What It Means Example
Modified learning
expecta-tions, same activity, same
materials
The student with modified expectations works on the same or a similar activity, using the same materials.
The learning activity involves representing a probability as a fraction. Students with modi-fied expectations represent the probability using an area model.
Modified learning
expecta-tions, same activity, different
materials
The student with modified expectations engages in the same activity but uses different materials that enable him/her to remain an equal participant in the activity.
The activity involves creating a bar graph to display data. Students with modified expectations can use statistical software to create the bar graph.
Modified Program What It Means Example
Modified learning
expecta-tions, different activity,
different materials
Students with modified expec-tations participate in different activities.
Students with modified expectations work on data management and probability activities that reflect their learning expectations, using a variety of materials and technological tools.
(Adapted from Education for All: The Report of the Expert Panel on Literacy and Numeracy Instruction for
Students With Special Education Needs, Kindergarten to Grade 6, p. 119.)
It is important to note that some students may require both accommodations and modified expectations.
the Mathematical Processes
The Ontario Curriculum, Grades 1–8: Mathematics, 2005 identifies seven mathematical processes through which students acquire and apply mathematical knowledge and skills. The mathematical processes that support effective learning in mathematics are as follows:
• problem solving • connecting
• reasoning and proving • representing
• reflecting • communicating
• selecting tools and computational strategies
The learning activities in this guide demonstrate how the mathematical processes help students develop mathematical understanding. Opportunities to solve problems, to reason mathematically, to reflect on new ideas, and so on, make mathematics meaningful for students. The learning activities also demonstrate that the mathematical processes are interconnected – for example, problem-solving tasks encourage students to represent math-ematical ideas, to select appropriate tools and strategies, to communicate and reflect on strategies and solutions, and to make connections between mathematical concepts.
Problem Solving: Each of the learning activities is structured around a problem or an inquiry. As students solve problems or conduct investigations, they make connections between new mathematical concepts and ideas that they already understand. The focus on problem solving and inquiry in the learning activities also provides opportunities for students to:
• find enjoyment in mathematics;
Introduction
• work collaboratively and talk about mathematics; • communicate ideas and strategies;
• reason and use critical thinking skills; • develop processes for solving problems;
• develop a repertoire of problem-solving strategies;
• connect mathematical knowledge and skills with situations outside the classroom.
Reasoning and Proving: The learning activities described in this document provide oppor-tunities for students to reason mathematically as they explore new concepts, develop ideas, make mathematical conjectures, and justify results. The learning activities include questions that teachers can use to encourage students to explain and justify their mathematical thinking, and to consider and evaluate the ideas proposed by others.
Reflecting: Throughout the learning activities, students are asked to think about, reflect on, and monitor their own thought processes. For example, questions posed by the teacher encourage students to think about the strategies they use to solve problems and to examine the mathematical ideas that they are learning. In the Reflecting and Connecting part of each learning activity, students have an opportunity to discuss, reflect on, and evaluate their problem-solving strategies, solutions, and mathematical insights.
Selecting Tools and Computational Strategies: Mathematical tools, such as manipulatives, pictorial models, and computational strategies, allow students to represent and do math-ematics. The learning activities in this document provide opportunities for students to select tools (concrete, pictorial, and symbolic) that are personally meaningful, thereby allowing individual students to solve problems and to represent and communicate mathematical ideas at their own level of understanding.
Connecting: The learning activities are designed to allow students of all ability levels to connect new mathematical ideas to what they already understand. The learning activity descriptions provide guidance to teachers on ways to help students make connections among concrete, pictorial, and symbolic mathematical representations. Advice on helping students develop conceptual understanding is also provided. The problem-solving experience in many of the learning activities allows students to connect mathematics to real-life situa-tions and meaningful contexts.
Representing: The learning activities provide opportunities for students to represent mathe-matical ideas by using concrete materials, pictures, diagrams, numbers, words, and symbols. Representing ideas in a variety of ways helps students to model and interpret problem situations, understand mathematical concepts, clarify and communicate their thinking, and make connections between related mathematical ideas. Students’ own concrete and pictorial representations of mathematical ideas provide teachers with valuable assessment information about student understanding that cannot be assessed effectively using paper-and-pencil tests.
Communicating: Communication of mathematical ideas is an essential process in learning mathematics. Throughout the learning activities, students have opportunities to express mathematical ideas and understandings orally, visually, and in writing. Often, students are asked to work in pairs or in small groups, thereby providing learning situations in which students talk about the mathematics that they are doing, share mathematical ideas, and ask clarifying questions of their classmates. These oral experiences help students to organize their thinking before they are asked to communicate their ideas in written form.
Addressing the needs of Junior Learners
Every day, teachers make many decisions about instruction in their classrooms. To make informed decisions about teaching mathematics, teachers need to have an understanding of the big ideas in mathematics, the mathematical concepts and skills outlined in the curriculum document, effective instructional approaches, and the characteristics and needs of learners. The following chart outlines general characteristics of junior learners and describes some of the implications of these characteristics for teaching mathematics to students in Grades 4, 5, and 6.
Area of Development
Characteristics of Junior Learners
Implications for Teaching Mathematics
Intellectual Development
Generally, students in the junior grades:
• prefer active learning experiences that allow them to interact with their peers;
• are curious about the world around them;
• are at a concrete, operational stage of development, and are often not ready to think abstractly; • enjoy and understand the
subtle-ties of humour.
The mathematics program should provide:
• learning experiences that allow students to actively explore and construct mathematical ideas; • learning situations that involve the
use of concrete materials; • opportunities for students to see
that mathematics is practical and important in their daily lives; • enjoyable activities that stimulate
curiosity and interest;
• tasks that challenge students to reason and think deeply about mathematical ideas.
Introduction
Area ofDevelopment
Characteristics of Junior Learners
Implications for Teaching Mathematics
Physical Development
Generally, students in the junior grades:
• experience a growth spurt before puberty (usually at age 9–10 for girls, at age 10–11 for boys); • are concerned about body image; • are active and energetic;
• display wide variations in physical development and maturity.
The mathematics program should provide:
• opportunities for physical move-ment and hands-on learning; • a classroom that is safe and
physi-cally appealing.
Psychological Development
Generally, students in the junior grades:
• are less reliant on praise, but still respond well to positive feedback; • accept greater responsibility for
their actions and work; • are influenced by their peer
groups.
The mathematics program should provide:
• ongoing feedback on students’ learning and progress;
• an environment in which students can take risks without fear of ridicule;
• opportunities for students to accept responsibility for their work;
• a classroom climate that supports diversity and encourages all members to work cooperatively.
Social Development Generally, students in the junior
grades:
• are less egocentric, yet require individual attention;
• can be volatile and changeable in regard to friendship, yet want to be part of a social group; • can be talkative;
• are more tentative and unsure of themselves;
• mature socially at different rates.
The mathematics program should provide:
• opportunities to work with others in a variety of groupings (pairs, small groups, large group); • opportunities to discuss
math-ematical ideas;
• clear expectations of what is acceptable social behaviour; • learning activities that involve all
students regardless of ability. Moral and Ethical
Development
Generally, students in the junior grades:
• develop a strong sense of justice and fairness;
• experiment with challenging the norm and ask “why” questions; • begin to consider others’ points of
view.
The mathematics program should provide:
• learning experiences that provide equitable opportunities for participation by all students; • an environment in which all ideas
are valued;
• opportunities for students to share their own ideas, and evaluate the ideas of others.
(Adapted, with permission, from Making Math Happen in the Junior Years. Elementary Teachers’
Learning About Data Management and Probability
in the Junior Grades
The development of an understanding of data management and probability concepts and relationships is a gradual one, moving from experiential and physical learning to theoretical and inferential learning. Data management and probability thinking in the junior years begins to bridge the two.
PRIOR LEARNING
In the primary grades, students learn to collect and organize discrete primary data and to display data using concrete representations, as well as charts and bar graphs. They learn to read, describe, and interpret primary data presented in charts and graphs. They predict and investigate the frequency of a specific outcome in a simple probability experiment. Learning about data management and probability allows students to develop the concepts and language they need for understanding data and chance in the world around them.
Experiences in the primary classroom include sorting and classifying objects into categories; conducting simple surveys; organizing and displaying data in charts, tables, and graphs; reading, describing, and drawing conclusions from primary data; predicting the frequency of an outcome in a simple probability experiment; and investigating the concept of fairness in games.
KNOWLEDGE AND SKILLS DEVELOPED IN THE JUNIOR GRADES
In the junior grades, students continue to collect, organize, display, and interpret primary data, and explore simple probability. They also learn to deal with secondary data and to display and read data presented in a greater variety of forms, such as double bar graphs and stem-and-leaf plots. They extend their understanding of mode and develop an understanding of median and mean. They also extend their knowledge of probability. Junior students develop a more sophisticated and abstract understanding of probability and start developing their knowledge of theoretical probability. They use websites, such as E-Stat or Census at Schools; spreadsheets; and dynamic statistical software.
Junior students extend their understanding of data management and probability relation-ships through investigation. They conduct surveys and probability experiments and solve related problems. For example, “Would the results of a survey of primary students about their favourite television shows represent the favourite shows of students in the entire school? Why or why not? How might the survey be improved?” Or “Suppose you roll two number cubes and calculate the sum of the numbers rolled. Which sum is more likely: 2 or 8? Conduct a probability experiment to test your hypothesis. Determine the theoretical probability for each sum.”
Such problems offer junior students opportunities to use and extend their knowledge of data management and probability. Data management and probability problems are often situated in real-life settings. Instruction that is based on meaningful and relevant contexts helps stu-dents to achieve the curriculum expectations related to data management and probability.
thE “BIG IDEAs” of DAtA
MAnAGEMEnt AnD ProBABILIty
All learning, especially new learning, should be embedded in well-chosen contexts for learning – that is, contexts that are broad enough to allow students to investigate initial understandings, identify and develop relevant supporting skills, and gain experience with varied and interesting applications of the new knowledge. Such rich contexts for learning open the door for students to see the “big ideas”, or key principles, of mathematics, such as pattern or relationship.
(The Ontario Curriculum, Grades 1–8: Mathematics, 2005, p. 25)
About Big Ideas
Ginsburg (2002, p. 13), who has extensively studied young children doing mathematics, suggests that, although “mathematics is big”, children’s minds are bigger. He argues that “children possess greater competence and interest in mathematics than we ordinarily recog-nize”, and we should aim to develop a curriculum for them in which they are challenged to understand big mathematical ideas and have opportunities to “achieve the fulfilment and enjoyment of their intellectual interest” (p. 7).
In developing a mathematics program, it is important to concentrate on major mathematical themes, or “big ideas”, and the important knowledge and skills that relate to those big ideas. Programs that are organized around big ideas and focused on problem solving provide cohe-sive learning opportunities that allow students to explore mathematical concepts in depth. An emphasis on big ideas contributes to the main goal of mathematics instruction – to help students gain a deeper understanding of mathematical concepts.
“When students construct a big idea, it is big because they make connections that allow them to use mathematics more effectively and powerfully” (Fosnot & Dolk, 2001). Teaching and Learning Mathematics: The Report of the Expert Panel on Mathematics in Grades 4 to 6 in Ontario, 2004 (p. 19) states that “big ideas are also critical leaps for students who are devel-oping mathematical concepts and abilities”.
2
3
4
5
6
7
8
1
2 3
4
5
6
7
8
9
1/2
1/4
1/4
/4
2
3
Students are better able to see the connections in mathematics, and thus to learn mathematics, when it is organized in big, coherent “chunks”. In organizing a mathematics program, teachers should concentrate on the big ideas and view the expectations in the curriculum policy documents for Grades 4 to 6 as being clustered around those big ideas.
The clustering of expectations around big ideas provides a focus for student learning and for teacher professional development in mathematics. Teachers will find that investigating and discussing effective teaching strategies for a big idea is much more valuable than trying to determine specific strategies and approaches to help students achieve individual expecta-tions. In fact, using big ideas as a focus helps teachers to see that the concepts presented in the curriculum expectations should not be taught as isolated bits of information but rather as a network of interrelated concepts.
In building a program, teachers need a sound understanding of the key mathematical concepts for their students’ grade level, as well as an understanding of how those concepts connect with students’ prior and future learning (Ma, 1999). Such knowledge includes an understanding of the “conceptual structure and basic attitudes of mathematics inherent in the elementary curriculum” (p. xxiv), as well as an understanding of how best to teach the concepts to children. Concentrating on developing this knowledge will enhance teaching and provide teachers with the tools to differentiate instruction.
Focusing on the big ideas provides teachers with a global view of the concepts represented in the strand. The big ideas also act as a “lens” for:
• making instructional decisions (e.g., choosing an emphasis for a lesson or set of lessons); • identifying prior learning;
• looking at students’ thinking and understanding in relation to the mathematical concepts addressed in the curriculum (e.g., making note of the ways in which a student solves a division problem);
• collecting observations and making anecdotal records; • providing feedback to students;
• determining next steps;
• communicating concepts and providing feedback on students’ achievement to parents1
(e.g., in report card comments).
Focusing on the big ideas also means that teachers use strategies for advancing all students’ mathematical thinking (Fraivillig, 2001) by:
• eliciting from students a variety of solution methods through appropriate prompts, col-laborative learning, and a positive, supportive classroom environment;
The “Big Ideas” of Data Management and Probability
• helping students develop conceptual understanding by attending to relationships among concepts;
• extending students’ mathematical thinking by (a) encouraging them to try alternative ways of finding solutions and to generalize, and (b) setting high standards of math-ematical performance for all students.
About the teaching and Learning of Data Management
and Probability
The related topics of data management and probability are highly relevant to everyday life. Graphs and statistics bombard the public in advertising, opinion polls, population trends, reliability estimates, descriptions of discoveries by scientists, and estimates of health risks, to name a few.
(The Ontario Curriculum, Grades 1–8: Mathematics, 2005,p. 9) The National Council of Teachers of Mathematics (NCTM, 2000) suggests that junior students need frequent experiences with investigations, ranging from “quick class surveys to projects that take several days” (p. 177).
Frequent work with brief surveys (How many brothers and sisters do people in our class have? What’s the farthest you have been from your home?) can acquaint students with particular aspects of collecting, representing, summarizing, comparing, and interpreting data. More extended projects can engage students in a cycle of data analysis – formulating questions, collecting and representing the data, and considering whether their data are giving them the information they need to answer their question (NCTM, 2000, p. 177). In the junior grades, students are becoming more aware of and interested in the world around them. By studying data management and probability in contexts provided by other subject areas, such as social studies, science, and health and physical education, they have the opportunity to connect with the world.
It is not uncommon to encounter forms of data representation that give a misleading interpretation of the data. It is also not uncommon to find that adults often have mis-conceptions about probability. Junior students need a solid understanding of probability and need help to develop critical data analysis skills. Meaningful hands-on investiga-tions are the ideal starting point.
Big Ideas and tiered Instruction
2
How students experience a big idea, and how big it becomes, depends greatly on how it is developed pedagogically in the classroom. It is not enough to label a mathematical concept as a big idea. Big ideas must be coupled with a pedagogy that offers students opportunities to attend deeply to mathematical concepts and relationships.
Big ideas, and a pedagogy that supports student learning of big ideas, naturally provide opportunities for meeting the needs of students who are working at different levels of mathematical performance. The reason for this is that teaching around big ideas means teaching around ideas that incorporate a variety of levels of mathematical sophistication. For example, consider the problem of finding the probabilities associated with tossing two coins
and the tiers at which the problem can be approached or extended:
Tier 1: Students predict which of the outcomes – 2 heads, 2 tails, or 1 head and 1 tail – is more likely (or whether they are all equally likely) and conduct a probability experiment to test their predictions.
Tier 2: Students also consider the effect of the number of trials on experimental probability. They describe their reasoning in the context of typical misconceptions, such as “previous probability trials affect future trials” (for example, if a coin is tossed and comes up heads 5 times in a row, the probability of getting a head on the 6th toss decreases).
Tier 3: Students may also consider all possible outcomes (HH, HT, TH, TT) in order to explain why the probability of 1 head and 1 tail is 1/2, while the probability of 2 heads is 1/4. This is a first, informal step towards the development of an understanding of theoretical probability.
A probability activity such as finding the probabilities associated with tossing two coins addresses Grade 5 expectations within the Data Management and Probability strand of The Ontario Curriculum, Grades 1–8: Mathematics, 2005 (p. 85). It is also a problem that students encounter in earlier grades. For instance, a Grade 2 expectation (p. 52) includes the following sample of student thinking: “I tossed 2 coins at the same time, to see how often I would get 2 heads. I found that getting a head and a tail was more likely than getting 2 heads.”
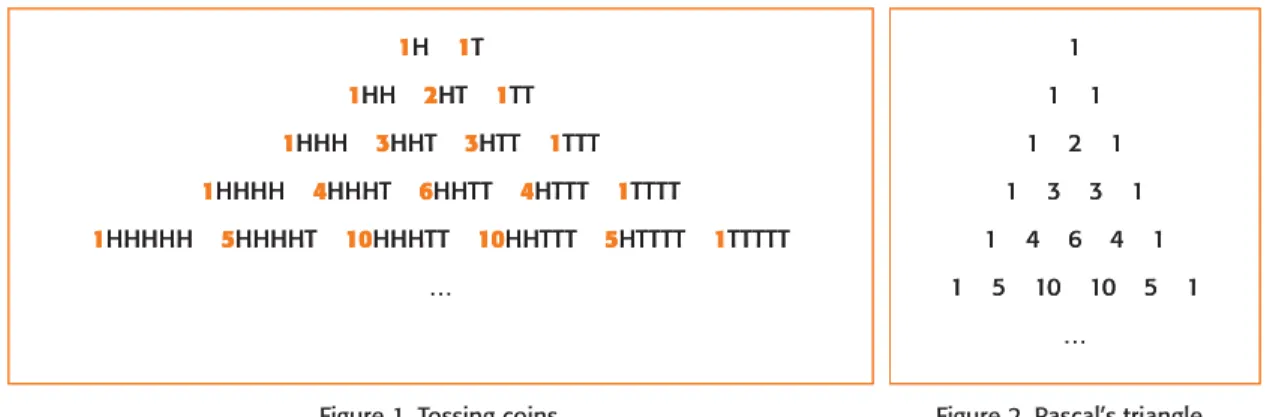
The problem of finding the probabilities associated with tossing two coins can be extended to 3 coins and 4 coins. When students do this, teachers can show them a connection to Pascal’s Triangle (Figures 1 and 2). When students toss 2 coins, there is one way of getting 2 heads (HH), two ways of getting 1 head and 1 tail (HT or TH), and one way of getting
2. A tiered approach to instruction is suggested in Education for All – The Report of the Expert Panel on Literacy and Numeracy Instruction for Students With Special Education Needs, Kindergarten to Grade 6, 2005, pp. 60, 120, 123.
The “Big Ideas” of Data Management and Probability
2 tails. When students toss 3 coins, there is one way of getting 3 heads (HHH), three ways of getting 2 heads and 1 tail (HHT, HTH, THH), three ways of getting 1 head and 2 tails (HTT,THT, TTH), one way of getting 3 tails (TTT), and so forth.
Students can use either Figure 1 or Figure 2 to determine theoretical probabilities. For example, the theoretical probability of tossing 3 heads (HHH) is 1/8. The theoretical probability of tossing 2 heads and 1 tail is 3/8.
Figure 1. Tossing coins Figure 2. Pascal’s triangle
When students are studying algebra in Grades 9 and 10, they can extend this understanding to expressions, such as (xy)2 or (xy)3.
(xy)01
(xy)11x1y
(xy)21x22xy1y2
(xy)31x33x2y3xy21y3
(xy)41x44x3y6x2y24xy31y4
(xy)51x55x4y10x3y210x2y35xy41y5
…
Figure 3. Expanding binomial products
Notice the similarity of the patterns in Figures 1, 2, and 3.
Underlying all of this is the binomial theorem, which students encounter in Grades 11 and 12 and at the university level in the study of algebra, probability, and statistics.
Big ideas, big problems, and a pedagogy that supports them at the classroom level provide opportunities for students to engage with the same mathematical situation at different levels of sophistication. They also help students discover the connections among, and the beauty of, mathematical ideas.
1H 1T
1HH 2HT 1TT
1HHH 3HHT 3HTT 1TTT
1HHHH 4HHHT 6HHTT 4HTTT 1TTTT
1HHHHH 5HHHHT 10HHHTT 10HHTTT 5HTTTT 1TTTTT …
1 1 1 1 2 1 1 3 3 1 1 4 6 4 1 1 5 10 10 5 1
…
1H 1T
1HH 2HT 1TT
1HHH 3HHT 3HTT 1TTT
1HHHH 4HHHT 6HHTT 4HTTT 1TTTT
1HHHHH 5HHHHT 10HHHTT 10HHTTT 5HTTTT 1TTTTT …
1 1 1 1 2 1 1 3 3 1 1 4 6 4 1 1 5 10 10 5 1
the Big Ideas of Data Management and Probability
in Grades 4 to 6
The goal of teaching and learning mathematics through big ideas is an integral component of The Ontario Curriculum, Grades 1–8: Mathematics, 2005. In each of the strands and in each of the grades, the specific expectations have been organized around big ideas in mathematics.
The big ideas in Data Management and Probability in Grades 4 to 6 are:
• collection and organization of data • data relationships
• probability
The tables that follow show how the expectations for each of these big ideas progress through the junior grades. The sections that follow offer teachers strategies and content knowledge to address these expectations in the junior grades while helping students develop an understanding of data management and probability. Teachers can facilitate this under-standing by engaging students in meaningful activities where:
• they collect and organize primary and secondary data;
• they interpret and use charts and graphs, including continuous line graphs; • they explain relationships between data sets and draw inferences from data;
The “Big Ideas” of Data Management and Probability
Curriculum Expectations Related to Collection and Organization of Data,Grades 4, 5, and 6 By the end of Grade 4,
students will:
By the end of Grade 5, students will:
By the end of Grade 6, students will:
Overall Expectations
• collect and organize discrete primary data and display the data using charts and graphs, including stem-and-leaf plots and double bar graphs. Specific Expectations
• collect data by conducting a survey or an experiment to do with themselves, their environ-ment, issues in their school or the community, or content from another subject, and record observations or measurements; • collect and organize discrete
primary data and display the data in charts, tables, and graphs (including stem-and-leaf plots and double bar graphs) that have appropriate titles, labels, and scales that suit the range and distribution of the data, using a variety of tools.
Overall Expectations
• collect and organize discrete or continuous primary data and secondary data and display the data using charts and graphs, including broken-line graphs. Specific Expectations
• distinguish between discrete data (i.e., data organized using numbers that have gaps between them, such as whole numbers, and often used to represent a count, such as the number of times a word is used) and continuous data (i.e., data organized using all numbers on a number line that fall within the range of the data, and used to represent measure-ments such as heights or ages of trees);
• collect data by conducting a survey or an experiment to do with themselves, their environ-ment, issues in their school or community, or content from another subject, and record observations or measurements; • collect and organize discrete or continuous primary data and secondary data and display the data in charts, tables, and graphs (including broken-line graphs) that have appropriate titles, labels, and scales that suit the range and distribution of the data, using a variety of tools;
• demonstrate an understanding that sets of data can be samples of larger populations;
• describe, through investigation, how a set of data is collected and explain whether the collec-tion method is appropriate.
Overall Expectations
• collect and organize discrete or continuous primary data and secondary data and display the data using charts and graphs, including continuous line graphs. Specific Expectations • collect data by conducting
a survey or an experiment to do with themselves, their environment, issues in their school or community, or content from another subject, and record observa-tions or measurements; • collect and organize discrete
or continuous primary data and secondary data and display the data in charts, tables, and graphs (including continuous line graphs) that have appropriate titles, labels, and scales that suit the range and distribution of the data, using a variety of tools;
• select an appropriate type of graph to represent a set of data, graph the data using technology, and justify the choice of graph (i.e., from types of graphs already studied, such as pictographs, horizontal or vertical bar graphs, stem-and-leaf plots, double bar graphs, broken-line graphs, and continuous line graphs);
• determine, through investiga-tion, how well a set of data represents a population, on the basis of the method that was used to collect the data.
Curriculum Expectations Related to Data Relationships, Grades 4, 5 and 6 By the end of Grade 4,
students will:
By the end of Grade 5, students will:
By the end of Grade 6, students will:
Overall Expectations
• read, describe, and interpret primary data and secondary data presented in charts and graphs, including stem-and-leaf plots and double bar graphs. Specific Expectations
• read, interpret, and draw conclusions from primary data and from secondary data, presented in charts, tables, and graphs (including stem-and-leaf plots and double bar graphs); • demonstrate, through
inves-tigation, an understanding of median, and determine the median of a set of data; • describe the shape of a set of
data across its range of values, using charts, tables, and graphs; • compare similarities and
differences between two related sets of data, using a variety of strategies.
Overall Expectations
• read, describe, and interpret primary data and secondary data presented in charts and graphs, including broken-line graphs.
Specific Expectations
• read, interpret, and draw con-clusions from primary data and from secondary data, presented in charts, tables, and graphs (including broken-line graphs); • calculate the mean for a
small set of data and use it to describe the shape of the data set across its range of values, using charts, tables, and graphs; • compare similarities and
differences between two related sets of data, using a variety of strategies.
Overall Expectations
• read, describe, and interpret data, and explain relation-ships between sets of data. Specific Expectations • read, interpret, and draw
conclusions from primary data and from secondary data, presented in charts, tables, and graphs (including continuous line graphs); • compare, through
investiga-tion, different graphical representations of the same data;
• explain how different scales used on graphs can influence conclusions drawn from the data;
• demonstrate an understand-ing of mean, and use the mean to compare two sets of related data, with and without the use of technology;
• demonstrate, through investigation, an understand-ing of how data from charts, tables, and graphs can be used to make inferences and convincing arguments.
The “Big Ideas” of Data Management and Probability
Curriculum Expectations Related to Probability, Grades 4, 5, and 6By the end of Grade 4,
students will: By the end of Grade 5, students will: By the end of Grade 6, students will:
Overall Expectations
• predict the results of a simple probability experiment, then conduct the experiment and compare the prediction to the results.
Specific Expectations • predict the frequency of an
outcome in a simple probability experiment, explaining their reasoning; conduct the experi-ment; and compare the result with the prediction;
• determine, through investiga-tion, how the number of repetitions of a probability experiment can affect the conclusions drawn.
Overall Expectations
• represent as a fraction the prob-ability that a specific outcome will occur in a simple probabil-ity experiment, using systematic lists and area models.
Specific Expectations
• determine and represent all the possible outcomes in a simple probability experiment, using systematic lists and area models;
• represent, using a common fraction, the probability that an event will occur in simple games and probability experiments;
• pose and solve simple probabil-ity problems, and solve them by conducting probability experi-ments and selecting appropriate methods of recording the results.
Overall Expectations • determine the theoretical
probability of an outcome in a probability experiment, and use it to predict the frequency of the outcome. Specific Expectations • express theoretical
probabil-ity as a ratio of the number of favourable outcomes to the total number of possible outcomes, where all out-comes are equally likely; • represent the probability of
an event (i.e., the likelihood that the event will occur), using a value from the range of 0 (never happens or impossible) to 1 (always happens or certain); • predict the frequency of an
outcome of a simple prob-ability experiment or game, by calculating and using the theoretical probability of that outcome.
CoLLECtIon AnD orGAnIzAtIon
of DAtA
overview
Students enter the junior grades with experience in and knowledge of collecting and organizing data and displaying the data “using charts and graphs, including vertical and horizontal bar graphs, with labels ordered appropriately along horizontal axes, as needed” (Ontario Ministry of Education, 2005, p. 63). As they move through the junior grades, students consolidate the following skills:
• dealing with discrete and continuous data;
• using a variety of data collection techniques (surveys, experiments, observations, measurements);
• using a variety of data representation tools (charts, tables, graphs, spreadsheets, statistical software);
• describing and explaining their data collection and organization methods.
Example: favourite tV shows
Let’s see how the big idea of “collection and organization of data” could be developed during a survey of favourite TV shows, a sample problem listed among the expectations for Grade 6 in The Ontario Curriculum, Grades 1–8: Mathematics, 2005 (p. 95).
This problem presents students with the opportunity to describe and explain the appropri-ateness of a data collection method (in this case, a survey of primary students) in relation to a question asked (What are the favourite shows of students in the school?).
The problem can be presented to students as part of a larger group of similar problems (see Figure 4) that they discuss with partners or other members of small groups, afterwards
Sample problem: Would the results of a survey of primary students about their favourite tele-vision shows represent the favourite shows of students in the entire school? Why or why not?
Sample problem: Would the results of a survey of primary students about their favourite tele-vision shows represent the favourite shows of students in the entire school? Why or why not?
2
3
4
5
6
7
8
1
2 3
4
5
6
7
8
9
1/2
1/4
1/4
/4
2
3
Collection and Organization of Data
2
sharing their ideas with the whole class (as in Method 1 below). The problem can also be extended to engage students in designing their own questions and methods of data collec-tion and organizacollec-tion (see Method 2, p. 24).
Method : Matching Questions With Methods of
Data Collection and organization
Questions such as those in Figure 4 help students to focus their attention on the relation-ship between (1) the question asked and the data collection method used, and (2) the data collected and the method use to organize and display it.
Figure 4. Questions to get students thinking
Students in the junior grades are in the process of developing an understanding of methods of data collection and organization.
In terms of data collection students are learning to do the following:
• distinguish between discrete and continuous data
– some examples of discrete data are shoe sizes and number of cars
– discrete data occur in cases where there are only a limited number of values or when students are counting something
– discrete data typically involve the use of whole numbers (0, 1, 2, 3, …) – some examples of continuous data are temperature, time, and height – continuous data typically occur with physical measurement
– continuous data typically involve the use of all numbers on the number line (whole numbers and all the decimals between them)
WHAT DO YOU THINK?
1. Would the results of a survey of primary students about their favourite television shows represent the favourite shows of students in the entire school? Why or why not?
2. Would the results of a survey of students in the school lunch room about how often they go home for lunch be representative? Why or why not?
3. Would the mean height of your friends be representative of the mean height of students in your grade? Why or why not?
4. Would a bar graph showing the types of cars parked in the school parking lot be representative of the cars in your neighbourhood?
5. Would a broken-line graph be an appropriate method for displaying the data from question 1? 6. Would a stem-and-leaf plot be an appropriate method for displaying the data from question 2? 7. Would a circle graph be an appropriate method for displaying the data from question 3?
WHAT DO YOU THINK?
1. Would the results of a survey of primary students about their favourite television shows represent the favourite shows of students in the entire school? Why or why not?
2. Would the results of a survey of students in the school lunch room about how often they go home for lunch be representative? Why or why not?
3. Would the mean height of your friends be representative of the mean height of students in your grade? Why or why not?
4. Would a bar graph showing the types of cars parked in the school parking lot be representative of the cars in your neighbourhood?
5. Would a broken-line graph be an appropriate method for displaying the data from question 1? 6. Would a stem-and-leaf plot be an appropriate method for displaying the data from question 2? 7. Would a circle graph be an appropriate method for displaying the data from question 3?
• design surveys to answer questions
– develop good survey questions
– distinguish between a population to be surveyed and a sample of the population – ensure that the sample is representative of the population
• design experiments to answer questions
– relate the design of the experiment to the scientific method studied in science
• use observation or measurement to answer questions
– use strategies to observe or measure
– decide how accurate observations or measurements need to be
• describe, explain, and justify their data collection methods
In terms of data organization students are learning to:
• distinguish among the different methods of data organization (tally, chart, pictograph, stem-and-leaf plot, bar graph, circle graph, line graph);
• select methods of data organization that are appropriate for the data collected; • describe, explain, and justify their methods of data organization.
By using technology, students can experience some of these methods of data organization in a dynamic fashion. For example, when using a spreadsheet, they can enter a set of data, quickly generate a variety of graphs based on the data, and then consider which graph is the most appropriate for the data and for the question asked. With technology students can quickly change features, such as range and scale, thus allowing them to see and consider the effect of the change on data representation. Although it is important for students to have experience in drawing graphs by hand, so that they come to understand the features that make up a graph, most people in the real world today use technology to generate graphs. It is important to create opportunities for students to experience the full range of data organization methods, from the concrete to the
visual to the symbolic. Consider the following sequence of classroom activities, designed to help students understand circle graphs:
• Students are organized into groups based on the predominant colour of their shirt. • They form one circle, standing beside
other students in their shirt-colour group (as in Figure 5).
• The teacher stands in the centre of the
Collection and Organization of Data
2
• Ropes are stretched from the teacher to the boundaries between the colour groups. • The teacher explains that together they have formed a physical circle graph.
Another way to develop this concept is to cut square grid paper into strips, taping strips together until there are enough squares to represent all students in the class. Students colour the squares (as in Figure 6) to represent the data. The strip can then be shaped into a circle, which could be used as the basis for drawing a circle graph.
Figure 6. Creating an outline of a circle graph
Likewise, when modelling bar graphs – for instance, of the seasons in which students were born – the teacher could write the names of the seasons across the board and students could line up in front of the appropriate seasons, forming a physical bar graph. Alternatively, students could place a yellow sticky note above the appropriate seasons, forming a bar graph on the board.
Such concrete experiences anchor students’ understanding to the physical world and help add meaning to abstract concepts.
CHARACTERISTICS OF STUDENT LEARNING AND INSTRUCTIONAL STRATEGIES
Students who understand and can solve problems, such as the one in the sample problem on page 20, are able to do the following:
• They can describe the relationship between a question asked and the data collection method used.
• They can describe alternative data collection methods and explain their appropriateness in relation to the question asked.
• They can ask alternative questions and explain their appropriateness in relation to the data collection method used.
• They can demonstrate their familiarity with a variety of data collection methods. • They can identify appropriate methods for organizing the data to be collected.
For students to develop such an understanding, the teacher should use instructional strategies that help them become aware of:
• ways to change the data collection method to better match the question asked; • ways to change the question to better match the data collection method used; • the range of methods that can be used to organize the information collected; • the intended audience for the information collected.
Method 2: Extending the Problem
It is the questions that drive mathematics. Solving problems and making up new ones is the essence of mathematical activity.
(Hersh, 1997, p. 18)
POSING PROBLEMS
Students need a variety of focused activities that will allow them to practise the skills identi-fied in Method 1: Matching Questions With Methods of Data Collection and Organization. However, they also need opportunities to pose their own data management questions and design their own methods of data collection and organization. This goal is reflected in the mathematical process expectations listed for junior students in The Ontario Curriculum, Grades 1–8: Mathematics, 2005 (pp. 65, 77, 87), which state that students will “pose and solve problems and conduct investigations, to help deepen their mathematical understanding”.
Teaching and Learning Mathematics: The Report of the Expert Panel on Mathematics in Grades 4 to 6 in Ontario, 2004 (p. 7) states in addition that “a variety of problem-solving experiences and a balanced array of pedagogical approaches” are necessary for effective mathematics instruc-tion in the junior grades. An essential aspect of an effective mathematics program is balance (Kilpatrick, Swafford, & Findell, 2001).
Engaging in posing problems and solving problems makes the mathematics that students are learning more interesting to them and helps them become better mathematical thinkers. One way to engage students in posing problems is to ask them to work in small groups to:
• design their own questions along the lines of those in Figure 4;
• suggest ways of changing and improving the questions or the methods of data collection and organization;
• share and discuss their ideas with others in the class.
By being personally involved in generating questions and in collecting and organizing data, students have a stake in the learning activity and are more likely to have a meaningful learning experience. The skills they develop will form a solid foundation for their future learning and for real-life experiences involving data management.
Collection and Organization of Data
2
CHARACTERISTICS OF STUDENT LEARNING AND INSTRUCTIONAL STRATEGIES
Extending a problem in more mathematically sophisticated ways requires more in-depth mathematical knowledge from the teacher, who must be flexible and responsive to the (possibly unanticipated) mathematical exploration directions that emerge in a classroom setting. In addition, the teacher needs to use instructional strategies in which:
• students are encouraged to pose and explore “what if” questions related to the concepts and problems being studied;
• students are encouraged to organize their data using a variety of representations and to explore and discuss which representations are most effective;
• students are encouraged to make connections with problems they previously explored and with concepts learned in other strands.
Students who develop problem-solving skills that enable them to explore extensions to data management problems have the following learning characteristics:
• They can pose “what if” questions to extend problems in new mathematical directions. • They are willing to persevere in their mathematical thinking and solve mathematical
problems.
• They can work cooperatively and constructively with others. • They use a variety of empirical methods to test hypotheses.
DAtA rELAtIonshIPs
overview
Students enter the junior grades with experience of and knowledge in reading, describing, and interpreting “primary data presented in charts and graphs, including vertical and horizontal bar graphs” (Ontario Ministry of Education, 2005, p. 63). As they move through the junior grades, they consolidate the following skills:
• dealing with primary and secondary data;
• reading and interpreting data and drawing conclusions;
• using descriptive statistics (range, mean, median, mode) to describe the shape of the data; • comparing two related sets of data using a variety of strategies (tally, stem-and-leaf plot,
double bar graph, broken-line graph, measures of central tendency); • making inferences and convincing arguments.
Example: the Masses of Backpacks
Let’s see how the big idea of “data relationships” could be developed with a variation of the masses of backpacks problem from the Data Relationships expectations for Grade 6 in The Ontario Curriculum, Grades 1–8: Mathematics, 2005 (p. 96).
Sample problem: Use the mean to compare the masses of backpacks of students from two or more Grade 6 classes.
The problem shown above presents students with the opportunity to review and apply descriptive statistics to help them understand a set of data about the masses of backpacks. This problem can be used as the focus for two classes of students who are generating and sharing data to analyse using descriptive statistics and appropriate forms of representation (as in Method 1 on the next page). The problem can also be extended to allow students to ask their own questions and collect and analyse their own data (see Method 2, p. 30).
2
3
4
5
6
7
8
1
2 3
4
5
6
7
8
9
1/2
1/4
1/4
/4
2
3
Data Relationships
2
Method : understanding Data relationships
LEARNING TO INVESTIGATE AND UNDERSTAND DATA RELATIONSHIPS
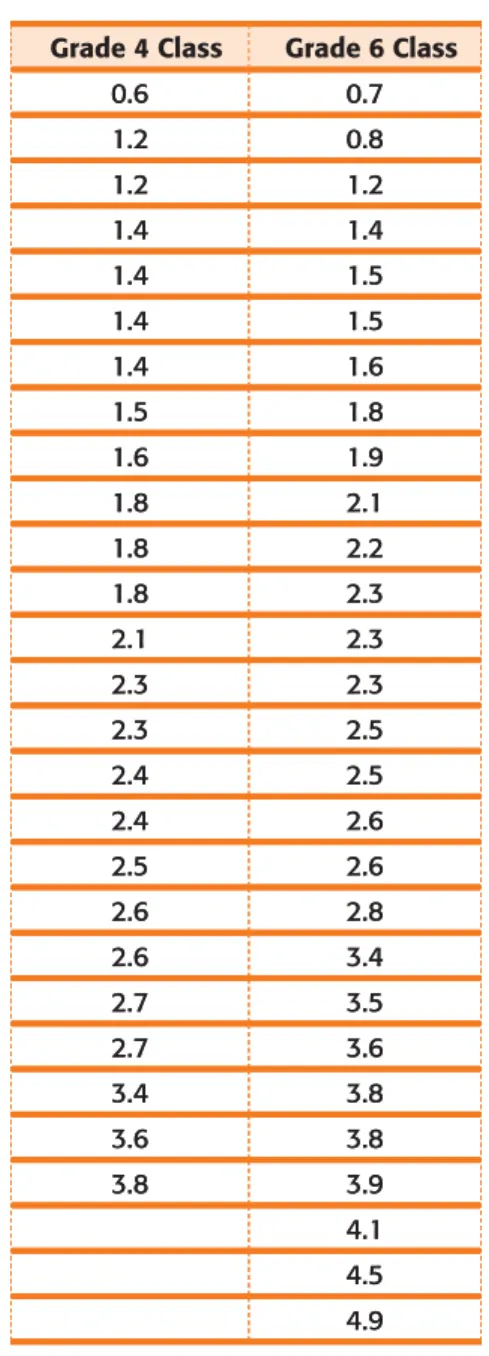
Table 1 shows the masses of student backpacks in two classes. Students can collect their own data on the masses of student backpacks with the help of a common bathroom scale, either by placing each backpack on the scale and noting its mass, or by having a student first step on the scale with a backpack and again without it, then subtracting the second mass from the first.
Table 1. Data: the masses of backpacks
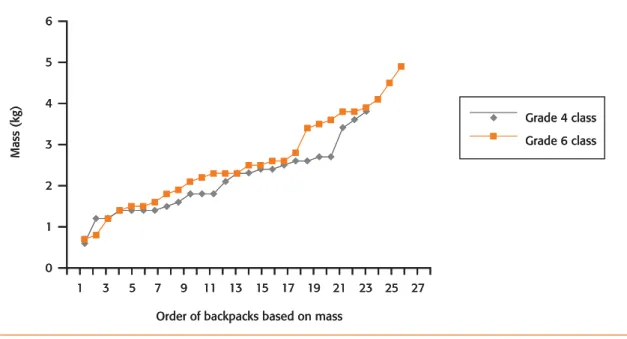
Students can then sort the data in a table or enter them into a spreadsheet and sort them using a built-in sort function, as was done in Table 2. Sorting the data is useful for finding the range, the median, and the mode of the data, and it also gives a sense of the shape of the data.
Using the plotting tools in a spreadsheet, students can create various graphs to display the data, as was done in Figure 7 with a line graph. Early in students’ data-graphing experiences, it is helpful to have them graph data using various forms and then discuss which graphs are most appropriate.
Grade 4 Class Grade 6 Class
0.6 0.7 1.2 0.8 1.2 1.2 1.4 1.4 1.4 1.5 1.4 1.5 1.4 1.6 1.5 1.8 1.6 1.9 1.8 2.1 1.8 2.2 1.8 2.3 2.1 2.3 2.3 2.3 2.3 2.5 2.4 2.5 2.4 2.6 2.5 2.6 2.6 2.8 2.6 3.4 2.7 3.5 2.7 3.6 3.4 3.8 3.6 3.8 3.8 3.9 4.1 4.5 4.9
Grade 4 Class Grade 6 Class
0.6 0.7 1.2 0.8 1.2 1.2 1.4 1.4 1.4 1.5 1.4 1.5 1.4 1.6 1.5 1.8 1.6 1.9 1.8 2.1 1.8 2.2 1.8 2.3 2.1 2.3 2.3 2.3 2.3 2.5 2.4 2.5 2.4 2.6 2.5 2.6 2.6 2.8 2.6 3.4 2.7 3.5 2.7 3.6 3.4 3.8 3.6 3.8 3.8 3.9 4.1 4.5 4.9
Masses of Backpacks (kg)
Grade 4 Class Grade 6 Class
1.2, 2.4, 3.4, 1.4, 1.5, 2.3, 0.6, 2.6, 1.8, 1.8, 2.1, 2.6, 2.4, 1.6, 1.2, 3.6, 2.7, 1.4, 2.3, 1.4, 3.8, 2.5, 2.7, 1.4, 1.8
1.5, 2.3, 4.1, 3.5, 0.8, 1.8, 2.2, 3.8, 2.5, 1.6, 3.8, 2.1, 4.9, 3.9, 2.8, 1.5, 0.7, 2.6, 4.5, 2.3, 3.4, 2.3, 3.6, 1.4, 1.2, 2.6, 1.9, 2.5 Masses of Backpacks (kg)
Grade 4 Class Grade 6 Class
1.2, 2.4, 3.4, 1.4, 1.5, 2.3, 0.6, 2.6, 1.8, 1.8, 2.1, 2.6, 2.4, 1.6, 1.2, 3.6, 2.7, 1.4, 2.3, 1.4, 3.8, 2.5, 2.7, 1.4, 1.8
1.5, 2.3, 4.1, 3.5, 0.8, 1.8, 2.2, 3.8, 2.5, 1.6, 3.8, 2.1, 4.9, 3.9, 2.8, 1.5, 0.7, 2.6, 4.5, 2.3, 3.4, 2.3, 3.6, 1.4, 1.2, 2.6, 1.9, 2.5
Grade 4 Class Grade 6 Class
0.6 0.7 1.2 0.8 1.2 1.2 1.4 1.4 1.4 1.5 1.4 1.5 1.4 1.6 1.5 1.8 1.6 1.9 1.8 2.1 1.8 2.2 1.8 2.3 2.1 2.3 2.3 2.3 2.3 2.5 2.4 2.5 2.4 2.6 2.5 2.6 2.6 2.8 2.6 3.4 2.7 3.5 2.7 3.6 3.4 3.8 3.6 3.8 3.8 3.9 4.1 4.5 4.9
Table 2. The masses of backpacks: sorted data
Grade 4 Class Grade 6 Class
0.6 0.7 1.2 0.8 1.2 1.2 1.4 1.4 1.4 1.5 1.4 1.5 1.4 1.6 1.5 1.8 1.6 1.9 1.8 2.1 1.8 2.2 1.8 2.3 2.1 2.3 2.3 2.3 2.3 2.5 2.4 2.5 2.4 2.6 2.5 2.6 2.6 2.8 2.6 3.4 2.7 3.5 2.7 3.6 3.4 3.8 3.6 3.8 3.8 3.9 4.1 4.5 4.9
Figure 7. The masses of backpacks: sorted data shown as a line graph
Although double line or double bar graphs help students compare the data, a stem-and-leaf plot (as shown in Figure 8) can give a better sense of the shape of the data.
Grade 4 Grade 6
6 0. 7 8
8 8 8 6 5 4 4 4 4 2 2 1. 2 4 5 5 6 8 9
7 7 6 6 5 4 4 3 3 1 2. 1 2 3 3 3 5 5 6 6 8
8 6 4 3. 4 5 6 8 8 9
4. 1 5 9
Figure 8. The masses of backpacks: data shown as a stem-and-leaf plot
Descriptive statistics (as in Table 3) help students to better understand the data. Students need opportunities to calculate such statistics and to think about and discuss which descrip-tive statistic might be useful for the situation. For example, the mode is useful for describing discrete data (such as shoes sizes) but it has little meaning in the case of the masses of backpacks. However, the other measures of central tendency – mean and median – do help to give a sense of the data.
Grade 4 Grade 6
Range 3.2 4.2
Mean 2.1 2.6
Median 2.1 2.4
Mode 1.4 2.3
Table 3. The masses of backpacks: descriptive statistics
0 1 2 3 4 5 6
Grade 4 class Grade 6 class
Mass (kg)
Order of backpacks based on mass
1 3 5 7 9 11 13 15 17 19 21 23 25 27 0
1 2 3 4 5 6
Grade 4 class Grade 6 class
Mass (kg)
Order of backpacks based on mass