Road Asset
Management Plan
2012
Contents
EXECUTIVE SUMMARY ... 5
1.
INTRODUCTION ... 6
1.1 What is asset management ... 6
1.2 Drivers for asset management... 6
1.3 Clackmannanshire Council's Road Asset Management Plan ... 7
1.4 How does this plan fit with the Council's corporate approach to asset management? ... 8
1.5 What are the Council's objectives in relation to the road asset? ... 8
1.6 What time period will the RAMP cover and when will it be updated? ... 9
1.7 Strategic Document Framework ... 9
2.
ASSET DESCRIPTION ... 10
2.1 The Road Asset ... 10
2.2 The Size of the Asset ... 10
2.3 What assets are not covered by this Plan? ... 11
2.4 Asset Growth ... 11
2.5 Complexity and make up? ... 11
2.6 Current Priorities ... 12
3.
COMMUNITY REQUIREMENTS ... 13
3.1 Customer Consultation ... 13
3.2 Results of Consultation ... 13
3.3 Use of Consultation Results ... 15
4.
FUTURE DEMANDS... 16
4.1 Traffic Growth ... 16
4.2 Traffic Composition ... 16
4.3 Statutory Undertakers (Public Utilities) ... 16
4.4 Climate Change ... 17
4.5 Changes in Legislation ... 17
4.6 Local Transport Strategy (LTS) ... 18
4.7 Economic Factors... 18
4.8 Existing Maintenance Backlog ... 18
4.9 Increasing Pressure to Adopt Roads ... 18
4.10 Current Development Planning Practices ... 19
4.11 Increasing public expectations ... 19
4.12 Demands for Additional Assets ... 19
5.
LEVELS OF SERVICE ... 21
5.1 Establishment of Levels of Service (LoS) ... 21
5.3 Targets for Levels of Service ... 22
5.4 How is performance against target levels of service reported. ... 22
5.5 Current & Target Levels of Service ... 22
6.
LIFECYCLE PLANNING (LCP) ... 25
6.1 Purpose of Lifecycle Planning ... 25
6.2 Output from Lifecycle Planning ... 25
6.3 Importance of Lifecycle Plans ... 25
6.4 Lifecycle Plan Contents ... 25
6.5 Status of Lifecycle Plans ... 26
6.6 Asset Group Status Reports (Major Asset Groups) ... 27
7.
FINANCIAL SUMMARY ... 39
7.1 Sources of Funding & Budget Allocation ... 39
7.2 Historical Expenditure ... 40
7.3 Future Funding Requirements ... 42
7.4 Asset Valuation ... 42
8.
RISK MANAGEMENT ... 43
8.1 Corporate Risk Management ... 43
8.2 Risk Identification ... 43
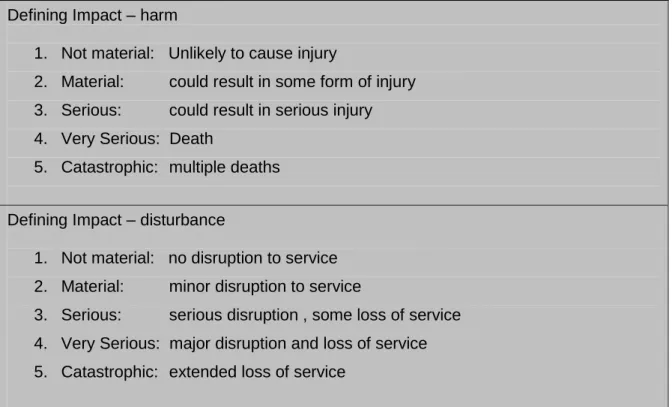
8.3 Risk Evaluation ... 44
8.4 Risk Control ... 45
8.5 Review & Reporting ... 46
8.6 Risk Register ... 46
8.7 Major Asset Risks ... 46
9.
IMPROVEMENT PLAN ... 47
9.1 Milestones ... 47
9.2 Progress Reporting ... 47
9.3 Improvement Actions ... 49
10.
MANAGEMENT & CONTROL OF THE PLAN ... 53
10.1 Introduction ... 53
10.2 Ownership of the RAMP ... 53
10.3 Updating the RAMP ... 54
11. LIST OF APPENDICES
a Communication Plan b Asset Information Plan
c Customer Satisfaction Report (not yet undertaken) d Demand Forecast (not yet undertaken)
e Performance f Lifecycle Plans
g Financial Information h Risk Register
i Assessment of Capability and Improvement Action Plan j Street Lighting Policy Document
k Road Safety Inspections Standards & Procedures l Winter Services - Policy & Procedures
EXECUTIVE SUMMARY
Clackmannanshire has an extensive road asset network with an estimated value of around £0.5 billion. The network includes over 287km of carriageway, 430km of footway & footpath, over 8600 street lighting units and around 118 structures.
These assets have a huge impact on the viability and vitality of the County's economy and way of life. The operation and maintenance of these fundamental assets must support the local area by delivering the required service to road users and by using public money wisely. There is however growing concern that these vital and valuable assets are not receiving the funding required to maintain them to a standard fit for purpose.
Clackmannanshire Council, like all public bodies, is being placed under increasing pressure to justify investment and to demonstrate that best use is being made of resources. We fully appreciate this situation and are taking positive and innovative steps to ensure our management practices are up to the challenge.
This is the second version of our RAMP, set out in accordance with the framework established by the national project through the Society of Chief Officers for Transportation in Scotland (SCOTS). The first version was approved by Council in November 2010.
RAMP2 makes best use of the progressing asset and financial data to further improve the indicative value of the road asset, backlogs, additional funding need and is structured to comply with the requirements of Whole of Government Accounting. The Plan has identified additional milestones to be reached and improvement actions that require to be addressed in order to further develop the application of asset management principles.
RAMP2 confirms the Council's commitment to adopting asset management as a policy and to applying asset management systems for the management of the roads asset.
1.
INTRODUCTION
The road infrastructure is a key and highly visible community asset, supporting the national and local economy and contributing to the character and environment of the areas that it serves. Despite this there is growing concern that the management of this asset is not receiving the attention or funding required to preserve and replenish the network in a sustainable manner.
The purpose of this document is to set out the systematic approach adopted by Clackmannanshire Council for the management of its road asset. Many principles of asset management are already embedded in the policies, processes and practices undertaken within the Service. By formalising this document, this RAMP will provide a central reference document for these policies, processes and practises.
RAMP1 (v1.09) was approved by the Elected Members at the meeting of Clackmannanshire Council on 4 November 2010.
1.1 What is asset management
The County Surveyors Society defines asset management within it's Framework for Highway Asset Management as:
A longer term strategic approach is essential if Clackmannanshire Council is to maximise the long-term benefits of the available resources.
The use of lifecycle planning; the minimisation of whole life costs; and decision making informed by an appreciation of risk and benefit, are key asset management components that will assist in allocating resources for maximum benefit.
The development of levels of service will assist in explicitly taking account of the needs and aspirations of stakeholders and service users.
1.2 Drivers for asset management
Road Authorities exercise their duties to maintain, operate and improve their road assets under increasing pressures that include inadequate budgets, limited resources, mature networks, increased accountability, climate change, carbon reduction and increasing public expectations.
The development process of the RAMP assesses the strengths and weaknesses of our existing systems and methods in managing the road network. The Plan will enable an asset management system to be developed for managing road assets on a long-term basis, delivering better value.
A strategic approach that identifies the optimal allocation of resources for the management, operation, preservation and enhancement of the highway infrastructure to meet the needs of current and future customers
Nationally there is increasing pressure towards the development of an asset management approach. Key drivers include the recommendations specified within the National Road Maintenance Review, Audit Scotland's Report "Maintaining Scotland's Roads" 2004 and the adopted method of Resource Accounting and Budgeting (RAB) required by Whole of Government Accounts (WGA).
To assist with the WGA process, the Chartered Institute of Public Finance & Accountancy (CIPFA) have developed a Transport Infrastructure Assets Code to support an asset management based approach to the provision of financial information about local authority assets. The intention is that each authority should develop a single set of financial management information about these assets which is robust and consistent and supports:-
• good, evidence based, asset management, including the development of more
cost effective maintenance and replacement programmes;
• delivery of efficiency savings and service improvements;
• long term financial planning and budgeting;
• corporate capital planning and the operation of the Prudential Code;
• performance assessment and benchmarking;
• resource allocation, locally, at regional level and nationally;
• production of transparent information for stakeholders on the authority’s
management of its roads assets;
• production of financial information that is compliant with International Financial
Reporting Standards and meets the needs of WGA and National Accounts;
• any future move to current value financial reporting of the assets in local
authorities’ own accounts.
Over the last 12-18 months the SCOTS RAMP project has focused on ensuing that Roads Authorities asset management plans are developed to enable the provision of the financial information as specified within the CIPFA guidance.
1.3 Clackmannanshire Council's Road Asset Management Plan
RAMP2 details the development and application of asset management practices within Roads and Transportation. RAMP1 was developed by undertaking a thorough and rigorous review of current practice. RAMP2 outlines and promotes changes to working practices to support an asset management approach.
RAMP2 provides a further developed programme of asset management improvements within the Service. It develops the quantitative record of what assets are held and their condition, as well as presenting a qualitative record of what data
is missing. By highlighting the risks associated with the management of the Council's road asset, it offers a lever to target additional resources while affording an opportunity to raise the profile of the Service.
Working towards completion of an Action Plan which will allow the Service to work towards the implementation of adopting full asset management practice, is a key aim of RAMP2.
It is important to note that the Service is continuing along a learning curve on it's path to adopting an asset management approach and as such there will still be considerable room for improvement within the organisation (as is common with most other Authorities undertaking this process)
1.4 How does this plan fit with the Council's corporate approach to asset management?
The Council is in the process of developing a Corporate Asset Management Strategy and Plan. Asset management champions from various Services have been nominated and are attending development meetings. This process will assist in ensuring that the Roads and Property Asset Management Plans will relate to each other and be incorporated into a corporate strategy.
1.5 What are the Council's objectives in relation to the road asset?
While not directly referenced within the Single Outcome Agreement (SOA), the
network is key in supporting the majority of the Council’s business objectives.
These objectives are outlined in the planning & policy documents shown below. The SOA indicators and targets, most significant to the Service are:
♦ Indicator 4 reduce the proportion of driver journeys delayed due to traffic congestion
♦ Indicator 28 Increase the percentage of adults who rate their neighbourhood as a good place to live
♦ Indicator 32 reduce overall ecological footprint
♦ Indicator 36 increase the numbers of journeys to work made by public or active transport
♦ Indicator 37 increase the proportion of adults making one or more visits to the outdoors per week
♦ Indicator 42 improve public sector efficiency through the generation of 2% cash releasing efficiency savings per annum
♦ Indicator 43 improve people’s perceptions of the quality of public services delivered
The Council is also the Roads Authority and has a duty under the Roads (Scotland) Act 1984 to manage the publicly maintained road network, ensuring it is kept in a safe condition for all road users and to take such steps as it considers reasonable to prevent snow and ice endangering road users.
1.6 What time period will the RAMP cover and when will it be updated?
RAMP2 will cover the period 2012 - 2013. It is expected that the plan will be updated annually until 2014. It is expected that the RAMP will then be developed to an extent that the updating frequency may be reviewed and potentially extended to a three year cycle.
1.7 Strategic Document Framework
Community Plan Single Outcome Agreement Corporate Plan Local Transport Strategy Community & Regulatory
Services Business Plan
Road Asset Management Plan
Individual Service Policies & Procedures
Regional Transport Strategy Corporate Asset Management Plan National Transport Strategy Scottish Government Strategic Objectives External Corporate Risk Strategy
National Legislation & Guidance
Roads & Transportation Business Plan
2.
ASSET DESCRIPTION
2.1 The Road Asset
The road network is the most highly valued physical asset, both in financial and community terms, for which authorities are responsible. It is key in supporting nearly all of the Council’s business objectives. This second version of the RAMP is focused on the following asset groups;
● Carriageways
(including drainage costs)
● Other Paved Areas (footways, footpaths, cycleways & car parks)
● Structures ● Street Lighting
● Traffic Management Systems (Traffic & pedestrian signals)
● Street Furniture (non-lit signs, safety fences, barriers, bollards & bus shelters
Further information on the elements contained (or not) within these asset groups are provided in the lifecycle plans in Appendix f. These groups are developed in accordance with CIPFA guidance.
2.2 The Size of the Asset
The Council's adopted road network currently consists of the following recorded data (figures correct at June 2012);
● 287 km of road carriageway ● 16 car parks
● 699,050 sqm of footways (approximately 388km)
● 104,100 sqm of remote footpaths (approximately 42km)
● 8602 street lights ● 390 illuminated signs
● 2 sets of traffic signals ● 77 lit bollards
● 49 no. bridges
(inc 9 in shared ownership)
● 75 no. culverts (inc 4 shared ownership) ● 9 no. footbridges
Data analysis has been undertaken on each of these major asset groups as part of this project. The result of this analysis is shown within the Core Data tables in Appendix b.
The confidence in the quantities of the data shown above is very high although there are numerous gaps in data coverage (for example we are aware where all of our footways are located, but are unsure of the date that maintenance works were last carried out on each section). Details of data required to be captured in order for the asset management process to be implemented is contained within the Improvement Plan in Appendix i.
2.3 What assets are not covered by this Plan?
The initial plan does not include data outwith the major asset groups listed above. Assets excluded at present include drainage, traffic calming schemes, road markings and road studs. In addition the RAMP only looks at Council assets maintained by Roads & Transportation. Private roads or carriageways, footpaths, cycleways and car parks maintained by other Services (such as housing / education) are not included.
2.4 Asset Growth
The following table highlights recent change in each of the major asset groups;
Asset Type Period Change in Total % Change % Change Per
Annum
Carriageways 1999-2012 + 29.6 km + 11.5% + 0.89%
Footways 1999-2012 +73,565 sqm + 11.8% + 0.91%
Footpaths 1999-2012 + 6,795 sqm + 7.0% + 0.54%
Street Lighting 2005-2011 + 927 columns +11.9% +1.70%
Bridges 2004-2011 +2 bridges +5.0% +0.71%
With regards to the carriageway and footway assets, the majority of growth is due to new residential developments. However some routes have been constructed for transport improvements undertaken due to increased traffic demand (schemes such as the B9140 Tullibody Bypass and the B909 Alloa Eastern Link Road). New legislation and policy accounts for a significant percentage of growth within the footpath and street lighting assets. The political desire for safer walking and cycling routes is a key factor in asset growth (note the above figures do not include remote cycleways as these are not currently on the List of Roads).
Specific schemes which will result in asset growth in the near future may include the development of the new settlement at Forestmill and the demand for more sustainable transportation services leading to more need to cater for pedestrians and cyclists.
2.5 Complexity and make up?
The desire for the increased usage of higher quality materials, such as better lighting or granite setts in high amenity areas, increases maintenance costs and complexity. New planning policies (Designing Streets) which pursue the development of innovative sustainable urban design, utilising alternative materials and focusing on non-standard road layouts will further complicate maintenance schemes in the future.
The growth in traffic calming measures is having a significant effect on maintenance resources due to it's detrimental effect on the carriageway lifespan.
Replacement costs for these traffic calming features, together with the difficulties they present to the contractors carrying out works, including winter maintenance, further increases the unit cost rates.
Other factors that will create a significantly increased future maintenance need include the use of high friction surfaces at pedestrian crossings / traffic lights, which require more frequent renewal than traditional surfaces, and the legislative need for sustainable urban drainage systems (SUDS) in new developments.
2.6 Current Priorities
The Service is currently working to the following priorities for investment on the roads infrastructure:-
Roads
● Treating defects which carry a risk to life & limb.
● Surfacing of the busiest strategic roads highlighted by SRMCS. Footways & Footpaths
● Treating defects which carry a risk to pedestrians. ● Upgrading concrete slabbed footways to blacktop.
● Resurfacing the most heavily used footways (in need of repair). Structures
● Ensuring bridges on the strategic road network are capable of carrying the necessary vehicle loading.
Street Lighting
● Replacement of columns which have failed electrical or structural testing ● Replacement of older columns on safety grounds.
● Improvement in lighting levels to current standards.
While these priorities may (or may not) change through the development of asset management practice, the Service also has to remain able to be event driven, coping with emergencies and urgent works when the need arises.
Recent examples include such events as the severe winters of 2009/10 and 2010/11, numerous flooding incidents (notably in Tillicoultry and Menstrie) and the failure of a couple of large retaining walls in Sauchie. These all had a significant effect on both physical and monetary resources.
Effective asset management can limit the effects of these events but obviously cannot eliminate them. Our challenge is that we are most successful when invisible but most noticeable when there are disruptions.
3.
COMMUNITY REQUIREMENTS
3.1 Customer Consultation
The Service assesses information obtained from a wide variety of Council sources, but predominately those listed below;
● Local Transport Strategy (LTS) consultation
● representation on business groups
● Community Councils ● councillor enquiries
● call centre queries / complaints ● residents associations
● citizens panel survey (Clacks 1000) ● disability groups
There has not been a specific road related customer satisfaction survey carried out in Clackmannanshire in recent years. There were a number of questions included within the LTS consultation in 2005 and 2009, as to the public's satisfaction towards the condition of sections of the road asset. However these surveys / consultations were not designed to contain specific questions that could be used to influence the Service Standards adopted.
Scheme specific consultation is normally undertaken prior to the implementation of traffic calming schemes to ensure all residents are satisfied with the proposals prior to implementation. There is no real need to consult where we plan to carry out maintenance work, with the
exception of leaflet dropping affected residents to raise awareness of temporary disruption / inconvenience. Historically post scheme surveys have rarely been undertaken for
these or any other form of
maintenance or improvement
schemes. However from June 2011 the Service has introduced post
scheme surveys (for works in
residential areas), seeking customer feedback.
3.2 Results of Consultation
The responses from the LTS survey only allow the Service to define the percentage of respondents satisfied with particular aspects of the network. The results of the 2005 and 2009 surveys are detailed below.
Unfortunately the differing response formats of the two questionnaires means that the results are not directly comparable. These surveys are also subject to potential issues such as flawed questions or dubious samples. For example, many residents
may be reporting about the condition of the footway outside their own home and the level of winter service provided at this locus. While a further study may indeed prove that the majority of the population would prefer more resources to be used on such treatment, this information can not be reliably extracted from existing surveys.
2005 Asset Group Good 2009 Asset Group Good Adequate
or good
Carriageway Condition 36% Carriageway Condition 13% 66% Footways / paths
Condition
44% Footways / paths Condition
18% 73%
Winter Maintenance C/way 63% Winter Maintenance
(c/w & f/w) 49%
Winter Maintenance F/way 37%
Street Lighting Provision 75% Street Lighting Provision 36% 90% Roads Safe to Drive 70% Roads Safe to Drive 77%
Roads Safe to Walk / Cycle
40% Roads Safe to Walk / Cycle
50%
As part of this project this Service will undertake further public opinion surveys to obtain information that can be used to fine tune our Service Standards.
The initial results of the scheme specific customer surveys are as follows:-
Location Number Returned % Returned % Satisfied General Comments
Norwood Avenue, Alloa 25 64 96 Happy with works done West Johnstone Street,
Alva 12 32 100
Happy with works done
Fairfield Road, Sauchie 9 31 56 Happy with c/way work but complaints about drainage
Collyland / Pitfairn Rd,
Fishcross 21 37 100
Happy with c/way work but would like f/way done also
Cairnpark Street, Dollar 15 58 73 All happy with c/way works, complaints about lining
Claremont, Alloa 4 11 75 All happy, bar one who was not notified with letter
The Council's Contact Centre deal with customer complaints and queries on a daily basis. These are recorded and transferred to the Roads & Street Lighting Section. The number of calls taken annually by the Contact Centre over the past 6 years, directly relating to these asset groups are shown in the table below;
[In addition to calls, in 2010/11 the Service received 93 winter maintenance requests and 33 grit bin requests through the [email protected] email address. Many other requests are received by email and passed to staff for action but these are not presently quantified.]
Year C'way F'way Grit Bins Winter Maintenance Street Lighting Total (all assets) 2006-07 359 265 55 29 1135 2271 2007-08 278 177 18 34 1307 2219 2008-09 320 174 101 57 936 1982 2009-10 322 210 377 330 736 2396 2010-11 440 155 417 801 935 3017 2011-12 542 157 104 36 1002 2145
The software application used to record customer enquiries is not currently being fully utilised. This has been identified as an improvement action within this Plan, to ensure all information held within the Council is used to it's maximum potential.
Customer Enquiries (calls only)
0 200 400 600 800 1000 1200 1400 2006-07 2007-08 2008-09 2009-10 2010-11 2011-12 Year C a ll s C/w F/w Winter Related Lighting
3.3 Use of Consultation Results
Customer information is used in certain circumstances to assist in determining programmes of works but not to the level of influencing general spending priorities, due to the lack of detailed information described above.
The majority of traffic calming schemes are already designed using feedback received from consultation with residents. Similarly high volumes of customer queries or complaints may generate smaller carriageway or footway patching works. However these currently tend to generate reactive works rather than form part of a longer term maintenance programme, although any relationships with work undertaken in the past has not been documented.
One of the targets for RAMP2 will be to incorporate customer feedback into the targets which are developed to measure levels of service provided.
4.
FUTURE DEMANDS
Clackmannanshire's transport needs have historically increased in line with economic expansion, increased vehicle ownership / use and population growth. This continued growth is placing additional demands on the network infrastructure required to support the County. The various physical, political and legislative factors which will have most affect of future operational costs and management are detailed below.
4.1 Traffic Growth
Increasing car ownership levels combined with the increasing population and a greater demand for travel are resulting in higher levels of traffic on our roads. This creates need for road improvement schemes and additionally produces demand for parking, which is particularly significant in both commercial and older residential areas. Resources will be required to meet traffic reduction targets set within the Local Transport Strategy (LTS).
4.2 Traffic Composition
Increase in HGV traffic on routes which were not designed for such usage reduces the asset lifespan, thereby further increasing overall maintenance costs. While most of the HGV traffic occurs on the principle routes, there are a number of unclassified routes already subject to a significant volume of HGV's. This may require investigation in the near future.
Increasing numbers of privately owned vehicles generating higher numbers of single occupancy trips, the construction of the Clackmannanshire Bridge and the reopening of SAK railway have also significantly affected traffic composition. The Road Traffic Reduction Report within the LTS contains detailed information on traffic flow and growth levels within the area.
4.3 Statutory Undertakers (Public Utilities)
Utility works have a detrimental affect on asset lifespan and the area has been subjected to major utility mains replacement schemes during recent years. The customer driven nature of the public utility networks mean major replacement / upgrading schemes may be brought forward unexpectedly, at relatively short notice. Despite regular coordination being undertaken, it is not always possible to ensure utility works are carried out prior to road maintenance schemes.
Like many other organisations within the current economic climate, the Statutory Undertakers (SU's) are continually investigating methods of introducing efficiencies. These efficiencies often lead to a reduction in standards which are not conducive to this Service's aim of maximising the lifespan of the existing road network. Therefore monitoring their operations and inspecting any works they undertake will become an increasingly important and resource intensive operation.
As an outcome of Transport Scotland's National Road Maintenance Review, there will be further study into the long term damage that utility works may cause to the road network. If evidence is found, the SU's may be required to contribute to future network maintenance costs.
4.4 Climate Change
Commitment to reduce our carbon footprint may result in increased short term investment. For example higher quality, more efficient materials and equipment. Also increasing precipitation, intensity and extremes of weather will require increased investment in drainage and flood prevention schemes as well as a review of our winter service provision.
While the Service is actively seeking to encourage the use of recycled materials, maintenance carried out using these materials may often be less cost effective than when utilising virgin materials. Similarly cost effectiveness of 'sustainable materials' over the long term is still to be fully assessed.
There is no specific target for carbon reduction within Roads & Transportation although the Service contributes to the Council's overall emissions and reduction targets. In recent years this Service has been refurbishing / replacing the lighting stock to reduce CO2 output, but these reductions have been largely nullified by the growth in lighting stock.
4.5 Changes in Legislation
There are a number of legislative changes introduced within the last few years which impact considerably on Service delivery. Examples of such legislation include:-
● Transport (Scotland) Act 2005
Extended requirement for Roads Authorities (RA's) to enter information
into the Scottish Road Works Register
Additional requirements to use best endeavours to coordinate the execution of all works affecting roads for which the RA is responsible ● Flood Risk Management (Scotland) Act 2009
A framework for coordination and cooperation between all organisations involved in flood risk management
Assessment of flood risk and preparation of flood risk management plans New responsibilities for SEPA, Scottish Water and local authorities in relation to flood risk management
A revised, streamlined process for flood protection schemes
New methods to enable stakeholders and the public to contribute to managing flood risk
● Water Services (Scotland) Act 2003
Introduction of Sustainable Urban Drainage Systems (SUDS)
The Disability Discrimination Act 1995 continues to have significant implications on our resources. Many of our older assets require to be upgraded during routine maintenance in order to meet the requirements of this Act.
Further pressures may arise from initiatives such as the Scottish Government's 2010-2020 vision for a steady reduction in the numbers of those killed and seriously injured, with the ultimate vision of a future where no one is killed on Scotland's roads, and where the injury rate is much reduced.
4.6 Local Transport Strategy (LTS)
The overall transport vision of the LTS is to facilitate the free movement of people and goods within Clackmannanshire by a choice of modes that are safe, accessible and well integrated. The LTS hopes to achieve this by promoting active and sustainable travel, focusing on the five main key targets set out by the Scottish Government of improving the economy, the environment, safety, accessibility and integration. The LTS links many of the other factors within this section.
4.7 Economic Factors
The road asset continues to grow while the current economic climate is dictating that local government reduce spending. This issue is exacerbated by high construction inflation costs and spiraling energy costs.
Focus must be placed on procurement and efficiency savings. The correct balance between quality and price and more importantly the difference between price and cost must be conveyed. Performance must be driven by outcomes and not inputs. Similarly a reduction in spending is not a means to efficiency.
4.8 Existing Maintenance Backlog
A historical lack of maintenance on ageing assets has resulted in the network being in a substandard condition. This backlog requires to be addressed as the overall network condition continues to deteriorate. In recent years resources have been focused on maintaining strategic routes. The condition of the unclassified network is now causing concern.
4.9 Increasing Pressure to Adopt Roads
There is political and stakeholder pressure to adopt a number of historically private roads within the area. There is a possibility that responsibility for all roads and footways that are currently maintained by other Services (Housing / Property / Education), will be transferred to Roads & Transportation. This is not feasible given the current level of resources.
4.10 Current Development Planning Practices
Continual political and economic pressure for development in the area continues to result in additional infrastructure requirements. New UK planning guidance (Designing Streets) advocates non-standard sustainable design for new developments. The desired use of alternative materials and variability of such prospective road layouts will exacerbate future maintenance issues.
Government funding for regeneration schemes & sustainable transport initiatives (SUSTRANS) in many existing areas of the County is providing both new and additional infrastructure. While this occasionally assists with reducing the current maintenance deficit, no resources are provided to cover the future maintenance of additional assets.
4.11 Increasing public expectations
There is increased expectancy for high quality networks to be provided for all modes of travel (private car, public transport infrastructure, cycle networks, footpath routes) and for these networks to be available throughout the year, irrespective of the demands of maintenance or the weather.
4.12 Demands for Additional Assets
New assets required by political, stakeholder or legislative need are outlined within the LTS. Those demands within the major asset groups which will significantly affect future costs within the lifecycle of this Plan are outlined below.
Carriageways • Stakeholder demand for
improvement in priority routes -
- A91 (Tillicoultry to Dollar) - B9140 (Collyland to Fishcross) • Trader demand for on-street
parking in rural village centres • Residents demands for safer
neighbourhoods
- Alva, Dollar, Sauchie
- Traffic calming schemes to
improve safety in residential areas • General demand for network
availability
- Treatment of snow and ice
Footways / Footpaths & Cycleways
• Political & stakeholder desire for increased sustainable methods of travel
• General demand for network availability
- New footpath links providing safer routes to schools etc
- Alva to Tillicoultry shared use path
- Treatment of snow and ice (including new cycleways)
Street Lighting
• Council health & safety obligations
- Replace concrete and ageing steel columns with improved units while increasing lighting levels
• Carbon footprint reduction - Introduce energy efficient units on a rolling basis, new schemes to use smart systems offering greater control of lighting levels and usage
Drainage • Legislative need for SUDS in new developments
- Service required to adopt & maintain schemes once developed
5.
LEVELS OF SERVICE
Defined levels of service are used to develop asset management strategies to deliver the required level of service and measure performance against defined targets.
5.1 Establishment of Levels of Service (LoS)
The establishment of LoS should follow a three step process:- ● establish the desired LoS,
● estimate costs,
● bid for funding on this basis.
Traditionally services have been provided using the reverse method - the asset management process will develop to avoid this. Emphasis will be placed on defining methods that are clear, meaningful and can be monitored. Therefore Levels of Service will become more robust as the RAMP matures, with an objective of becoming more stakeholder driven through the consultation process. Through the historical management of the asset, this Service has a collection of acknowledged service levels which are outlined in Table 5.1. These will be used as a base to define and develop formal LoS.
An annual update of the long term forecast of cost and LOS will be incorporated into the next version of this RAMP.
5.2 Measurement of Levels of Service (LoS)
Performance measures provide a basis on which to assess the success or otherwise of the implementation of LoS. Each measure has an associated reason, or reasons, for inclusion, such as statutory requirement, Council policy or customer expectation.
Historically the Service had to supply performance indicators through statute, until the Accounts Commission's review in 2009 eliminated the requirement for all bar one statutory indicator to be recorded.
A suite of Performance Indicators (PI's) are under development through the SCOTS Road Asset Management Project in conjunction with APSE Performance Networks. These PI's will be adopted by this Service, where appropriate, and used to measure performance against stated LOS through internal targets and for benchmarking.
In the past, non-statutory indicators have only been recorded where information was known to be available. LoS developed within this Plan may require alterations to working methods for some members of staff.
5.3 Targets for Levels of Service
The Service sets annual targets and strives for continuous improvement. These targets are measured against how the Service actually performs, which is recorded and reported through the PI's.
While targets have to be challenging, they also have to be realistic and attainable. A balance between spend and performance has to be obtained. In the near future it is likely that target levels may drop due to what is achievable given the current economic climate, notwithstanding enhancements in efficiencies.
As the RAMP develops, customer consultation will assist in remodelling targets and focusing resources more in accordance with stakeholder desire.
5.4 How is performance against target levels of service reported.
In 2011 the Council introduced new performance reporting arrangements using the Covalent application. This application will assist in providing reports to the senior management team, Elected Members and provide publicly reported information on strategic projects from Service Improvement Plans, Risk Management and Performance Indicators for a range of key Council services.
The Service is working towards ensuring that all PI's are recorded and reported through Covalent. Targets will also be maintained within this application as they are developed for each LOS.
This will allow performance to be evaluated with reasons for variance noted if applicable. The process will then restart and targets further developed based on the LOS required for the following financial year.
5.5 Current & Target Levels of Service
Performance measures are shown alongside the corresponding LOS in Table 5.1 and performance information is fully detailed in Appendix e.
The Roads & Transportation section is encapsulated within Community & Regulatory Services, hence the Service Business Plan only incorporates high level PI information. All LOS data will be published annually within the RAMP, in addition to being available in Covalent.
more cohesive approach to PI's.) Carriageway
and Footways
Network Condition Roads (Scotland) Act (RSA) CoP Well Maintained
Highway (CoPWMH)
Maintain condition of carriageway and footways / footpaths at current levels
SCOTS PI 40 SCOTS PI 44 SCOTS PI 47 SCOTS APSE Covalent
There are additional stats within the SCOTS Performance Framework detailing further information on the LoS achieved
Repair of Defects (pothole / missing ironwork, road markings etc).
RSA CoPWMH
Specified within the Service's 'Road Safety Inspection Standards & Procedures'
SCOTS PI 37 SCOTS PI 03b SCOTS PI 45 SCOTS APSE Covalent Safety Inspection of Road
Network
RSA CoP WMH
Specified within the Service's 'Road Safety Inspection Standards & Procedures'
SCOTS PI 39 SCOTS PI 46
SCOTS APSE Covalent Winter Maintenance RSA
CoPWMH
Specified within 'Winter Service for Roads & Footways - Policy & Procedures Document'
SCOTS PI 43 SCOTS PI 50
SCOTS APSE Covalent
There are additional stats within the SCOTS Performance Framework
Coordination of Road Works
New Roads & Street Works Act
Transport (Scotland) Act
Statutory function outlined within NRWSA Codes of Practice
SRWC KPI's SRWC CEO
Scottish Road Works Commissioner (SRWC) provides CEO with annual performance report
Construction of New Carriageways and Footways
RSA New development infrastructure constructed in accordance with "Development Roads Guidelines and Specification" through the Roads Construction Consent Process
Difficult to define due to external variables
Service inspection procedures for officers but only key steps currently undertaken due to resourcing issues Emergency Response to
Incidents
RSA CoPWMH
Civic Contingencies Act
At operational level the council responds to
incidents at the request of the emergency services or public within a set timescale.
SCOTS PI 03b SCOTS PI 45
SCOTS APSE Covalent
SCOTS PI's include Cat 1 defects reported by stakeholders. Further investigation required on reporting response to major events.
Accident location Investigation
Section 39 Road Traffic Act 1988
Monitor & record injury accident data in accordance with "Scotland's Road Safety Framework 2020"
Covalent RAT 11, 13, 14, 15, 16
Covalent Scot Gov
Information provided for "Reported Road Casualties 2010"
Skid Resistance Testing CoPWMH The Service plans to develop a Skid resistance Strategy starting end of 2012
Requires further development
Verge/ Grassed Areas
Cutting frequency RSA CoPWMH
Will be incorporated into Drainage Lifecycle Plan. (Verges cut twice per annum. Visibility splays cut more frequently if required)
To be developed
Budget held by Land Services Contracts
Street Lights
Repairs & Defects RSA
CoP Well Lit Highways
Specified within "Street Lighting Policy" document SCOTS PI 02 SCOTS PI 03 SCOTS PI 35
SCOTS APSE Covalent
There are additional stats within the SCOTS Performance Framework
Electrical Testing RSA
CoP Well Lit Highways
Specified within "Street Lighting Policy" document APSE 38.1 Roads Manager
Inspection regime implemented late 2011/12
Structural Testing RSA
CoP Well Lit Highways
Specified within "Street Lighting Policy" document APSE 38.2 Roads Manager
Inspection regime implemented early 2012/13
Electricity Consumption of Street Lights (and lit signs / bollards)
RSA
CoP Well Lit Highways
Specified within "Street Lighting Policy" document SCOTS PI 18b Covalent RAT08
SCOTS APSE Covalent Drainage Cleansing of Gullies RSA
CoPWMH
Will be incorporated into drainage lifecycle plan. (All gullies are scheduled to be cleaned on a cyclic basis of twice p.a.)
To be developed
Requires amended working practices
Drainage / Flooding
Watercourse Maintenance Flood Prevention & Land Drainage (Scotland) Act
Specified within "Flood Prevention and Land Drainage Biennial Report".
To be developed
Traffic Signals
Repair of Defects RSA CoPWMH
Specified within "Traffic Signs Maintenance Contract - Consortium SLA". (Siemens)
Covalent RAT 06
Covalent Used to be SPI but no longer recorded nationally
Bridges Principle Inspections RSA
CoP Management of Structures
"Bridge Inspection & Management SLA" - between Clacks & Falkirk Council
Also Structures Lifecycle Plan
SCOTS PI 300 SCOTS APSE Covalent Bridge Condition Inspections RSA CoP Management of Structures
"Bridge Inspection & Management SLA" - between Clacks & Falkirk Council
Also Structures Lifecycle Plan
SCOTS PI 301 SCOTS APSE Covalent Bridge Capacity RSA
CoP Management of Structures
"Bridge Inspection & Management SLA" - between Clacks & Falkirk Council
Also Structures Lifecycle Plan
SCOTS PI 302 SCOTS PI 303 SCOTS PI 304 SCOTS PI 305 SCOTS APSE Covalent Customer Services Response to correspondence Customer Service Excellence
Corporate Customer Charter SCOTS PI 37 SCOTS APSE Covalent
Does not include emails / telephone call responses. Requires procedural changes & / or IDOX reporting.
6.1 Purpose of Lifecycle Planning
As part of the development of this Plan we have created lifecycle plans to document how each of the asset groups that make up our road infrastructure is managed. Each lifecycle plan provides definition of the standards that are applied to the management of the asset group in question and details of the processes that are used to ensure that these standards are delivered.
Production and updating of the lifecycle plans is also enabling local knowledge to be captured. Documenting the LCP's allows us to capture the knowledge of individuals, to record this and enable it to be shared and developed.
6.2 Output from Lifecycle Planning
The output from the lifecycle planning process is long term prediction of the cost of the continued management and operation of the asset in question. These should be in the form of financial projections and be linked to target levels of service. Financial projections have been partially developed for certain assets (street lighting & traffic signals) but require further work.
6.3 Importance of Lifecycle Plans
Lifecycle plans are the core of our approach to road asset management planning. They contain the detail that enables asset management practices, such as long term cost projection, performance management and risk management, to be applied consistently across all asset groups.
6.4 Lifecycle Plan Contents
Lifecycle plans are being updated as we gather and analyse information on each asset group. When fully populated each LCP will contain the following information.
Section Answers Contains
The asset What assets do the council own?
- inventory details (type, size, etc) - Asset growth statistics
Service expectations
What each asset group is required to do?
- Customer expectations
- Council objectives for transport - Specific user requirements - Safety considerations - 3rd party use
- Environmental requirements - Network availability
- Amenity considerations Management
practices
How is this asset group managed?
- Policies
- Inspection Regime - Condition Assessment - Asset acquisition standards - Routine maintenance standards - Operations / cyclic maintenance - Planned maintenance standards - Disposal standards
Investment How much should be and is spent on this asset group?
- Historical Investment
- Output from historical investment - Forecast financial needs
- Valuation : GRC, DRC & ADC Works
programme
How are works programmed for this asset group?
- Existing forward works programme 3yr - Works programme coordination
- Option appraisal treatment selection - at a project level
- at a budget category level Risk What are the risks associated
with this asset group?
- Risk identification - Major risk assessment Works &
service delivery
How are works delivered or procured on this asset group?
-
Performance measurement
How is the performance of this asset group measured & managed?
- Performance indicators - Current performance figures - Target performance figures Strategies What strategies exist for the
future management of this asset group?
- Street lighting policy - Winter service policy - Safety inspection policy Service
improvement actions
What changes would improve the council's management of this asset group?
- Asset specific improvement actions
6.5 Status of Lifecycle Plans
Separate LCP's have been produced for each of the following asset groups and are currently in the state of development noted. (Percentages obtained using tool provided for SCOTS RAMP project).
Asset Group Status Actions
Carriageways 65% Identifies need for additional information &
changes to current practice
Other Paved Areas 64% Identifies need for additional information &
changes to current practice Bridges &
Structures
68% Identifies need for additional information &
changes to current practice
Street Lighting 70% Identifies need for additional information &
changes to current practice Drainage
6.6 Asset Group Status Reports (Major Asset Groups)
The current status of the major asset groups that make up the road asset as at September 2012 are summarised in the tables overleaf.
Please note that the historical financial information included below, has not been adjusted for inflation, which has resulted in significant reductions to the output generated from investment in recent years. Asset growth should also be considered while examining this historical investment.
Asset Group: CARRIAGEWAYS Summary Table Statistics Commentary T he A s s et
Road Class Urban Rural Total % of Network
Principle A 20.4 28.9 49.3 17.1 B 11.6 22.7 34.3 11.9 C 15.6 12.5 28.1 9.8 Unclassified 161.4 14.2 175.6 61.2
Total 205.3 79.3 287.3 100.0
The network has grown by 29.6km (11.5%) over the last 13 years. The classified network alone has increased by 4.2km (3.9%) during this period. Cus tom er E x pe c tati on s 0% 10% 20% 30% 40% 50% 60% 70% 80% 90% 100% Go o d Ro ad Co nditio n Go o d Winter M aintenance Inco nvenienced by Ro adwo rks Inco nvenienced by P ublic Utilities Is Co ngestio n A M ajo r Issue no opinion no yes
There is a relatively high percentage of dissatisfied residents in the majority of categories. The results shown are from the LTS survey in 2006. Further investigation has shown that the questionnaire wording can have a significant effect on the results (see Lifecycle Plan).
A more detailed survey is required.
Cond
iti
on
Key - Red: Repairs should be considered Amber: Further investigation is required Green: In an acceptable condition
0% 20% 40% 60% 80% 100%
A Class B Class C Class Unclassed ALL
The method of calculating the road condition indicator (from the Scottish Road Maintenance Condition Survey (SRMCS)) has changed a number of times since 2004, making it unrealistic to undertake a comparison of historical results. This data is taken from a sample of the network and factored up.
Hi s tori c a l In v es tme nt 0 200 400 600 800 1000 1200 2006/07 2007/08 2008/09 2009/10 2010/11 2011/12 C o s t (0 ,0 0 0 s )
Planned Reactive Routine Winter Improvements
Planned works include reconstruction, overlays and resurfacing (capital & revenue)
Reactive works are emergencies / urgent. Routine works are day to day repairs (minor potholes & patching). Improvements are capital works providing new infrastructure (junctions, roundabouts etc)
P la nn ed Fut ure I nv es tme n
t While a long term investment strategy for this asset has not yet been developed, a
study commissioned by the Society of Chief Officers in Scotland (SCOTS) predicted that an annual maintenance budget of £1.6million (Apr 2010) is required to maintain our network in a steady state condition. The expenditure in 2011/12, on works which added long term value to the network was around £1.2 million. Continuing investment at current levels will see the RCI (the proportion of the network requiring treatment or investigation) increasing to around 40% within 20 years. F orw ard W ork s P rog ra mm e
A 12 month rolling programme is maintained by the Service. This incorporates resurfacing and overlay schemes. Levels of funding for maintenance works (both planned and reactive) will be as 2011/12 levels.
Over the next 3 years there is £3.1 million capital investment planned for improvement and reconstruction works on this asset group.
Priorities:-
1. Treating defects which carry a risk to life and limb
2. Repairing areas identified by safety inspections / service request (if appropriate) 3. Resurfacing of more heavily trafficked strategic roads highlighted by the SRMCS
Current Issues
The SRMCS indicates that approximately 6.6% (18.7km) of the public roads within Clackmannanshire should be immediately considered for repair. Furthermore another 29.8% (85km) requires further investigation or monitoring.
Only 10% of the unclassified network is surveyed each year but the condition of roads in residential areas is attracting increasing concern. Output from the Safety Inspection regime results in significant resources being consumed repairing safety related defects (non-dangerous) on the non-priority network.
Over the last few years, resources have been successfully focused on maintaining the condition of the classified network after the damage caused by the severe winters in 2009/10 & 2010/11. However the unclassified network is now showing significant signs of deterioration.
Maintenance costs and the network size and complexity (traffic calming, anti skid surfaces, etc) are increasing. Clearly this situation is not sustainable.
Current Strategies
A five year capital programme of resurfacing, surface dressing and improvement works commenced in 2010/11, designed to improve the condition of the carriageway network to the value of the capital allocated by the Council.
The Service is striving to implement a proactive methodology towards road maintenance (e.g. surface dressings, thin surfacing). However the constant erosion of funding levels (particularly in real terms), combined with increased usage and adverse weather (ice, snow & flooding), is hindering this strategy and inducing a more reactive approach.
The Service works with Falkirk & Stirling Councils on procurement and have developed a joint framework contract which ensures that we have access to competitive contractor rates and provides the ability to benchmark our own schedule rates.
Roads Contracts have undertaken a trail of relatively new equipment that thermally repairs potholes in an efficient and sustainable manner. This technique allows quick permanent repairs to be undertaken, reducing the need for temporary patching and reducing the chances of repeat failure (as this method leaves no joints). Currently there is one of these units in full time operation (weather permitting). There is demand for at least one additional unit but staff resource and attendance levels mean this is not feasible at the current time.
Asset Group: OTHER PAVED AREAS Summary Table Statistics Commentary T he A s s et
Type Total Type Total
Footway Class Km Footpath 51km A 57.2 B 32.6 Cycleway 18.2km C 28.7 U 270.5 Car Parks 21,600sqm (16 No.) Total 389.0
The footway network has grown by 9% over the last 10 years (around 32.5km).
The footpath network has increased by around 5.4% (2.7km) during this period. Note:- These lengths have been estimated but taken from accurate area (polygon) data Cus tom er E x pe c tati on s 0% 10% 20% 30% 40% 50% 60% 70% 80% 90% 100%
Footw ay Condition Cyclepath Condition Easy to Park
Good Adequate Poor
0% 20% 40% 60% 80% 100%
Winter Service Adequate Safe Roads
Yes No No Opinion
There is a relatively high percentage of dissatisfied residents in the majority of
categories. The results shown are from the LTS survey in 2009. Further investigation has shown that the questionnaire wording can have a significant effect on the results (see Lifecycle Plan).
Cond
iti
on
A full condition survey of the footway / footpath network was undertaken in 2010/11. Results are recorded in appendix e. Undertaking this survey was labour intensive therefore it is likely that such surveys will only be undertaken every 3 or 4 years. The results of the survey showed the following:-
Condition % Area
(sqm) Acceptable 80.00% 641,361 Safe but poor appearance 16.83% 134,944 Minor deterioration 3.12% 24,974 Major Deterioration 0.05% 395
(Note - these surveys do not take individual safety defects into account, only sections of footway / footpaths)
Safety Inspections are carried out on all footways within the County in accordance with the Service's Inspection Policy. In 2011/12 the Service incorporated footpaths into the inspection regime.
Hi s tori c a l In v es tme nt 0 20 40 60 80 100 120 140 160 180 200 2008/ 09 2009/ 10 2010/ 11 2011/ 12 Planned Reactive Rout ine
*A percentage of reactive costs (temporary patching) may be recorded under carriageways due to the methods used to issue works orders and record costs
The majority of the maintenance carried out on this asset group is on footways and to a lesser extent footpaths.
There is currently little maintenance undertaken on cycleways.
Car parks are not subject to programmed
maintenance, minor works are undertaken when required. P la nn ed Fut ure Inv es tme n
t Budgets for footway / footpath maintenance have been set
at around £174k for a number of years. However the majority of these funds were transferred to carriageways due to their rate of deterioration. There is a danger that lack of maintenance will become a significant issue if this practice continues.
A long term investment strategy for this asset has not yet been developed F orw ard W ork s P rog ra mm e
A 12 month rolling forward works programme is maintained by the Service. The Service has developed a Prioritised List of footways requiring treatment, built on the information obtained from the condition surveys. This List will form the basis of the works programme but will be governed by the budget available.
Over the next 3 years there is around £300k capital investment planned for improvement and reconstruction works on this asset group. The majority of recent funds have been used for the creation of new cycle routes (Cambus to Menstrie). Priorities are as follows:-
1. Treating defects which carry a risk to pedestrians 2. Upgrading concrete slabbed footways to blacktop 3. Treating routes highlighted within the Prioritised List Current Issues
Higher car ownership and the resultant lack of available parking in residential area is causing increased occurrences of parking on footways. This significantly reduces the lifespan of the asset. Although illegal, Central Scotland Police have shown no interest in prosecuting to prevent this practice.
Some of the older car parks are in need of repair. There is currently no formal inspection regime or works programme for car parks.
Capital matched funding (Clacks Council 65% / SUSTRANS 35%) has been used to construct significant lengths of new cycleways over recent years. There are now numerous quality routes within the County (although currently not adopted) but there is no additional provision for maintenance.
Current Strategies
A five year capital programme of reconstruction and improvement works commenced 2010/11. Over the first three years of this programme, the majority of these funds have either been transferred to improve the carriageway assets (due to greater need) or used to successfully develop new cycleways. [The cycleway works were grant assisted which required partial funding from the Council].
An annual maintenance regime is undertaken but currently resources are used to ensure priority routes are maintained to a level to ensure basic safety and accessibility. Other routes are treated as and when resources permit or when treatment becomes essential Where possible, focus is given to upgrading flagged footways to flexible construction to minimise the number of trips on the network.
Asset Group: Street Lighting Summary Table Statistics Commentary T he A s s et Column Type Col Height No. Col Type Col Height No. Aluminium 4m 10 Steel 5m 2601 Concrete 5m 459 6m 3295 8m 6 8m 1781 Fibre Glass 29 10m 264 Wood 171 TOTAL = 8,616
Lit Signs 390 Lit Bollards 77
The street lighting network has grown by 11.5% over the last 7 years (1.7% p.a.) There is no available details of asset acquisition before this time.
Growth in lit signs and bollards is unknown at present. Cus tom er E x pe c tati on s
Do You Consider Street Lighting to be in Good Condition
75% 22%
3%
Yes No No Opinion
What do you consider the condition of street lighting in Clacks to be
36%
54% 10%
Good Adequate Poor
Due to the wording of the questionnaire, there is a significant difference in satisfaction levels between the 2006 and 2009 surveys. It is difficult to determine whether this improvement has any relationship to the Service provided.
The requirement for a more detailed survey to be undertaken has been highlighted as a task within this Plan. A ge / Co nd iti on
Age Profile of Lighting Columns
0 100 200 300 400 500 600 700 1 2 3 4 5 6 7 8 9 10 11 12 13 14 15 16 17 18 19 20 21 22 23 24 25 26 27 28 29 30 31 32 33 34 35 36 37 38 39 40 41 42 43 44 45 46 47 48 49 50 Age (Years) N u m b e r Number o f Co lumns
Street lighting Columns Exceeding Expected Service Life
-4,000 -2,000 0 2,000 4,000 6,000 8,000 10,000 12,000 0 1 2 3 4 5 6 7 8 9 10 11 12 13 14 15 16 17 18 19 20 Year N um be r of C ol um ns
No. E x c eedi ng Li f eNo. Wi t hi n Li f e
The age condition profile is based on partial estimates by column types (80% of the data is thought to be accurate to 2 years). The estimated data is mainly for schemes constructed pre 1975 and replacement schemes carried out pre 1990.
The second table shows columns with expired service lives, as forecast by year, assuming continued current expenditure levels. In the medium term the overall condition of the asset should improve.
Hi s tori c a l In v es tme nt 0 50 100 150 200 250 300 350 400 2006/07 2007/08 2008/09 2009/10 2010/11 2011/12 S p e n d ( £ 0 ,0 0 0 's )
Cyclic Reactive Planned Electricity It is widely known that
energy costs have spiraled over the last five years and are likely to continue rising in future. This has had a significant effect on the maintenance budget. P la nn ed F utu re Inv es tme n t
A five year capital programme of reconstruction and improvement works commenced from 2010/11, designed to improve the condition of the network to the value of the capital allocated by the Council (around 225k per annum).
F orw ard W ork s P rog ra mm e
A 12 month rolling forward work programme is maintained by the Service. Levels of funding for maintenance works (both planned and reactive) will be as at 2011-12.
Priorities are identified within the Street Lighting Policy document.
Lit signs and bollards are replaced on an ad-hoc basis rather then by programmed works.
Current Issues
A significant level of underfunding over a number of years has caused a backlog of required street lighting replacement works. It is estimated that it would take around £1.4 million to clear this backlog.
Spiralling energy costs have eaten into the revenue budget and these costs are predicted to increase at similar rates in the future. Combined with environmental pressure on the Council to reduce it's carbon footprint, this is creating a drive to introduce new technologies. Although these technologies may reduce long term maintenance costs, acquisition costs may prove prohibitive (on a significant scale).
Existing light sources are poor in many areas, where lighting levels do not conform with the latest legislation. Replacement schemes often result in an additional number of columns being required to allow standards to be met.
On average there are around 1850 faults reported / found per year, with electrical faults varying from 2 to 30 per year.
There has been one instance within the last 3 years where a concrete column collapsed (no one was hurt). To minimise the risk of similar incidents in future, the Service has implemented formal inspection procedures for both structural and electrical testing.
Current Strategies
Roads & Transportation have developed a management policy for this asset. The latest version is detailed in Appendix J (the first version was approved by Committee in November 2010).
A maintenance regime is undertaken annually with an investment of around £400k planned for 2010/11 (including Capital funds). The Council is well underway with a replacement programme of the old, damaged and poor quality concrete units (particularly 8 metre columns). Routine maintenance and repair work will continue to be a high priority for the Council.
The Council will also consider the improvement of street lighting in conjunction with new traffic management schemes. Lanterns will be replaced with 'white light' type units (Cosmo's) as and when they reach the end of their lifespan.
The Council completed a two year programme around 2001 / 2002 to replace 800 deteriorating units with 1000 new galvanised steel columns. This was undertaken on a 20 year lease scheme meaning current and future revenue budgets will be reduced by the payback amount of £93,000 p.a.