Arkansas Property Tax:
Revenue, Assessments & Rates
Project Director
Wayne P. Miller
Professor and Extension Economist
Data Analysis
Ellie Wheeler Program Associate
Cover Design
Chris Meux Design Specialist
Highlights
4
Highlights
Property tax continues to be a major revenue source for local governments in Arkansas. School districts, county and city governments, community colleges and special districts all benefit from the property tax. We find that:
Revenue
White County property taxes will generate an estimated $51.9 million in revenue in 2020.
School districts in White County are estimated to receive the largest share of property tax revenue (89%) in 2020.
Property tax revenue generated about 35% of total school district funding in White County in the 2018-2019 school year.
White County government is estimated to receive 10% of total revenue from property taxes in 2020.
Assessments
Real estate property accounted for 61% of all property assessments in White County in 2019.
The property tax base, measured by total assessments adjusted for inflation, increased 1% between 2010 and 2019.
White County’s average per capita property tax assessment was $15,992 in 2019.
Property assessments per person decreased $201 (-1%) in White County from 2010 to 2019.
In 2018, White County property assessments averaged $448 for every $1,000 of personal income.
Between 2010 and 2018, average property assessments per $1,000 of personal income decreased $25 or -5%.
Millage1
Countywide, the 2019 average total property tax millage was 43.01 or a tax rate of $43.01 for every $1,000 dollars of assessed property.
Between 2010 and 2019, the average millage in White County increased by 0.4 mills or 1%.
National Comparisons
In 2017, Arkansas received 19% of total state and local tax revenue from property tax, which was considerably less than the national average (32%). Only Alabama depended less on property tax than Arkansas as a share of state and local tax revenue.
Arkansas’ per capita property tax revenue ($742) was less than half the national average ($1,618) in 2017. Only residents of Alabama and Oklahoma were subject to a lower per capita property tax burden.
Property tax revenue in Arkansas was about 1.8% of Arkansans’ total personal income in 2017, lower than the national average of 3.1%. Only two states, Alabama and Oklahoma, had lower property tax revenue per $1,000 of personal income than Arkansas in 2017.
Introduction
5
Introduction
Property tax is a critical revenue source for local governments in Arkansas. The property tax generates revenue for school districts, county and city governments, community colleges and special districts. In this publication, we provide information about the source and distribution of property tax revenue to provide a better understanding of the importance of property tax to pay for schools, roads, public safety and other local services in the state. We also compare the tax base and rates among the 75 Arkansas counties over time, which provides information on the property tax capacity and effort of local governments.
Figure 1 illustrates the sources and uses of property tax revenue. The thickness of the arrow indicates the share of property tax revenue flows for the state of Arkansas. Within each county, the thickness of the arrow from each source may vary, as the share paid by property owners and the revenue received by taxing units is dependent on local tax structure, property tax base and rates.
Figure 1. Sources and Uses of Property Tax Revenue.
We first discuss the local use of the property tax revenue and then compare the importance of the property tax revenue for school districts, county governments, and city governments. The
following section illustrates the property tax base and how it changed from 2010 to 2019. Next, property tax rates (millage) are presented and compared among counties. Finally, the property tax burden is compared among counties and states.
Local Use of Property Tax Revenue
6
Local Use of Property Tax Revenue
Property tax provides substantial revenue for local services, including public K-12 schools, counties, cities, special districts, and some community colleges. In 2020, Arkansas property taxes are estimated to generate $2.7 billion statewide.2 Because property assessments and tax rates are not the same for all taxing units, the amount and share of revenues generated by each taxing unit varies among counties. In White County, property taxes will generate an estimated $51.9 million in 2020. Figure 2 illustrates how this property tax revenue will be distributed to the three largest taxing units in White County in 2020. School districts receive the largest share of property tax revenue (89%) while county and city governments receive 10% and 1%,
respectively. In some Arkansas counties, community colleges and special districts also receive a small share of property tax revenue, which we have included in revenue generated by the county. Figure 2. Estimated Share of Property Tax Revenue by Taxing Unit, White County, 2020
Source: Computed from Arkansas Assessment Coordination Department reports
Nationwide, property taxes generate a significant share of state and local tax revenue (Figure 3). The U.S. Census Bureau estimates that in 2017, property taxes accounted for more than 32% of state and local government tax revenue in the United States. Property tax in Arkansas only contributed about 19% to state and local tax revenues in 2017, making Arkansas’ reliance on property tax among the lowest in the nation.
2Revenue estimates were calculated using 2019 millage reports and 2019 assessment reports (both for taxes
payable in 2020), from the Arkansas Assessment Coordination Department and County Assessor’s Offices. Estimates assume 100% payment in 2020.
School District 89% City 1% County 10% *
Local Use of Property Tax Revenue
7
Figure 3. Property Tax Revenue as a Percent of State and Local Tax Revenue, 2017
Source: U.S. Census Bureau
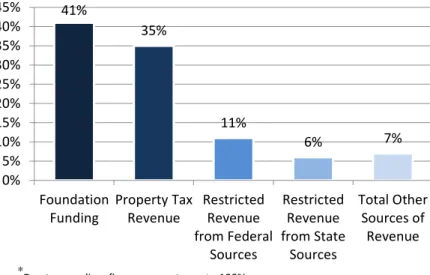
School Districts
With oversight from locally elected school boards, school districts use property tax revenue for many vital expenses, including building
construction and maintenance, teacher salaries, school supplies and equipment. During the 2018-2019 school year, White County school districts received $129.5 million in total funding. Property tax revenue alone contributed $45.0 million, or 35% (Figure 4).
*
Due to rounding, figure may not sum to 100%.
Figure 4. School District Revenue by Source, White County, 2018-2019 School Year
Source: Arkansas Department of Education Annual Statistical Report
41% 35% 11% 6% 7% 0% 5% 10% 15% 20% 25% 30% 35% 40% 45% Foundation Funding Property Tax Revenue Restricted Revenue from Federal Sources Restricted Revenue from State Sources Total Other Sources of Revenue
Local Use of Property Tax Revenue
8
Due to differences in tax capacity, effort and state and Federal aid, each district’s reliance on property tax to fund their schools varies greatly. In the 2018-2019 school year, property taxes funded as little as 16% (Sevier County) to as much as 55% (Cleburne County) of school district revenue in the 75 counties of Arkansas (Figure 5).
Figure 5. Property Tax revenue as a Percent of Total School District revenue, 2018-2019
Source: Computed from the Arkansas Department of Education Annual Statistical Report
County Governments
County governments in Arkansas also generate a large portion of their total revenue from property taxes. In 2017, the White County government received 16% of total revenue from property taxes, which was below the state average of 23%. Counties raised between 3% and 43% of all revenue from property tax during the same period (Figure 6). While the property tax
revenue for some county governments has been increasing, many counties receive a smaller share of their total revenue from property taxes than they have in the past. This is because most Arkansas counties also use the sales tax to generate revenue, reducing their reliance on property tax.
Local Use of Property Tax Revenue
9
Figure 6. Property Tax revenue as a Percent of Total County revenue, 2017
Source: Computed from Arkansas Department of Legislative Audit reports
City Governments
Property tax provides a smaller percent of total revenue to cities than to school districts and counties. In the 1980s, Arkansas cities obtained a larger share of their local tax revenue from property tax than they currently do. More recently, cities rely on sales tax to generate a larger share of local revenue for city governments.
Property Assessments
10
Property Assessments
Revenue generated from property tax is based on property assessments in the taxing unit times the millage (tax rate). Property tax is collected on real and personal property from commercial and industrial establishments, utilities and carriers, farms and households. Total property tax assessments in White County were about $1.3 billion in 2019. Real estate property (land, buildings and minerals) was the largest source of property tax assessments, accounting for $769 million (61%) of total property assessments in the county in 2019. Personal property and utility assessments accounted for $269 million (21%) and $165 million (13%) of total assessments, respectively (Figure 7). Mineral assessments in White County were $57 million or 4.48%.
Figure 7. Total Property Tax Assessments, White County, 2019
Source: Computed from Arkansas Assessment Coordination Department reports
Between 2010 and 2019, nominal (current dollar) property assessments in White County
increased about 17%. After adjusting for inflation using the South-Urban Consumer Price Index (CPI), the real (constant dollar) growth in property assessments was 1%, indicating an increasing property tax base in the county (Figure 8).
Changes in property assessments varied greatly among counties. Change in real (constant dollar) property assessments from 2010 to 2019 ranged from an increase of 42% in Hempstead County to a decrease of 33% in Van Buren County. The two counties with the largest percent declines in property assessments during this period, Van Buren and Conway counties, were greatly affected by the drop in natural gas assessments. The large increase in property assessments in Hempstead County was primarily due to a new power plant in the county.
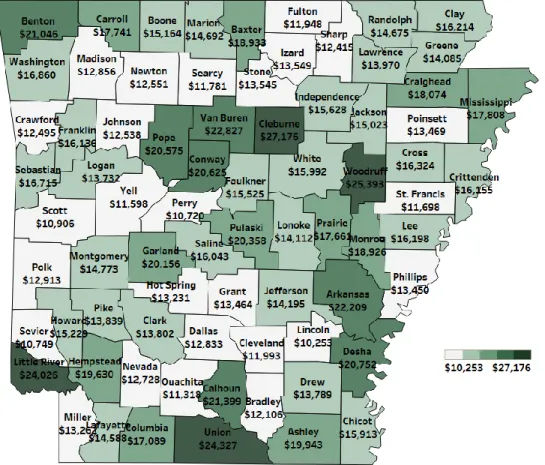
Per capita property assessments are calculated by dividing total assessments by population. This metric indicates the capacity of counties to raise revenue from property tax. White County’s per capita property assessment was $15,992 in 2019. 32 of 75 counties were above the state average ($15,819) in 2019 (Figure 9).
Real Estate 61% Personal Property 21% Minerals 4.48% Utilities 13% *
Property Assessments
11
Figure 8. Total Property Tax Assessments, White County, 2010-2019
Source: Computed from Arkansas Assessment Coordination Department reports
Figure 9. Property Assessments per Capita, 2019
Property Assessments
12
Rural areas without natural gas or mineral reserves are more likely to have low assessments per capita and therefore have a lower capacity to raise revenue from property taxes. Using inflation adjusted assessment values to measure the change in per capita property assessments between 2010 and 2019, we illustrate how the capacity of counties to raise property tax revenue has changed over time (Figure 10). In White County during this period, per capita property assessments decreased by $201 (-1%). Changes to per capita assessments may result from changes to property assessments and/or population.
Figure 10. Change in per Capita Property Assessments, 2010-2019
Source: Computed from Arkansas Assessment Coordination Department reports and U.S. Census Bureau data
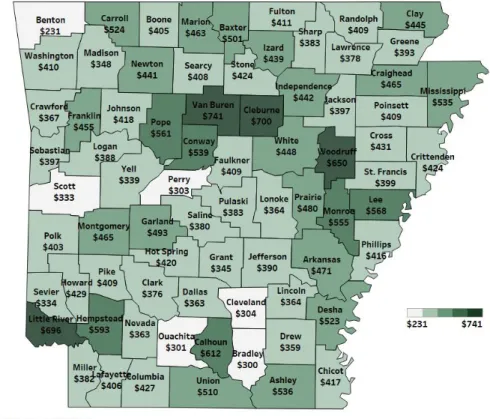
Dividing assessments by total personal income is another way of measuring the property tax base (Figure 11). In 2018, Arkansas averaged $436 in assessments for every $1,000 in personal
income, with a range between $231 in Benton County and $741 in Van Buren County. The average assessments per $1,000 of personal income in White County was $448.
Between 2010 and 2018, average property assessments per $1,000 of personal income in White County decreased $25 or -5%. During this time period, the greatest growth occurred in Lee and Mississippi counties (Figure 12). Property assessments per $1,000 of personal income declined in more than one-half of Arkansas counties during this eight-year period.
Property Assessments
13
Figure 11. Property Assessments per $1,000 Personal Income, 2018
Source: Computed from Arkansas Assessment Coordination Department and U.S. Bureau of Economic Analysis data
Figure 12. Change in Property Assessments per $1,000 Personal Income, 2010-2018
Property Tax Rates
14
Property Tax Rates
Property tax rates (millage) are an indicator of the local tax effort used to support local services. Counties, cities and school districts have different boundaries and tax rates, which means that citizens in the same county have different tax rates depending on whether they live in a town or rural area and in which school district they live. To facilitate comparisons among counties, property tax rates within each county are weighted and averaged.
In White County, the 2019 average total property tax millage was 43.01, or a tax rate of $43.01 for every $1,000 dollars of assessed property. School districts in White County had an average millage of 37.43 and city governments averaged 2.29 mills. The White County government had a millage of 4.1. Figure 13 shows the average total millage by county in 2019.
Figure 13. Average Total Millage by County, 20193
Source: Arkansas Assessment Coordination Department
3 These property tax rates (millages) were approved in 2019 for calculating 2020 property tax bills. Therefore, they
Property Tax Rates
15
In 2010, the average total property millage in White County was 42.61. Between 2010 and 2019, the average total property tax millage increased by 0.4 mills or 1% (Figure 14). The average total change in millage among counties varied widely during this time period, with St. Francis County showing the largest decline (-12%) and Sebastian County showing the most growth (18%). Figure 14. Change in Average Total Millage by County, 2010-20194
Source: Computed from Arkansas Assessment Coordination Department reports
Property Tax Burden
16
Property Tax Burden
Figure 15 shows that the estimated 2020 per capita property tax revenue for counties in Arkansas range from a low of $447 in Scott County to a high of $1,386 in Union County. Thirty-three of 75 counties (44%) have estimated per capita property tax revenue that was above the state average ($747). Estimated property tax revenue as a share of personal income ranged from 1.4% in Scott County to 3.3% in Van Buren County (Figure 16). In White County, per capita property tax revenue was $659 and property tax revenue as a percent of income was 1.9%.
Figure 15. Estimated Property Tax Revenue per Capita, 2020
Source: Computed with population estimates from the U.S. Census Bureau and assessed values and millage from the Arkansas Assessment Coordination Department.5
5 Per capita estimates used revenue estimates for 2020 and population counts for the most recent year of available
data, 2019. Revenue estimates were calculated using 2019 millage reports and 2019 assessment reports (both for taxes payable in 2020), from the Arkansas Assessment Coordination Department and County Assessors Offices. Estimates assume 100% payment in 2020.
Property Tax Burden
17
Arkansas’ property tax burden is low compared with other states when measured on a per capita basis and as a share of personal income. In 2017, Arkansas’ property tax revenue per capita was $742—the third lowest in the United States after Alabama and Oklahoma (Figure 17). Arkansans pay only about 1.8% of their personal income to property taxes on average, which is third lowest in the nation (Figure 18). Only residents of Oklahoma and Alabama have a lower property tax burden when measured by percent of personal income.
Figure 16. Estimated Property Tax Revenue as Percent of Personal Income, 2020
Source: Computed from Arkansas Assessment Coordination Department and U.S. Bureau of Economic Analysis data6
6 Estimates as a percent of personal income used revenue estimates for 2020 and revenue figures for the most
recent year of available data, 2018. Revenue estimates were calculated using 2019 millage reports and 2019 assessment reports (both for taxes payable in 2020), from the Arkansas Assessment Coordination Department and County Assessor’s Offices. Estimates assume 100% payment in 2020.
Property Tax Burden
18
Figure 17. Property Tax Revenue per Capita, 2017
Source: U.S. Census Bureau
Figure 18. Property Tax Revenue as a Percent of Personal Income, 2017
Summary
19
Summary
The property tax is a critical source of revenue for the local governments of Arkansas, providing funding to counties, cities, school districts, community colleges and special districts. In 2020, property taxes in White County are estimated to generate approximately $51.9 million in revenue for local governments. City governments in the county will share 1% of total property tax
revenue, whereas the county government will receive 10%. School districts receive the largest share of property tax revenue in every county in Arkansas. In White County, school districts receive 89% of total property tax revenues.
The revenue received from the property tax is very important for both school districts and county governments. School districts in White County received $45.0 million, or about 35% of their total revenue, from property taxes during the 2018-2019 school year. Similarly, the county government received approximately 16% of their revenue from the property tax.
Property assessments in the county increased 1% between 2010 and 2019, and the average millage rate increased about 1%. During the same time period, property assessments per person decreased -1% while property assessments per $1,000 of personal income decreased -5%. Arkansas’ per capita property tax revenue and property tax revenue as a percent of total personal income were the third lowest in the nation in 2017. While property tax is an important source of revenue for schools and local governments in Arkansas, the tax only generated 19% of total state and local tax revenue in 2017, which was the 2nd lowest in the nation. The more than $2 billion of property tax revenue in 2017 was approximately 1.8% of Arkansas’ total personal income and $742 in property tax revenue per Arkansan. By these measures, Arkansans are subject to one of the lowest property tax burdens in the United States.
Glossary
20
Glossary
Assessments: All real estate (land and buildings) and some personal property is assessed a value which is 20% of the market value.
Average Total Millage: The average millage in a particular geographic area. The average is computed by weighting the millage in different political and administrative districts by the assessments in the districts.
Consumer Price Index: An index showing the change in the cost of a fixed basket of goods and services over time. The index is used to measure inflation in the cost of goods and services.
Federal Aid: Revenue and the value of goods received from the federal government.
In-Kind: The value of in-kind goods and services received by local school districts or other entities.
Local Tax: Taxes of local governmental entities including counties, cities, school districts and other special districts.
Millage: The tax rate on real and personal property. Millage is usually reported in rates per $1,000 of assessed value.
Personal Property Tax This is a tax on some movable property including such items as cars, boats, motorcycles, recreational vehicles, etc.
Property Tax: A tax on real estate (land and buildings) and personal property of households, businesses, utilities and carriers.
State and Local Tax Revenue: The sum of all tax revenue collected by state and local governments, including the state, county, city, school and special districts.
State Equalization Revenue: Revenue received by school districts from the state to attempt to equalize base funding among school districts in Arkansas.
Total Personal Income: The total income received by residents of an area, including earnings, transfer payments, and interest, dividends and rent.
Utility and Carrier Property Tax: Taxes on real and personal property of utility and carrier companies. Carriers include businesses like pipeline, railroad, transportation, bus and airline companies.
University of Arkansas, United States Department of Agriculture and County Governments Cooperating
The University of Arkansas System Division of Agriculture offers all its Extension and Research programs and services without regard to race, color, sex, gender identity, sexual orientation, national origin, religion, age, disability, marital or veteran status, genetic information, or any other
legally protected status, and is an Affirmative Action/Equal Opportunity Employer.
Arkansas is Our Campus
Visit our web sites at:
http://uaex.edu http://arcommunities.com