Universal Life Competitive
Illustrated Performance Update
Recent crediting rate changes in the current assumption universal life (CAUL) market have significantly altered the competitive landscape for illustrated performance. This Report will provide a discussion of the main factors that impact current crediting rates, provide a summary of recent CAUL price changes by carrier, and provide an updated top three competitive illustrated performance summary.
What Drives Universal Life Crediting Rates
Universal life products offer a current non-guaranteed crediting interest rate, which is subject to a guaranteed minimum, and is typically backed by a portfolio of high quality fixed income instruments such as bonds and mortgages.
Supported Primarily by Yields on Bonds and Mortgages
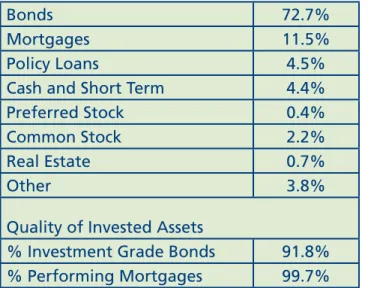
Historically, the crediting rate is the policy element assumption most likely to change over time, as it is dependent upon variable investment earnings. Regulatory constraints—designed to protect policyholders—limit the investment alternatives insurance companies may use. As such, insurance companies typically invest in investment grade bonds and mortgages to best match the insurance liability profile. Table 1 shows that as of year-end 2009 more than 80 percent of the top 30 insurers’ invested assets were bonds and mortgages.
Table 1: Distribution of Invested Assets of Top 30 Life Insurance Companies as of December 31, 2009*
Bonds 72.7%
Mortgages 11.5%
Policy Loans 4.5%
Cash and Short Term 4.4% Preferred Stock 0.4%
Common Stock 2.2%
Real Estate 0.7%
Other 3.8%
Quality of Invested Assets
% Investment Grade Bonds 91.8% % Performing Mortgages 99.7%
* Top 30 issuers of high face amount life insurance policies, representing 65 percent of total permanent face amount issued in 2009.
Historical Interest Experience – Rates Continue to Fall
New money bond yields have been decreasing since the early 1980s, including a drop of approximately 75 basis points (bps) during 2010 (through September). Consequently, portfolio earnings remain under downward pressure, resulting in decreased crediting rates. This includes crediting rate drops of 15 to 35 bps during the first three quarters of 2010 for many M proprietary and non-M UL products (see Figure 1).
C O M P E T I T I V E
INTELLIGENCE REPORT
M Financial Groupregularly provides Product Illustration Comparisons that address changes in the marketplace, offer perspective on a wide array of products, and support Member Firm efforts to identify effective product solutions for clients.
This insight serves as a significant competitive advantage for Member Firms.
October 2010 Competitive Intelligence Report 2
Figure 1: Historical Bond Yields and Sample Crediting Rates
Most crediting rates are based on the investment earnings of a seasoned portfolio. Because it takes time for investments to mature (and ultimately roll off the portfolio), there is a lag between the change in new money rates and the resulting change to portfolio earnings and the crediting interest rate. However, some crediting rates are based on new money rates or a new portfolio; therefore the crediting rate will react more quickly to changes in new money rates.
Crediting Rate Benchmark – Time Lag Considerations
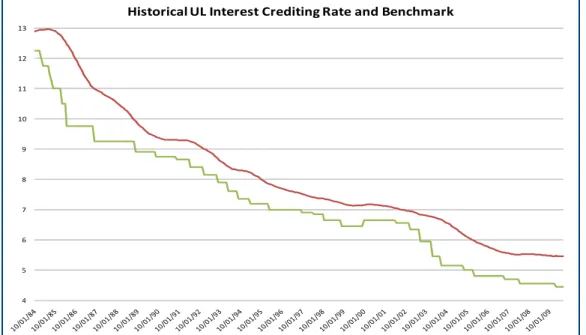
A crediting rate benchmark takes into consideration the time lag between the change in new money rates and portfolio crediting rates. Historically, the crediting rate movements of seasoned UL portfolios have tracked closely to movements in the five-year rolling average of Moody’s AAA Corporate Bond Yield (the crediting rate benchmark). The five-year rolling average represents a portfolio of seasoned investments maturing and rolling off with the purchase of new investments (see Figure 2). The benchmark has continued to drop, lending credence to the recent and ongoing crediting rate drops.
Figure 2: Historical Five-Year Rolling Average of Moody’s Bond Yields and Sample Crediting Rates
4 5 6 7 8 9 10 11 12 13
Historical UL Interest Crediting Rate and Benchmark
Moody's AAA Corporate Bond Yield Sample Crediting Rate
4 5 6 7 8 9 10 11 12 13
Historical UL Interest Crediting Rate and Benchmark
3 Competitive Intelligence Report October 2010
Crediting Interest Rate Change Indication – Continued Downward Pressure
Trends show that there may be more downward pressure on crediting rates due to the continued drop in new money rates during 2010 (through September). The difference between the current Moody’s new money rate and the rolling average benchmark can provide an indication of future crediting rate changes. If the current new money rate is less than the rolling average, there is likely to be downward pressure on portfolio earnings and crediting rates. If the current new money rate is greater than the rolling average, there is likely to be upward pressure on portfolio earnings and crediting rates.
Table 2 provides a comparison of new money rates versus the rolling average as of September 2010. This analysis indicates there may still be some pressure for a reduction in crediting rates post-September 2010, as the new money rate is 90 bps less than the rolling average.
Table 2: September 2010 Crediting Interest Rate Change Indication
(A) Moody’s New Money AAA Corporate Bond Yield 4.53% (B) Moody’s 5-Year Rolling Average 5.43% Future Crediting Rate Indication (A) - (B) -0.90% (-90 bps)
Historical New Money Interest Rate Observation – Rates May Be Bottoming Out
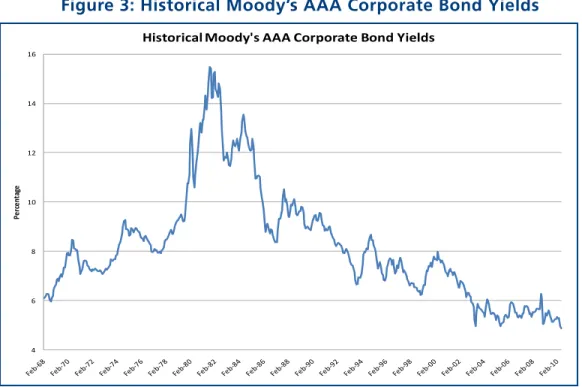
There may be some indication that new money interest rates have bottomed out. As of September 2010, they were lower than at any time over the previous four decades (see Figure 3).
Figure 3: Historical Moody’s AAA Corporate Bond Yields
Looking Ahead – Stress Testing
As of September 2010, there is continued downward pressure on crediting rates. However, while nothing is certain, it appears that new money interest rates may not decrease much further given the historically low interest rate environment; therefore, crediting rates may be close to the bottom as well. Stress testing is recommended for all new business or inforce illustrations to manage client expectations and to make a more informed choice regarding policy funding and inforce management. Stress testing would include illustrating crediting rate drops of 25 to 50 bps, as well as more severe possibilities (e.g., a 100 bps reduction and all the way to the guaranteed minimum crediting rate).
UL Competitive Update
4 6 8 10 12 14 16
Pe
rc
en
ta
ge
October 2010 Competitive Intelligence Report 4
M Carrier Universal Life Product Releases and Crediting Rate Changes During 2010
The following is a summary of M Carrier new product releases and crediting rate changes during 2010 (through September) in the single life current assumption UL market:John Hancock
• JH MULX Performance Rider: released May 2010
• JH Accumulation UL 09 – 20 bps rate decrease (5.30% –> 5.10%): May 2010
• JH Performance UL 10 (replaced Performance UL 09): released June 2010 and repriced September 2010 • JH MULX – 20 bps rate decrease (5.05% –> 4.85%): June 2010
• JH MVULX w/EYFA – 20 bps fixed account rate decrease (5.30% –> 5.10%): June 2010 • JH MPVUL w/EYFA – 20 bps fixed account rate decrease (5.30% –> 5.10%): June 2010
Lincoln Financial
• LFG LifeCurrent UL – 20 bps rate decrease (4.85% –> 4.65%): January 2010 • LFG LifeReserve UL (2009) – 20 bps rate decrease (5.45% –> 5.25%): March 2010
Nationwide
• NW YourLife CAUL – 25 bps rate decrease (5.00% –> 4.75%): January 2010 • NW YourLife CAUL – 15 bps rate increase (4.75% –> 4.90%): April 2010 • NW YourLife CAUL – 25 bps rate decrease (4.90% –> 4.65%): July 2010 • NW YourLife CAUL – 40 bps rate decrease (4.65% –> 4.25%): October 2010
Pacific Life
• PL MVP VII w/LTFA – 10 bps fixed account rate decrease (5.35% –> 5.25%): February 2010 • PL Select Exec IV w/LTFA – 10 bps fixed account rate decrease (5.35% –> 5.25%): February 2010 • PL VF Pro – 10 bps rate decrease (5.45% –> 5.35%): February 2010
• PL MVP VIII w/LTFA (replaced MVP VII): released May 2010 • PL Select Exec V w/LTFA (replaced SE IV): released May 2010 • PL MVP UL-CV and MVP UL-DB: released May 2010
• PL VF Pro II-CV and VF Pro II-DB (replaced VF Pro): released May 2010
Prudential
• PRU PruLife UL Plus – 15 bps rate decrease (5.20% –> 5.05%): January 2010 • PRU PruLife UL Plus (2010): released May 2010
Sun Life
• Sun Prime UL – 15 bps rate decrease (5.10% –> 4.95%): March 2010
• Sun Universal Protector Plus (2009) – 25 bps rate decrease (4.85% –> 4.60%): March 2010 • Sun Accumulation UL: released May 2010
ING Security Life
5 Competitive Intelligence Report October 2010 Future UL Crediting Rate Changes
Effective November 1, 2010, Pacific Life will be decreasing crediting interest rates on new business and inforce policies (see October 1 Pacific Life Bulletin). The crediting rate drops of 10 bps are being applied to Pacific Life’s vari-able products with funds allocated to the fixed accounts. At this time we are not aware of any impending crediting rate changes on other M Carrier products. However, based on the interest rate analysis covered earlier in this report, we would not be surprised to see additional crediting rate decreases during the remainder of 2010 (on both M Car-rier and non-M carCar-rier UL products).
Competitive Landscape as of September 2010
See Appendices C-E for an updated top three premium solve competitive illustrated performance comparison of M Carrier CAUL products as of September 2010. Appendices A-B contain cash value illustrated performance charts. Competitive highlights are as follows:
• The competition for premium solves is very tight, with the top three products typically within 5 percent. • M Financial’s proprietary product with Sun Life, Sun Prime UL, provides an extremely competitive package
of both best-in-class premium solves and strong cash values. Sun Prime UL is most competitive for 10-pay and lower funding across a broad range of commission matching scenarios, with best-in-class premiums in 55 of the 72 cells tested. Of the top tier premium solve products, Sun Prime UL provides the strongest cash value accumulation from policy year one (including no surrender charges), with first year surrender value to premium ratios of 60 percent for level-pay funding and 100 percent for single-pay funding.
• M Financial’s proprietary product with John Hancock, Majestic ULX, also has a very competitive package of low premium solves and strong cash values, typically providing the second lowest premium solve and within 5 percent of best-in-class for 10-pay and lower funding. MULX has no surrender charges and top tier cash value growth.
• For competitive situations where lower commissions may be required, and particularly level-pay for life funding and higher issue ages, the Performance rider on JH MULX provides top tier to best-in-class premium solves. Unlike most performance or protection type products, MULX with the Performance rider provides strong cash values, with a year one surrender value to premium ratio of approximately 50 percent for level-pay funding and 75 percent for 10-level-pay funding. The cash value drop for the Performance rider as compared to the base product is within 20 bps from policy year 20 and on as measured by SV IRR. The Performance rider does not include term blending and the fixed commission level may be considered low (i.e., on par with the commission level of other products with heavy term blending).
• For competitive situations where lower commissions may be required, and particularly level-pay for life funding and younger issue ages, JH Performance UL 2010 provides top tier to best-in-class premium solves. Like most performance or protection type products, JH Performance UL 2010 includes surrender charges and lower cash accumulation. JH Performance UL 2010 does not include term blending and the fixed commission level may be considered low (i.e., on par with the commission level of other products with heavy term blending).
• M Financial’s proprietary product with Pacific Life, MVP UL DB, is very competitive in level-pay for life funding providing top tier to best-in-class premium solves. As expected of a low cost death benefit protection product, cash value growth is not competitive.
• M Financial’s proprietary index product with Pacific Life, MVP IUL with funds allocated to the fixed account, typically provides a top three premium solve and premiums within 5 percent of best-in-class for 10-pay and lower funding.
Considerations for Non-Guaranteed Nature of Current Assumption Illustrations
The current assumptions for interest credit, mortality charges, and other policy charges are not guaranteed. In particular, crediting rates are the most likely to change due to changes in underlying investment portfolio earnings.
UL Competitive Update
For More
Information
6 Competitive Intelligence Report October 2010
To learn more about the UL marketplace, please contact:
Erwin “Butch” Doerschler CLU, FBS
[email protected] Craig Platt,
CLU, ChFC, CFP
[email protected] Donald Brewer
CFA
[email protected] Rose Street Advisors
244 North Rose Street Kalamazoo, MI 49007 269.552.3200 (Office) 800.233.0749 (Toll Free) 269.343.3533 (Fax) A product that currently illustrates better than other products may not end up
having the best actual future policy performance due to a crediting rate that does not hold up as well relative to other products’ crediting rates. Small changes in relative crediting rates can invert relative product performance. As an example, premiums increase approximately 1 percent to 2 percent per 10 bps reduction to the crediting rate. Given the very competitive environment, a 10 bps crediting rate reduction for a best-in-class product can drop it from #1 to #3 on a premium solve basis.
Therefore, consideration should be given to the non-guaranteed nature of illustrations where small differences in illustrated performance may be considered immaterial to the product selection decision. Consideration should also be given to a carrier’s track record of inforce policy management and service.
M Financial will continue to monitor the UL marketplace and provide updates as needed. Up-to-date competitive illustration comparisons for single life and survivorship versions for UL, VUL, and NLG are available in the Members Area of M Financial’s website. For questions, please contact any member of M Financial’s Product Management team at 800.656.6960.
See attached Appendices:
• Appendix A – Surrender Value to Cumulative Premium Ratios for Level-Pay Funding
• Appendix B – Surrender Value to Premium Ratio and Surrender Value IRRs for 10-Pay Funding
• Appendix C – Top 3 Premium Solve Summary for High Commission Matches
• Appendix D – Top 3 Premium Solve Summary for Moderate Commission Matches
• Appendix E – Top 3 Premium Solve Summary for Low Commission Matches
October 2010 Competitive Intelligence Report 7
Appendix A
Surrender Value to Cumulative Premium Ratios for Level-Pay Funding
Includes top tier premium solve products with pay for life funding:• Sun Life – Prime UL
• John Hancock – Majestic ULX – Performance Rider • John Hancock – Performance UL 2010
• Pacific Life – MVP UL - DB
0% 10% 20% 30% 40% 50% 60% 70% 80% 90% 100%
1 2 3 4 5 6 7 8 9 10 11 12 13 14 15 16 17 18 19 20 21 22 23 24 25 26 27 28 29 30
Surrender Value to Cumulative Premium Ratio Policy Years 1‐30
Level‐Pay $1 Age 120
Sun Prime UL JH MULX‐Perf JH Perf UL 10 PL MVP UL‐DB
8 Competitive Intelligence Report October 2010
Surrender Value to Premium Ratio and Surrender Value IRRs for 10-Pay Funding
Includes top tier premium solve products for 10-pay funding:• Sun Life – Prime UL
• John Hancock – Majestic ULX
• John Hancock – Majestic ULX – Performance Rider • John Hancock – Performance UL 2010
• Pacific Life – MVP UL - DB
0% 10% 20% 30% 40% 50% 60% 70% 80% 90%
Sun Prime UL JH MULX JH MULX‐Perf PL MVP UL‐DB JH Perf UL 10
Year 1 Surrender Value to Premium Ratio 10‐Pay Endow Age 120 Issue Age 55 ‐2.00% ‐1.75% ‐1.50% ‐1.25% ‐1.00% ‐0.75% ‐0.50% ‐0.25% 0.00% 0.25% 0.50% 0.75% 1.00% 1.25% 1.50% 1.75% 2.00% 2.25% 2.50% 2.75% 3.00%
10 11 12 13 14 15 16 17 18 19 20 21 22 23 24 25 26 27 28 29 30 Surrender Value IRRs
Policy Years 10‐30 10‐Pay Endow Age 120 Sun Prime UL JH MULX JH MULX‐Perf JH Perf UL 10 PL MVP UL‐DB 0% 10% 20% 30% 40% 50% 60% 70% 80% 90%
Sun Prime UL JH MULX JH MULX‐Perf PL MVP UL‐DB JH Perf UL 10
Year 1 Surrender Value to Premium Ratio
10‐Pay Endow Age 120 Issue Age 55
‐2.00% ‐1.75% ‐1.50% ‐1.25% ‐1.00% ‐0.75% ‐0.50% ‐0.25% 0.00% 0.25% 0.50% 0.75% 1.00% 1.25% 1.50% 1.75% 2.00% 2.25% 2.50% 2.75% 3.00%
10 11 12 13 14 15 16 17 18 19 20 21 22 23 24 25 26 27 28 29 30
Surrender Value IRRs
Policy Years 10‐30 10‐Pay Endow Age 120
Sun Prime UL JH MULX JH MULX‐Perf JH Perf UL 10 PL MVP UL‐DB
October 2010 Competitive Intelligence Report 9
Appendix C
Top 3 Premium Solve Summary for High Commission Matches
Commission Match: Carve out high commission products and match commissions to the product with the lowest all base compensation.
Products included: All M Carrier current assumption UL products except as noted below. The following low commission products are not included:
• John Hancock – Majestic ULX – Performance Rider • John Hancock – Performance UL 2010
Level-Pay to $1 at age 120
Rank
Age/Class #1 Product #2 Product %Inc. #3 Product %Inc.
Age 45
Best JH MULX PL MVPULDB 8% SL PrimeUL 13%
2nd PL MVPULDB SL PrimeUL 4% PL MVPIUL(fa) 6%
Std SL PrimeUL PL MVPULDB 1% JH MULX 6%
Age 55
Best SL PrimeUL PL MVPULDB 1% JH MULX 2%
2nd SL PrimeUL PL MVPULDB 1% JH MULX 3%
Std SL PrimeUL JH MULX 4% PL MVPULDB 5%
Age 65
Best PL MVPULDB JH MULX 0% SL PrimeUL 1%
2nd PL MVPULDB JH MULX 1% SL PrimeUL 3%
Std SL PrimeUL JH MULX 1% PL MVPULDB 1%
Age 75
Best SL PrimeUL PL MVPIUL(fa) 2% JH MULX 5%
2nd SL PrimeUL JH MULX 3% PL MVPIUL(fa) 3%
Std JH MULX SL PrimeUL 0% PL MVPIUL(fa) 5%
10-Pay to Endow at age 120
Rank
Age/Class #1 Product #2 Product %Inc. #3 Product %Inc.
Age 45
Best JH MULX JH AUL09 1% PL MVPULDB 9%
2nd PL MVPULDB PL MVPIUL(fa) 1% SL PrimeUL 1%
Std SL PrimeUL JH MULX 3% PL MVPULDB 3%
Age 55
Best SL PrimeUL JH MULX 2% JH AUL09 4%
2nd SL PrimeUL JH MULX 2% PL MVPIUL(fa) 6%
Std SL PrimeUL JH MULX 3% PL MVPIUL(fa) 7%
Age 65
Best SL PrimeUL JH MULX 3% PL MVPIUL(fa) 3%
2nd SL PrimeUL JH MULX 1% PL MVPIUL(fa) 2%
Std SL PrimeUL JH MULX 2% PL MVPIUL(fa) 4%
Age 75
Best SL PrimeUL JH MULX 4% PL MVPIUL(fa) 5%
2nd SL PrimeUL JH MULX 3% PL MVPIUL(fa) 6%
Std SL PrimeUL JH MULX 2% PL MVPIUL(fa) 5%
Single-Pay to Endow at age 120
Rank
Age/Class #1 Product #2 Product %Inc. #3 Product %Inc.
Age 45
Best JH MULX JH AUL09 0% PL MVPULDB 9%
2nd PL MVPULDB PL MVPIUL(fa) 0% JH AUL09 0%
Std SL PrimeUL PL MVPULDB 3% PL MVPIUL(fa) 3%
Age 55
Best SL PrimeUL JH MULX 2% JH AUL09 3%
2nd SL PrimeUL JH MULX 2% JH AUL09 4%
Std SL PrimeUL JH MULX 3% PL MVPIUL(fa) 7%
Age 65
Best SL PrimeUL JH MULX 2% PL MVPIUL(fa) 4%
2nd SL PrimeUL JH MULX 1% PL MVPIUL(fa) 4%
Std SL PrimeUL JH MULX 1% PL MVPIUL(fa) 5%
Age 75
Best SL PrimeUL JH MULX 4% JH AUL09 6%
2nd SL PrimeUL JH MULX 3% PL MVPIUL(fa) 9%
10 Competitive Intelligence Report October 2010
Commission Match: Match commissions to the product with the lowest all base compensation. Products included: All M Carrier current assumption UL products except as noted below.
The following low commission products are not included in the 10-pay and single-pay funding scenarios: • John Hancock – Majestic ULX – Performance Rider
• John Hancock – Performance UL 2010
Level-Pay to $1 at age 120
Rank
Age/Class #1 Product #2 Product %Inc. #3 Product %Inc.
Age 45
Best JH PUL10* JH MULXperf* 2% SL PrimeUL 4%
2nd JH PUL10* JH MULXperf* 3% PL MVPULDB 7%
Std SL PrimeUL JH MULXperf* 3% PL MVPULDB 3%
Age 55
Best JH PUL10* JH MULXperf* 1% SL PrimeUL 5%
2nd JH PUL10* JH MULXperf* 1% SL PrimeUL 8%
Std SL PrimeUL JH MULXperf* 1% JH MULX 5%
Age 65
Best JH MULXperf* JH PUL10* 1% SL PrimeUL 3%
2nd JH MULXperf* JH PUL10* 2% PL MVPULDB 3%
Std JH MULXperf* SL PrimeUL 1% PL MVPULDB 1%
Age 75
Best JH PUL10* JH MULXperf* 1% SL PrimeUL 1%
2nd JH MULXperf* JH PUL10* 2% PL MVPULDB 3%
Std JH MULXperf* SL PrimeUL 1% JH MULX 2%
10-Pay to Endow at age 120
Rank
Age/Class #1 Product #2 Product %Inc. #3 Product %Inc.
Age 45
Best JH MULX JH AUL09 1% SL PrimeUL 3%
2nd SL PrimeUL PL MVPULDB 0% PL MVPIUL(fa) 1%
Std SL PrimeUL JH MULX 4% PL MVPULDB 5%
Age 55
Best SL PrimeUL JH MULX 5% PL MVPULDB 8%
2nd SL PrimeUL JH MULX 2% PL MVPIUL(fa) 5%
Std SL PrimeUL JH MULX 4% PL MVPIUL(fa) 9%
Age 65
Best SL PrimeUL PL MVPIUL(fa) 5% JH MULX 8%
2nd SL PrimeUL JH MULX 2% PL MVPIUL(fa) 3%
Std SL PrimeUL PL MVPIUL(fa) 3% JH MULX 3%
Age 75
Best SL PrimeUL PL MVPIUL(fa) 2% JH MULX 7%
2nd SL PrimeUL PL MVPIUL(fa) 1% JH MULX 3%
Std SL PrimeUL JH MULX 3% PL MVPIUL(fa) 3%
Single-Pay to Endow at age 120
Rank
Age/Class #1 Product #2 Product %Inc. #3 Product %Inc.
Age 45
Best JH AUL09 JH MULX 0% SL PrimeUL 7%
2nd PL MVPULDB PL MVPIUL(fa) 0% JH AUL09 1%
Std SL PrimeUL PL MVPULDB 3% PL MVPIUL(fa) 3%
Age 55
Best SL PrimeUL JH MULX 5% JH AUL09 6%
2nd SL PrimeUL JH MULX 2% PL MVPIUL(fa) 5%
Std SL PrimeUL JH MULX 4% PL MVPIUL(fa) 8%
Age 65
Best SL PrimeUL PL MVPIUL(fa) 6% JH MULX 7%
2nd SL PrimeUL JH MULX 3% PL MVPIUL(fa) 4%
Std SL PrimeUL JH MULX 2% PL MVPIUL(fa) 4%
Age 75
Best SL PrimeUL PL MVPIUL(fa) 7% JH MULX 7%
2nd SL PrimeUL JH MULX 4% PL MVPIUL(fa) 5%
Std SL PrimeUL JH MULX 1% PL MVPIUL(fa) 6%
Top 3 Premium Solve Summary for Moderate Commission Matches
*Term blending not offered on this product and commissions in this scenario
October 2010 Competitive Intelligence Report 11
Commission Match: Match commissions to the product with the highest maximum term compensation. Products included: All M Carrier current assumption UL products.
Level-Pay to $1 at age 120
Rank
Age/Class #1 Product #2 Product %Inc. #3 Product %Inc.
Age 45
Best SL PrimeUL JH PUL10* 4% JH MULXperf* 6%
2nd JH PUL10* JH MULXperf* 2% SL PrimeUL 2%
Std SL PrimeUL PL MVPULDB 6% JH MULX 9%
Age 55
Best JH PUL10* SL PrimeUL 1% JH MULXperf* 1%
2nd JH PUL10* JH MULXperf* 1% SL PrimeUL 3%
Std SL PrimeUL JH MULX 5% JH MULXperf* 7%
Age 65
Best SL PrimeUL JH MULXperf* 2% JH PUL10* 3%
2nd PL MVPULDB SL PrimeUL 1% JH MULX 1%
Std PL MVPULDB SL PrimeUL 1% PL VFPRO2DB 3%
Age 75
Best PL MVPIUL(fa) SL PrimeUL 1% PL MVPULDB 1%
2nd PL MVPULDB PL MVPIUL(fa) 0% JH MULXperf* 3%
Std PL MVPULDB SL PrimeUL 4% PL MVPIUL(fa) 4%
Appendix E
Top 3 Premium Solve Summary for Low Commission Matches
10-Pay to Endow at age 120
Rank
Age/Class #1 Product #2 Product %Inc. #3 Product %Inc.
Age 45
Best SL PrimeUL JH PUL10* 0% JH MULXperf* 4%
2nd JH PUL10* JH MULXperf* 2% SL PrimeUL 4%
Std SL PrimeUL JH MULX 7% PL MVPULDB 8%
Age 55
Best JH PUL10* JH MULXperf* 2% SL PrimeUL 2%
2nd JH PUL10* JH MULXperf* 1% SL PrimeUL 3%
Std SL PrimeUL JH MULX 4% JH MULXperf* 6%
Age 65
Best SL PrimeUL JH PUL10* 3% JH MULXperf* 4%
2nd SL PrimeUL PL MVPIUL(fa) 1% JH MULX 2%
Std SL PrimeUL PL MVPIUL(fa) 1% JH MULX 4%
Age 75
Best PL MVPIUL(fa) SL PrimeUL 1% JH MULXperf* 3%
2nd PL MVPIUL(fa) SL PrimeUL 3% JH MULXperf* 3%
Std PL MVPIUL(fa) SL PrimeUL 0% JH MULX 4%
Single-Pay to Endow at age 120
Rank
Age/Class #1 Product #2 Product %Inc. #3 Product %Inc.
Age 45
Best JH PUL10* JH MULXperf* 4% JH AUL09 6%
2nd JH PUL10* JH MULXperf* 4% SL PrimeUL 8%
Std SL PrimeUL JH MULXperf* 5% PL MVPULDB 5%
Age 55
Best JH PUL10* JH MULXperf* 3% SL PrimeUL 5%
2nd JH PUL10* JH MULXperf* 3% SL PrimeUL 6%
Std SL PrimeUL JH MULXperf* 4% JH MULX 5%
Age 65
Best SL PrimeUL JH PUL10* 2% JH MULXperf* 3%
2nd SL PrimeUL JH PUL10* 2% JH MULXperf* 2%
Std SL PrimeUL PL MVPIUL(fa) 2% JH MULXperf* 4%
Age 75
Best SL PrimeUL JH MULXperf* 4% PL MVPIUL(fa) 4%
2nd SL PrimeUL JH MULXperf* 2% PL MVPIUL(fa) 2%
Std SL PrimeUL PL MVPIUL(fa) 3% JH MULX 3% *Term blending not offered on this product and commissions in this scenario