INVESTIGATION
General Triallelic Frequency Spectrum Under
Demographic Models with Variable Population Size
Paul A. Jenkins,* Jonas W. Mueller,†and Yun S. Song‡,§,1
*Department of Statistics, University of Warwick, Coventry CV4 7AL, United Kingdom,†Department of Electrical Engineering and Computer Science, Massachusetts Institute of Technology, Cambridge, Massachusetts 02139, and‡Department of Statistics and
§Computer Science Division, University of California, Berkeley, California 94720
ABSTRACTIt is becoming routine to obtain data sets on DNA sequence variation across several thousands of chromosomes, providing unprecedented opportunity to infer the underlying biological and demographic forces. Such data make it vital to study summary statistics that offer enough compression to be tractable, while preserving a great deal of information. One well-studied summary is the site frequency spectrum—the empirical distribution, across segregating sites, of the sample frequency of the derived allele. However, most previous theoretical work has assumed that each site has experienced at most one mutation event in its genealogical history, which becomes less tenable for very large sample sizes. In this work we obtain, in closed form, the predicted frequency spectrum of a site that has experienced at mosttwomutation events, under very general assumptions about the distribution of branch lengths in the underlying coalescent tree. Among other applications, we obtain the frequency spectrum of a triallelic site in a model of historically varying population size. We demonstrate the utility of our formulas in two settings: First, we show that triallelic sites are more sensitive to the parameters of a population that has experienced historical growth, suggesting that they will have use if they can be incorporated into demographic inference. Second, we investigate a recently proposed alternative mechanism of mutation in which the two derived alleles of a triallelic site are created simultaneously within a single individual, and we develop a test to determine whether it is responsible for the excess of triallelic sites in the human genome.
B
ECAUSE of the recent advances in DNA sequencing tech-nologies, it has become feasible to obtain data on se-quence variation across tens of thousands of chromosomes (e.g., Coventryet al.2010; Keinan and Clark 2012; Nelson et al.2012; Tennessenet al.2012) and hence to study the impact of variants of very low population frequency. Classi-cal models underlying population genetic studies have typ-ically assumed that each site is affected by at most one mutation event in the genealogical history relating a sample, but for very large samples this assumption is less tenable. One must then account for sites experiencing repeat muta-tions, which skew the site frequency spectrum and can gen-erate triallelic and even quadra-allelic sites. Triallelic sites are therefore becoming increasingly common, appearing asa few percent of segregating sites in large-scale resequenc-ing studies, particularly as the threshold on maskresequenc-ing sites below a given minor allele frequency is being reduced. There are now examples of studies that have found an association between a triallelic single-nucleotide polymorphism (SNP) and a disease phenotype, including coronary heart disease (Crawfordet al.2006) and inflammatory bowel disease (dis-cussed in Hüebneret al.2007).
Triallelic sites also have potential use in inference, using frequency spectrum data. The observed frequency spectrum ofdiallelicsites is well recognized as an important summary of genomic data, maintaining a great deal of the information encapsulated by the full data while being relatively simple to interpret. It is therefore well studied: The effects of a host of modeling assumptions on the frequency spectrum have been investigated and many theoretical predictions have been made, typically using either coalescent-based or diffusion-based mod-els. For example, one can obtain analytic results incorporating the effects of a population of varying size (Griffiths and Tavaré 1998; Wooding and Rogers 2002; Polanski and Kimmel 2003; Polanskiet al.2003), selection (Griffiths 2003), and population subdivision with instantaneous migration events (Chen 2012).
Copyright © 2014 by the Genetics Society of America doi: 10.1534/genetics.113.158584
Manuscript received October 10, 2013; accepted for publication November 6, 2013; published Early Online November 7, 2013.
Supporting information is available online athttp://www.genetics.org/lookup/suppl/ doi:10.1534/genetics.113.158584/-/DC1.
1Corresponding author: Department of Electrical Engineering and Computer Sciences,
The Poisson random field framework of Sawyer and Hartl (1992) is attractive in this respect because of its amenability to the incorporation of natural selection (Sawyer and Hartl 1992; Bustamante et al. 2001). This and other diffusion-based approaches can also be extended to obtain numerical solutions for more complicated underlying population de-mographic histories, including a single population of vari-able size (Williamsonet al.2005; Evans et al.2007; Boyko et al.2008) or a hierarchy of splitting subpopulations with restricted migration between them (Gutenkunstet al.2009; Luki´c et al. 2011; Luki´c and Hey 2013). Essentially, one writes down the Kolmogorov forward equation for the un-derlying diffusion approximation and then obtains a numer-ical solution usingfinite differences (Williamsonet al.2005; Evanset al.2007; Gutenkunstet al.2009) or spectral meth-ods (Luki´cet al. 2011; Luki´c and Hey 2013). Examples of inference using the frequency spectrum such as these are important because they can help us learn about recent hu-man population history, estimate the strength of natural se-lection, and calibrate our expectations prior to a disease association study. However, none of these approaches make use of the information from triallelic sites since they rely on an infinite-sites assumption in which triallelic sites are never observed (although see Desai and Plotkin 2008; Song and Steinrücken 2012; Steinrücken et al. 2013). There have been some extensions to incorporate recurrent mutations into the theory of the frequency spectrum (Sargsyan 2006; Hobolth and Wiuf 2009; Jenkins and Song 2011; Bhaskar et al. 2012), but with the exception of Sargsyan (2006) these all assume a simple demography of a stationary, pan-mictic population of constant size.
In this article, we obtain a closed-form expression for the sample frequency spectrum of a site that has experienced two mutation events, under an extension of the standard coalescent model that allows for very general assumptions about the distribution of times between coalescence events. This allows us to obtain predictions for the shape of the frequency spectrum, allowing for both recurrent mutations and varying historical population size.
To emphasize the usefulness of our results, we consider two applications. First, we investigate the sensitivity of the triallelic frequency spectrum to the assumed demographic history. In particular, our interest is in the following question: How much power to distinguish between different demo-graphic models do we gain by looking at a triallelic, rather than diallelic, site? In a manner quantified further below, we show that although triallelic sites are far less abundant than diallelic sites, they have rather greater value per sitein cap-turing the effects of demographic history.
This application relies on a frequency spectrum in which the two mutation events arose independently during the genealogical history of the site. Recently, however, Hodgkinson and Eyre-Walker (2010) noted that there are approxi-mately twice as many triallelic sites in the human genome as would be expected by chance. They explored a number of potential explanations and ultimately favored the idea of
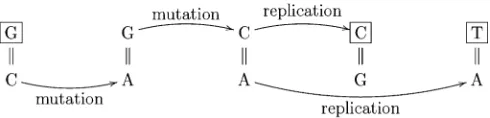
a new mutational mechanism: namely, the simultaneous generation of two new alleles due to mutation within a sin-gle individual. Although the precise mechanism is unknown, they suggest the instability of base mismatches as a plausible explanation. For example, a mutation of a G = C base pair to an unstable G = A mismatch could give rise to a further mutation to C = A. DNA replication of this mismatch means the ancestral G = C has given rise to both a derived A = T and a derived C = G base pairing (Figure 1). Another possi-bility is that both strands of the DNA duplex mutate simulta-neously due to a chemical or a radiation event. As a second application of our results, we design and implement a fre-quency spectrum-based test for the hypothesis that a subset of triallelic sites was generated by a simultaneous mutation event within a single individual, giving rise to the two derived alleles. The test allows us to account for variable historical population size explicitly, and when we do so we do notfind evidence in favor of the existence of such a mechanism (al-though, as we discuss below, it is likely that this is further confounded by population subdivision in the samples used).
This article is organized as follows. In the following section we first introduce some notation and summarize some previous results. We then obtain closed-form for-mulas for a triallelic frequency spectrum under a general model of coalescence times distributions. In the sections thereafter we consider two applications. First, we perform an extensive simulation study to discern between the sensitivities of diallelic and triallelic frequency spectra to the underlying demographic model. Second, we obtain the triallelic frequency spectrum under the proposed simultaneous-mutation mechanism of Hodgkinson and Eyre-Walker (2010), and develop a likelihood ratio test to compare it with the null triallelic frequency spectrum under independently-occurring mutations. The test is ap-plied to sequence data taken from the Environmental Ge-nome Project (NIEHS SNPs 2011) and the SeattleSNPs project (SeattleSNPs 2011) to examine whether some fraction of the triallelic sites in these datasets are in fact the product of simultaneous mutations.
Notation and Previous Results
In this section we introduce our notation and summarize some existing results. Denote byN0the diploid effective population
size in the present generation and by uthe probability of
a mutation event at a given locus per meiosis. For simplic-ity we assume throughout that the “locus”is a single site, although we note that the theory extends easily to other loci that may be of interest. Let u= 4N0ube the
popula-tion-scaled mutation rate, which we take to befixed in the usual diffusion limit asN0/N. In this limit and on a
time-scale of 2N0 generations, we denote by Nt the effective
population size at time tback in the past, which we take to be a nonrandom function of time such that Nt 1 so
that a coalescent limit exists for all times (see Slatkin and Hudson 1991 and Griffiths and Tavaré 1994 for details). We assume a generalK-allele mutation model with muta-tion transimuta-tion matrixP= (Pij), so thatPijis the probability
forward in time of a mutation taking allele i to allele j, given that a type imutated. It is usual to treatP(and K) as fixed and known. We further denote bya 2{1,. . .,K} the ancestral allele at the site of interest and byn= (n1, n2,. . .,nK) the unordered sample configuration taken from
that site, with total sample sizen¼PKi¼1ni. A unitKvector
whosekth entry is 1 and all other entries are 0 is denoted byek. Finally, letEsdenote the event that there were
pre-ciselysmutation events at the site in the genealogical his-tory relating the sample.
The sample frequency spectrum can be obtained first byfinding the probability of the observed sample confi g-uration under the assumptions of an appropriate coales-cent model. This may be partitioned according to the number of mutation events in the genealogical history relating the sample. However, for humans the average per-generation mutation rate for SNPs is small; recent studies estimate that on averageu1.231028(Campbell et al.2012; Konget al.2012). Classical population genetics results on the frequency spectrum can be obtained formally by conditioning on precisely one mutation event in the history of the site and then letting u/0. Denoting the ancestral and derived alleles in a diallelic model respec-tively by a and b, it is well known (Watterson 1975; Fu 1995; Griffiths and Tavaré 1998) that for a constant pop-ulation size, Nt [N0, and a sample configuration of the
formn= (na,nb),
fðiÞ:¼ lim
u/0ℙ½ðna;nbÞ¼ðn2i;iÞ jE1¼ i21 Pn21
j¼1j21
; (1)
since ℙ½ðna;nbÞ ¼ ðn2i;iÞ;E1 ¼ui21þOðu2Þ: We refer to
the quantityf(i) as thesamplefrequency spectrum [as distin-guished from the density of the expected number of mutations at each frequencyx2(0, 1) in a population of genomes com-prising many polymorphic sites, which is also referred to as the (site) frequency spectrum]. Throughout this work we obtain the sample frequency spectrum in afinite-alleles model and in the limit asu/0, after conditioning on the required number of mutation events (for triallelic sites, at least two mutation events are of course necessary). In fact, the result (1) is usually obtained by positing a model ofinfinitely many sitesof muta-tion and thenfinding the distribution of the number of copies
of the mutant allele at any random position at which a muta-tion occurred. Because we condimuta-tion on looking at a mutant site, this distribution is equivalent to that of a finite-alleles model at afixedsite and conditioned on one mutation event, with the implicit assumption thatPaa= 0 so that the overall
rate of mutation in the two models is the same.
There are two extensions to the above result that are relevant to the present work. The first is to general coalescent trees in which the collection of intercoalescence times,T= (Tn,Tn21,. . .,T2) is not necessarily given by the
standard sequence of independent, exponentially distrib-uted random variables. In a standard coalescent model we have that the timeTkduring which there existkdistinct
ancestors to the sample satisfies TkExp
k 2
on the co-alescent timescale. However, certain extensions to this model yield a more complicated distribution forTbut leave the topological structure of the tree otherwise unchanged. In this setting, Griffiths and Tavaré (1998) have obtained the following result: Under a coalescent model with gen-eral intercoalescence times Tand conditional on precisely one mutation event at a given site, the sample frequency spectrum is given by
fðiÞ ¼ Pn
k¼2a ðn2i;iÞ k EðTkÞ Pn
k¼2bkEðTkÞ
; (2)
where akðn2i;iÞ¼ ððn2i21Þ!ði21Þ!=ðn21Þ!Þkðk21Þ
n2k i21
andbk =k. One application of this result is to a
coalescent model with a nonconstant population sizeNt. The
distribution for Tdoes not have a simple form, but an ex-pression for E(Tk) is given by Griffiths and Tavaré (1998),
and an expression for the marginal density ofTkis given by
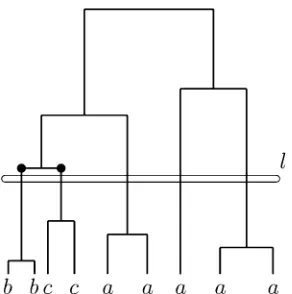
Wooding and Rogers (2002), Polanski et al. (2003), and Polanski and Kimmel (2003). In the Appendix we provide a new proof of (2), to illustrate our general strategy. For now we merely remark that the topological structure of any poly-morphic site having experienced precisely one mutation event in its genealogical history must be of the form shown in Figure 2. Coalescent trees of this form are studied in de-tail by Wiuf and Donnelly (1999).
A second extension of (1) is to allow for two mutation events at a polymorphic site. In this case we must consider the exact form of the mutation transition matrix P. In par-ticular, it may allow for the second mutation to revert a de-rived allele to its ancestral state (abackmutation) or for the second mutation to create a second independent copy of the extant derived allele (aparallelmutation). Such mutations do not give rise to triallelic sites, whereas in practice we typically identify sites having experienced two mutations only when three alleles are actually observed. Thus, in extending the definition of the sample frequency spectrum to triallelic sites, we condition onobservingthree alleles, an event we denote O3, rather than E2. Jenkins and Song
(2011) have obtained the following result: Under a standard coalescent model with Nt [ N0 the triallelic sample
fðna;nb;ncÞ:¼ lim
u/0ℙðn¼naeaþnbebþncecjO3Þ;
¼1 C
PabPbcdðna;nb;ncÞþPacPcbdðna;nc;nbÞ
þPabPac
1
nbnc2dðna;nb;ncÞ2dðna;nc;nbÞ i
;
(3)
where
C¼ "
P
x6¼a P
y6¼a;x PaxPxy
#
Hnþ1n22
þ
" P
x6¼a P
y6¼a;x PaxPay
# ðHn21Þ2
2 2
Hðn22Þ1
2 2Hn21nþ2
;
and
dðna;nb;ncÞ ¼ðnaþnbÞðn1aþnb21Þ
3h1þn nc2
2nðHn2Hnc21Þ naþnbþ1
i ;
Hm¼P m
j¼1 1
j;
Hmð2Þ¼ Pm
j¼1 1 j2:
In the above expressiona,b, andcare distinct alleles with na+nb +nc=n;ais the ancestral allele andbandc are
derived alleles. We setH0:= 0 by convention. If the
diago-nal ofPis zero, then the sums involvingPinCrespectively simplify to [12(P2)
aa] and [12(PPT)aa]. (That this
sim-plification requires the diagonal ofP to be 0 was inadver-tently omitted from Jenkins and Song 2011, Corollary 6.1.)
General Triallelic Frequency Spectrum
In this section we obtain a closed-form expression for the sample frequency spectrum of a triallelic site under a general coalescent model with variable population
size,Nt. This generalizes (2) to the case of two mutation
events at a single site and generalizes (3) to the case of a variable population size. Our arguments and notation are similar to those in Jenkins and Song (2011), and a brief proof is deferred to an Appendix. In that article, a key observation is that the eventE2can be partitioned
as follows:
E2N: The two mutation events are genealogically nested. E2N N: The two mutation events are genealogically
non-nested and at least one of them does not reside on the basal (adjacent to the root) branches of the tree. E2ℬ: The two mutation events reside on the two different
basal (adjacent to the root) branches of the tree. E2S: The two mutation events reside on the same branch of
the tree.
Only thefirst two cases can lead to a triallelic site, and so we do not consider the last two any further. It is straightforward to obtain analogous generalizations for the last two cases, although we omit them. The events E2N andE2N N are illustrated in Figure 3. In these
exam-ples, the older of the two mutation events gives rise to the alleleband the younger gives rise to the allelec, and the subsets of E2N andE2N N satisfying these constraints are
denoted by Eð2Nb;cÞandE2N Nðb;cÞ ;respectively. Tofind the sam-ple frequency spectrum wefirst consider the joint proba-bility of observing our triallelic sample with each of these events.
Lemma 1.Let naea+nbeb+ncecdenote a triallelic sample
as in (3). Under a coalescent model with time-dependent pop-ulation size Nt,the joint probability of such a sample together
with the way the two mutations are placed on the coalescent tree satisfies
ℙn¼naeaþnbebþncec;Eð2bN;cÞ
¼u2 4PabPbc
P naþnbþ1
k¼3 P k21
j¼2 Cðna;nbÞ
j;k E
TjTk þO
u3;
(4)
Figure 3 Coalescent trees with two mutations. (A) Two nested muta-tions. (B) Two nonnested mutamuta-tions. The allele of each leaf is annotated. Also annotated are variables determining the number of each type at the times of the mutation events; for example, in A we havem= 1,ly= 3, and
lo= 3.
ℙn¼naeaþnbebþncec;E2ðbN N;cÞ
¼u2 4PabPac
P naþnbþ1
k¼3 Pk
j¼2 Fðna;nbÞ
j;k E
TjTk þOu3;
(5)
asu/0. Furthermore,
ℙE2ðbN;cÞ¼u 2
4PabPbc
Xn
k¼3 X k21
j¼2 Dj;kE
TjTk þO
u3; (6)
ℙEð2bN N;cÞ
¼u2
4PabPac
Xn
k¼3 Xk
j¼2 Gj;kE
TjTk þOu3: (7)
The coefficients in the above expressions are
Cðna;nbÞ j;k ¼
P k22
l¼j21
na21 l21
nb21 k2l22
k2j k212l
n21 k21
21
3
k21 k2l
21 jðj21Þ;
Dj;k¼j
k
k22 j21
2ðj21Þ
k21
j
k21 j21
21 ;
Fðna;nbÞ j;k ¼
P k22
l¼ðj22Þ∨1
na21 l21
! nb21 k2l22
! k2j k222l
!
3 n21
k21
!21 k21
lþ1
!21 jðj21Þ
1þdj;k ;
Gj;k¼
kðj21Þ2 2dj;2 k21
1 1þdj;k; wheredj,kdenotes the Kronecker delta.
Proof. See theAppendix. h
From Lemma 1, we can obtain our main result in a straightforward manner.
Theorem 1. Let naea + nbeb + ncec denote a triallelic
sample as above: a, b, and c are distinct alleles with na +
nb+ nc= n;a is the ancestral allele and b and c are derived
alleles. Under a coalescent model with time-dependent popula-tion size Ntand in which mutation events occur independently
in the tree,the sample frequency spectrum is
f0ðna;nb;ncÞ:¼ lim
u/0ℙðn¼naeaþnbebþncecjO3Þ;
¼
Pn k¼3
Pk j¼2g
ðna;nb;ncÞ j;k E
TjTk Pn
k¼3 Pk
j¼2kj;kE
TjTk
; (8)
where
gðna;nb;ncÞ
j;k ¼
PabPbcCjð;nka;nbÞþPabPacFjð;nka;nbÞ
Ifk#naþnbþ1g þPacPcbCjð;nka;ncÞþPabPacFjð;nka;ncÞ
Ifk#naþncþ1g;
kj;k¼ 2 4X
x6¼a X
y6¼a;x PaxPxy
3 5Dj;kþ
2 4X
x6¼a X
y6¼a;x PaxPay
3 5Gj;k;
andI{}denotes the indicator function.
Proof. As in Jenkins and Song (2011, Theorem 6.2), this follows from
ℙðnjO3Þ¼ℙðn;O3;E2Þ ℙðO3;E2Þ
þOðuÞ;
¼ ℙðn;Eð2bN;cÞÞþℙðn;Eð
c;bÞ 2NÞþℙðn;Eð
b;cÞ 2N NÞþℙðn;Eð
c;bÞ 2N NÞ
hP x6¼a
P y6¼a;xℙðE
ðx;yÞ 2NÞ
i
þhPx6¼aPy6¼a;xℙðE2ðxN N;yÞÞ i
þOðuÞ:
Now substitute for each term on the right-hand side using Lemma 1 and letu/0.
Thus, while the frequency spectrum for a site experienc-ing one mutation event depends only on thefirst moments of the elements of T [see (2)], the frequency spectrum for a site experiencing two mutation events depends only on the second moments of the elements ofT (Theorem 1). These moments are considered in further detail by Polanskiet al. (2003) and Zˇivkovi´c and Wiehe (2008). Under a suitable choice of historical population size function, Nt, the
fre-quency spectrum given by (8) serves as our null model for triallelic sites. As a check on (8), we canfix the population size,Nt [N0, so that
ETjTk ¼
1þdj;k j
2
21 k 2
21 :
Inserting this expression into (8) leads to (3), after extensive simplification.
While this article was under review we learned of related work by Sargsyan (2006), who also obtains an expression for the frequency spectrum of a site experiencing two mu-tation events under an arbitrary distribution onT(Sargsyan 2006, Lemma 34). Our work strengthens his result, which relies on higher-order and exponential moments of the ele-ments ofT. Our work also allows for a more general model of mutation and disentangles the relative contributions of nested and nonnested mutations.
Application I: Sensitivity to Demography
In this section, we compare the frequency spectrum of a diallelic site with that of a triallelic site. Given a sample taken from a population whose recent history is described by a demo-graphic modelM1, we can measure the information that is lost
if one erroneously applies the frequency spectrum according to another modelM0. To quantify this difference in information,
we employ the Kullback–Leibler (KL) divergence, a measure defined for this task (Kullback and Leibler 1951; Burnham and Anderson 2002). We define the KL divergence from M1 to
M0by
DðM1kM0Þ¼EM1
logfM1ðnÞ
fM0ðnÞ
;
where fMi is the appropriate sampling distribution under modelMiandEMdenotes expectation with respect to
ran-dom samplesndrawn under modelM. Thus, KL divergence is the expected likelihood ratio when testing an alternative
M1against a nullM0and the alternative is true. Although
KL divergence properly refers to distributions under these models rather than to the models themselves, when we refer to the divergence between two models, it should be clear from the context that we are referring to either their diallelic or their triallelic sample frequency spectrum.
We focus on the divergence from one model of population growth to another. The KL divergence (amount of information
loss) can thus be compared for samples from a diallelic sitevs. samples from a triallelic site. A larger value of KL divergence for triallelic sites would suggest that such sites are potentially very informative for demographic inference. Throughout this section, a symmetric mutation matrix is used in the frequency spectra calculations (i.e., it is assumed that all transitions between alleles are equally likely). To illustrate how diver-gences vary at different scales, we focus our analysis on fre-quency spectra for samples of 10 and 100 individuals [a typical magnitude of sample sizes in demographic inference studies (Williamsonet al.2005; Gutenkunstet al.2009)].
The effect of sample size in simulations
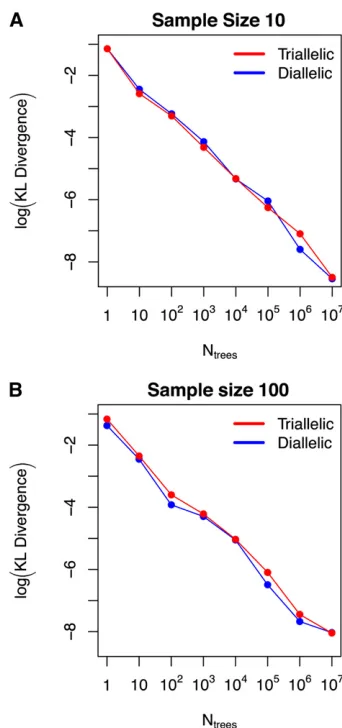
To compute frequency spectra under general models of historical population size we need first- and second-order moments of T(cf. Equation 2 and Theorem 1). We precom-pute these by simulating coalescent trees, using ms (Hudson 2002). To investigate the effect of sample size in simulations and of the differing dimensions of the two frequency spectra, wefirst consider the case of a constant population size (i.e., Nt[N0), for which the expected frequency spectra are known
in closed form (see Equations 1 and 3). Specifically, we compute the KL divergence from the expected frequency spectrum com-puted exactly to the expected frequency spectrum obtained by simulation ofNtreesto approximate thefirst- and second-order
moments ofT. The results are shown in Figure 4. Although it might be considered unfair to compare KL divergences in dia-llelic frequency spectra (one-dimensional distributions) with those between triallelic spectra (two-dimensional distribu-tions), Figure 4 clearly shows that these divergences exhibit extremely similar behavior as we increaseNtrees. The degree to
which the true spectrum is approximated by its Monte Carlo counterpart is almost exactly the same in the di- and triallelic cases, regardless of the choice ofNtrees. We also note that for
both di- and triallelic spectra, the KL divergences have similar magnitude between sample sizes 10 and 100 for all choices of
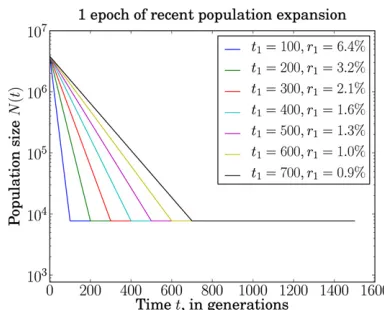
Figure 5 Seven models of exponential population growth examined in our analysis. Models 1–7 correspond to growth curves with the onset of growth occurring fromt1= 100 generations ago tot1= 700 generations
Ntrees. Thus, KL divergence appears to be a good measure of
the difference between two frequency spectra that is relatively invariant to the differences in dimensionality and sample size in our study. Because Figure 4 illustrates that usingNtrees=
106results in negligibly small divergences (on the order of
1028) from the true (closed-form) frequency spectra, wefix Ntrees= 106in the remainder of this section.
Exponential growth
Next, we examine how sampling from a population with historical exponential growth affects the resulting frequency spectrum. As specified in Figure 5, we investigate seven models of exponential growth,Gi,i= 1,. . ., 7 (withG0
rep-resenting a population of fixed size). To compute their respective moments of intercoalescence times, wefirst sim-ulate 106trees from populations according to each model. In
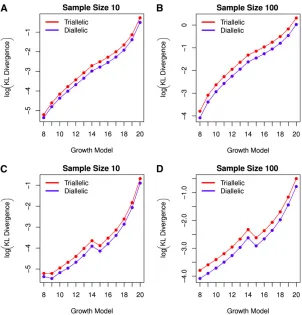
Figure 6, A and B, we compute the KL divergence D(Gik G0)
of the sample frequency spectrum underG0from the sample
frequency spectrum underGi, fori= 1,. . ., 7. To investigate
the potential benefit of triallelic spectra in fine-tuning be-tween two population growth models with different degrees of exponential growth, we also compute KL divergences D(Gi k Gi21) of sample frequency spectra under growth
modelGi21from growth modelGi, fori= 1,. . ., 7 (Figure
6, C and D).
Figure 6 demonstrates clear superiority of using triallelic spectra to distinguish between demographic models with vary-ing degrees of exponential population growth. The mean KL
divergence from exponential growth model i to i2 1 is in-creased by 87% when triallelic spectra are used in place of diallelic spectra for samples of size 10 (and the divergence is increased by 99% for sample size 100). This indicates that triallelic sites contain information that may significantly in-crease our ability to discern between competing exponential growth models with similar parameters.
Instantaneous growth
We next investigate in further detail the effect of sample size on KL divergence from a growth model to a model of fixed population size. For the growth model we assumed a function of historical human population growth as inferred by Williamson et al.(2005), who assumed an instantaneous expansion of the population from an ancestral size nN0to a modern size N0
a time t ago. Using data from the Environmental Genome Project and working within the framework of the Poisson ran-domfield model (Sawyer and Hartl 1992), Williamsonet al. (2005) inferred maximum-likelihood estimates (MLEs) of ^
n¼0:160 and^t¼0:00885;the latter in units of 2N0
gener-ations. (The authors estimatedN051,340 directly by
com-paring polymorphism and divergence data, in which case the latter estimate is calibrated as^t¼908 generations or, further assuming a 20-year generation time,^t18;200 years.) We denote this model by GW. Thus, given samples that actually
stem from a population such as the one described by Williamson et al.(2005), the KL divergenceD(GWk G0) quantifies the
ability to distinguish that these samples do not come from
Figure 6 KL divergence from one model of exponential population growth to another. A and B depict the (base 10 log) KL divergenceD(Gik G0) of the sample frequency spectrum taken from a population under growth modelGi from the sample frequency spectrum taken from a popu-lation offixed size (G0). C and D depict the (base 10 log) KL divergenceD(Gik Gi21) of the sample frequency
a fixed-size population. This analysis therefore studies the effect of sample size on the ability to perform inference of population growth parameters under realistic settings in a problem of great interest, for both di- and triallelic sites.
Figure 7 illustrates that the KL divergence using triallelic spectra for the two models is much greater, for any sample size, than the divergence using the corresponding diallelic spectra. Furthermore, we see that the increase in KL diver-gence that results from the presence of the third allele at a triallelic site also grows with increasing sample size, at least up to sample sizes of 25, before leveling off beyond 25 and providing a consistent97% increase in KL divergence.
We further address the effect of the parameters of a model of instantaneous population size change, as follows. Adopting
GW as a reference point, we examine variations in the two
parametersnandt. First, the amount of instantaneous growth is varied while keeping the time of the size change fixed to same value as GW(see models 8–20 in Table 1), and
subse-quently, different times of size-change occurrence are exam-ined while the amount of instantaneous growth isfixed so that the prechange population size is 15% of the postchange size (models 21–29 in Table 1).
Repeating the steps of our analysis of the exponential growth models, we computed KL divergencesD(Gik G0) for i= 8,. . ., 29 (Figure 8, A and B, and Figure 9, A and B), and to investigate the potential benefit of triallelic spectra in the more subtle problem of distinguishing between two instanta-neous population growth models with different degrees of growth, we computed D(Gi k Gi21) for each i = 9,. . ., 20
andi= 22,. . ., 29 (Figure 8, C and D, and Figure 9, C and D). From Figure 8 and Figure 9, we againfind that KL diver-gence from the spectrum under one growth model to another is larger when we use a triallelic, rather than diallelic, sample frequency spectrum, although this advantage fades as the time of the sudden size change is moved extremely far into the past while the amount of instantaneous growth is kept constant (as in models 21 and 22 in Figure 9). The advantage of the tri-allelic sample frequency spectrum is even more pronounced for sample size 100 than for sample size 10. The mean KL divergenceD(Gik Gi21) (overi= 8,. . ., 20; see Figure 8, C
and D) is increased by 79% when triallelic spectra are used in place of diallelic spectra for samples of size 10 (and this di-vergence is increased by 97% for sample size 100). For models 21–29 (Figure 9, C and D, the mean KL divergence D(Gi k
Gi21) is increased by 56% through the inclusion of the third
allele for samples of size 10 (and the divergence is increased by 83% for sample size 100). Thus, the inclusion of the third allele in triallelic spectra contains information that may con-siderably increase our power to discern between competing instantaneous growth models with similar parameters.
Application II: Simultaneous Mutation Model
Theory
As discussed above, Hodgkinson and Eyre-Walker (2010) pro-pose that there exists another mechanism of mutation
respon-sible for the observed excess of triallelic sites in samples of human genomes: the simultaneous generation of two new alleles within a single individual. It is estimated that this mechanism is responsible for the generation of 3% of all human SNPs. In support of this hypothesis they developed a phylogenetic statistic to test whether the two minor alleles of a triallelic site are closer to each other on a reconstructed phylogenetic tree than would be expected by chance. Using this test, they find significant evidence at the 5% level for proximity of the minor alleles when probabilities are com-bined across all triallelic sites in their data, although the null hypothesis of two independent mutation events is rejected at a rate close to the nominal 5% when each of 113 triallelic sites is tested independently. There are, however, some limi-tations to this test. First, as Hodgkinson and Eyre-Walker (2010) observe, phylogenies are reconstructed using local haplotype information but ignoring the confounding effects of recombination. Second, it uses the mean branch length between leaf nodes subtended by minor alleles as an indirect measure of the branch length between the minor alleles themselves. Finally, it uses the proximity of two mutation events on the phylogeny as evidence for what is in fact a stricter hypothesis ofcolocation. In this section we use our results on the triallelic frequency spectrum to develop a com-plementary test that does not suffer from these issues. Our approach is to find the sample frequency spectrum as pre-dicted by the simultaneous mutation mechanism and then to compare it with the results of Theorem 1 via a likeli-hood-ratio test. It will be clear that the two spectra give very different predictions, particularly with regard to the expected number of singleton alleles in a sample.
The key observation that enables us to obtain the frequency spectrum under this model is as follows. Suppose there exists a mechanism whereby two new alleles are produced within a single individual, such as that described in the Introduction:
Figure 7 KL divergence D(GWk G0) from a population model with the
A single DNA duplex within a diploid cell experiences sub-sequent mutations of both of the nucleotides within a base pair. The duplex then undergoes replication so that two new alleles are produced (Figure 1). Now, the two alleles are observed in a sample taken from the population in the present day. The individual responsible for the creation of these alleles must have been an ancestor of individuals in the sample carrying either of the derived alleles. Moreover, this ancestor was the most recent common ancestorof any pair of individuals carrying the two distinct derived alleles. The genealogy relating the sample at this site must be of the form illustrated in Figure 10; in particular, the simultaneous mutation event coincides with the coalescence node uniting the two clades defined by individuals carrying the two derived alleles. We can therefore condition on this coincidence event in deriving the sample frequency spectrum under this model, by choosing uniformly among then21 coalescence nodes. As noted by Hodgkinson and Eyre-Walker (2010), the probability that both products of a single human meiosis leave descendants in the following generation is negligible, so the posited simultaneous mutation event is presumed to occur during the mitotic phase of germ-line development.
In its full generality, the mutations under this model are parameterized by aK3
K 2
transition matrixQ= (Qi,{j,k})
whose (i,{j,k})th entry specifies the probability that a simul-taneous mutation affecting alleleigives rise to allelesjand k. For notational simplicity we assumeQi,{j,k}= 0 ifi,j,kare
not all distinct—it is straightforward to make the appropri-ate modifications to relax such an assumption. In this setting we have the following theorem.
Theorem 2. Let naea + nbeb + ncec denote a triallelic
sample,and let Es9denote the event that there were s instances
of the mechanism of simultaneous mutation in the genealogi-cal history relating the sample. Then the sample frequency spectrum is
fSðna;nb;ncÞ ¼ℙn¼naeaþnbebþncecjO3;E19;
¼Qa;fb;cg 2n
n22
1
ðn2na21Þðn2naÞðn2naþ1Þ:
(9)
Proof. See theAppendix.h
We remark that in the above we conditioned onE19;
equiv-alently one could introduce a rate parameter for the occur-rences of simultaneous mutations and then let it go to zero after conditioning on O3 only, in which case none of E29, E39,. . .contributes to the frequency spectrum.
Importantly, the frequency spectrum in (9) depends on the distribution of topologies of coalescent trees but not on the
distribution ofT. Thus, Theorem 2 continues to apply when we allow a general distribution of intercoalescence times as in the null model, and in particular this includes a model of variable population size,Nt. To summarize: Under a model in which the
population size Ntis allowed to vary in time, the sample
fre-quency spectrum of a triallelic site is given by (8) when the two mutation events occur independently and by (9) when they occur simultaneously within a single individual. An exam-ple of the two spectra is shown in Figure 11. Clearly, the largest difference occurs in the frequency class of double singletons, (na,nb,nc) = (n22, 1, 1), which contributes 0.37 of the total
probability mass under the simultaneous mutation mechanism compared with 0.09 when the two mutations occur indepen-dently along the tree. Other nearby configurations in which both derived alleles are at very low frequency are also over-represented according to the simultaneous mutation mecha-nism by comparison with independent mutations, while configurations in which one or both derived alleles are at mod-erate frequency are slightly underrepresented. This underrep-resentation is greatest for frequencies of the form (na, 1, nc)
and (na,nb, 1),i.e., along the axes in Figure 11.
Likelihood-ratio test of independent vs. simultaneous mutation
Our goal now is to test for a relative excess of triallelic sites that conform to the frequency spectrum of the simultaneous mutation mechanism. We take as our null hypothesis that each triallelic site was generated by two independent mutation events, so that the frequency spectrum is given byf0(Equation
8). An appropriate alternative is that some fraction,l.0, of triallelic sites arose as the result of a simultaneous mutation event. Under this model, the sample frequency spectrum is given by the mixture
flðna;nb;ncÞ ¼ ð12lÞf0ðna;nb;ncÞ þlfSðna;nb;ncÞ: (10)
Suppose we observe Mtriallelic sites, and the ith site has configuration ðnðaiiÞ;n
ðiÞ bi;n
ðiÞ
ciÞ: If each pair of sites is suffi
-ciently far apart that their genealogical histories are inde-pendent, then a likelihood-ratio statistic for these data is
L¼
QM i¼1f^l
nðaiiÞ;n
ðiÞ bi;n
ðiÞ ci
QM i¼1f0
nðaiiÞ;n
ðiÞ bi;n
ðiÞ ci
; (11)
where l^ is a MLE for l, with 0#^l#1: We reject the null hypothesis at levelaif Llies within the 100(12a)th per-centile tail of its null distribution. Unfortunately, the null
Table 1 Twenty-two models of instantaneous population size increase fromnN0toN0at afixed historical time pointt
Model 8 9 10 11 12 13 14 15 16 17 18 19 20 21 22 23 24 25 26 27 28 29
n 0.9 0.8 0.7 0.6 0.5 0.4 0.3 0.25 0.2 0.15 0.1 0.05 0.01
t 1.0 0.5 0.1 0.05 0.01 0.005 0.001 0.0005 0.0001
In models 8–20 the timetisfixed at the same value as in the human population growth model proposed by Williamsonet al.(2005) (t= 0.0044 in units of 4N0generations),
distribution of 22 ln L does not tend toward the usual
x2
1-distribution due to the possibility that the mixture
pa-rameterllies on the boundary of its permissible set (Self and Liang 1987). We thus employ bootstrap estimation to determine the null distribution of the test statistic by simula-tion (further described in supporting informasimula-tion,File S1).
Our aim is to apply this test to empirical SNP data, so we takeK= 4 with alleles {A, C, G, T}. However, to apply the test we must also specify both transition matricesPandQ. WhileP can be estimated by, for example, using the empirical frequen-cies of each type of mutation event inferred from diallelic SNPs and their corresponding outgroup alleles (Chan et al. 2012), there is no guidance on how to chooseQ. In fact, we do not expect the test to be greatly influenced by theidentities of the three alleles at a site compared to the information con-tained in the sample counts themselves. Therefore we choose to eliminate the appearance of the entries ofQinL by con-ditioningon the identities of the observed alleles at each site. Formally, we replaceO3in the definitions above withOð
a;b;cÞ 3 ,
the event that three alleles are observed and these alleles are a,b, andc, withaancestral. This leads to the slightly modified test statistic L~, obtained by replacing the appearances of fS
andf0in each of (10) and (11) with ~
fSðna;nb;ncÞ ¼ℙ
n¼naeaþnbebþncecjO3ða;b;cÞ;E19
;
~
f0ðna;nb;ncÞ ¼ lim
u/0ℙ
n¼naeaþnbebþncecjOð a;b;cÞ 3
:
By repeating the reasoning that led to expressions forfSand f0, we obtainf~S fromfSby dividing byQa,{b,c}in (9) and
~
f0 fromf0by replacingkj,k in (8) with
~
kj;k¼ ½PabPbcþPacPcbDj;kþ ½2PabPacGj;k:
The resulting test statisticL~is independent ofQand is more robust thanLto the choice ofP.
Data
To apply our test to SNP data wefirst need to specifyP, and to do this we followed the procedure described in Chanet al. (2012). Their method requires empirical counts of each type of diallelic SNP with the ancestral allele at each SNP spec-ified, as well as the overall abundance of each nucleotide in the genome. To obtain empirical diallelic SNP data we used the Genome Variation Server (v6.01) (GVS 2011). We obtained each diallelic SNP from the GVS database, discard-ing those for which the orthologous chimpanzee allele was unavailable or did not match any of the human alleles. To restrict our attention to neutral mutation events occurring at a typical genomic rate, we further discarded SNPs at which one of the alleles would produce a CpG dinucleotide; we discarded SNPs residing in coding regions; and to keep our estimate of P independent of the test data set we dis-carded sites at which more than two alleles were observed. Assuming that the chimp carries the ancestral allele at each site polymorphic in humans and that each remaining SNP represents a single mutation event from the ancestral to the
Figure 8 KL divergence from one model of instantaneous population growth to another. A and B depict (base 10 log) KL divergence D(Gik G0) of the sample frequency
spectrum taken from a population under growth model
Gifrom the sample frequency spectrum taken from a pop-ulation offixed size (G0), for eachi= 8,. . ., 20. C and D
depict (base 10 log) KL divergence D(Gi21 k Gi) of the sample frequency spectrum taken from a population un-der growth modelGifrom the sample frequency spectrum taken from a population under growth modelGi21, fori=
derived allele, we were left with the following counts of each type of mutation event:
NA/T¼2299 NA/C¼1886 NA/G¼7226 NT/A¼2238 NT/C¼6956 NT/G¼1960 NC/A¼2819 NC/T¼9940 NC/G¼2395 NG/A¼9931 NG/T¼2870 NG/C¼2394:
These counts can be converted to rates of mutation by comparison with the overall genomic abundance of each type of nucleotide, which were obtained from the University of California, Santa Cruz Genome Browser (hg19) (Kent et al. 2002), after excluding both CpG dinucleotides and the Y chro-mosome and weighting the counts for the X chrochro-mosome by 3/ 4. This left the following counts of each type of nucleotide in the human genome: NA = 835,878,173 (30.1%), NT =
836,874,687 (30.0%),NC= 552,795,868 (19.9%), andNG=
553,090,147 (19.9%). Using these values together with the mutation counts given above, we obtained the following empir-icalPmatrix, using the method described in Chanet al.(2012):
A T C G
P¼
A T C G
0 B B @
0:503 0:100 0:082 0:315 0:097 0:515 0:303 0:085 0:186 0:655 0:002 0:158 0:654 0:189 0:158 0
1 C C A:
We reanalyzed the triallelic data set of Hodgkinson and Eyre-Walker (2010, their Table S1), which comprised 113
triallelic sites. These were in turn obtained from 896 nuclear genes sequenced as part of the Environmental Genome Pro-ject (NIEHS SNPs 2011) and the SeattleSNPs proPro-ject (Seat-tleSNPs 2011), which provide high-quality resequencing data, avoiding problems such as ascertainment bias. Only sites of high quality (Q. 25), outside CpG dinucleotides, and outside coding regions were included in the data. Orthologous chimpanzee alleles corresponding to each site in the data were kindly provided to us by Alan Hodgkinson, CHU Sainte-Justine, Montréal, Canada; sites for which the chimp allele was unavailable were excluded from our anal-ysis, leaving M= 96 triallelic sites. Since these sites origi-nate from different experiments using different population panels, the sample size varied across sites. The minimum, mean, and maximum sample sizes across the 96 triallelic sites were 71, 160, and 190, respectively.
To computeL, the required formulas are given in terms of the joint momentsE[TjTk], and as before we precompute
these numerically. This precomputation step can be reused for different choices of land across segregating sites with the same sample size, and so it does not add to the compu-tational burden significantly.
The most striking feature of the historical human population size is its recent rapid growth (Keinan and Clark 2012). To examine this, we used the modelGWof Williamson et al. (2005) as described above. Computing the MLE l^
under this demographic model yielded l^¼0; conflicting with the conclusions of Hodgkinson and Eyre-Walker
(2010). This illustrates the importance of accounting for demographic changes when using frequency spectrum data; had we assumed a population of constant size we wouldfind ^
l¼0:21 (P,0.001; seeFile S1, in which we also examine the robustness of this result to assumptions aboutPand to potential sequencing errors), in better agreement with Hodgkinson and Eyre-Walker’s (2010) estimate ofl0.5. The decrease in the value of our estimated mixture param-eter can be explained by the fact that singleton sites—and, similarly, doubly singleton triallelic sites—are relatively more probable under a null model with population growth than one without. Thus, the abundance of doubly singleton sites that previously gave rise to an extreme likelihood-ratio statistic is now explicable under the null model.
A further potential complication of the data used here is population subdivision with migration between subpopula-tions. Analytic results for the frequency spectrum under complex demography are unavailable, even ignoring the issue of recurrent mutations (but for recent progress on this problem see Chen 2012), and so inFile S1we further inves-tigate this issue by a simulation study. We findl^¼0:16; al-though the lack of availability of subpopulation labels with the data renders the result nonsignificant (P0.42;File S1).
Discussion
In this article we have obtained closed-form expressions for the frequency spectrum of a site experiencing two mutation events, of which triallelic sites are an important example, and have allowed for the possibility of a varying historical population size; the results generalize those of Griffiths and Tavaré (1998) and Jenkins and Song (2011). We applied our formulas to the question of the ability of the frequency spectrum to discern between closely related models of pop-ulation growth and to the question of the mechanism of mutation that gives rise to triallelic sites.
Demographic inference from SNP data has thus far relied solely on diallelic sites. As sample sizes in sequencing studies grow with the falling cost of the technology, it is likely that an ever-increasing fraction of segregating sites found will be triallelic. In this article, we have illustrated that the triallelic sampling frequency spectrum is more sensitive to historical population size changes under both exponential and instanta-neous growth models, and thus it seems likely that improved estimates of population growth parameters may be obtained by incorporating this growing number of triallelic sites in demographic inference analyses. Furthermore, the increased sensitivity of the triallelic spectrum over the diallelic spectrum to discern between different growth models becomes more exaggerated as sample sizes are increased. While triallelic sites remain relatively rare compared to diallelic ones, the above analysis suggests that they are more valuable per site in distinguishing between a variety of demographic models. We hope that the ability of triallelic sites to fine-tune between competing growth models will be especially useful when looking at recentsuperexponentialgrowth (Keinan and Clark 2012), although convenient software for this type of growth is not yet available.
We also found the frequency spectrum under a model in which the two derived alleles of a triallelic site may be generated simultaneously (Hodgkinson and Eyre-Walker 2010), and we have developed a likelihood-ratio test for the existence of such a mechanism. This approach is parameter-ized by the mixture parameterlthat represents the fraction of triallelic sites having arisen as a result of the simultaneous mutation mechanism. Assuming a simple randomly mating
Figure 10 A coalescent tree with one simultaneous mutation event. The allele of each leaf is annotated. Also annotated is the variablel(here,l= 5), the number of lineages ancestral to the sample just prior to the simultaneous mutation event.
Figure 11 The triallelic sample frequency spectrum when muta-tions occur (A) independently and (B) simultaneously, for a sam-ple of sizen= 20. In this example there areK= 3 allelesa,b, andc, with uninformative mutation ma-trices Pab¼Pac¼Pbc¼Pcb¼12;
and Qa,{b,c}= 1. The population
population of constant size, wefind a MLE of^l¼0:21;which is significantly nonzero. We show that another explanation for the excess of doubly singleton triallelic sites is rapid recent population growth, but when we posit a realistic demographic model that includes population subdivision and migration as well as recent growth, we find only a minor adjustment to ^
l¼0:16;supporting the idea that at least some triallelic sites were generated as the result of a simultaneous mutation event. This latter estimate is not, however, significantly differ-ent from 0, a state of affairs we can at least partly attribute to a considerable loss of power—the individuals sampled at a substantial fraction of triallelic sites in our data set are lack-ing subpopulation labels. [In particular, none of the triallelic sites of the form (n(i) 22, 1, 1) remained triallelic after
re-moving from the sample individuals of unknown origin.] Because of the lack of power associated with the available data, we treat these results with caution and do not rule out the possibility that at least some sites were generated by a mechanism of simultaneous mutation. Indeed, most of the information about a mechanism generating an excessive number of triallelic sites is contained in the absolutenumber of triallelic sites observed in the human genome. We did not use this quantity; instead we conditioned on the observed numberMof triallelic sites and addressed a slightly different question: Given the excessive number of triallelic sites in the genome, is the frequency spectrum of some fraction of these sites consistent with the two derived alleles being generated simultaneously within a single individual? Even if this prop-osition is rejected, the question of why there is such an excess of triallelic sites remains. We are hopeful that the com-ingflood of (subpopulation-labeled) genomic data will enable us to address these questions with much improved power.
One lesson of our work is that rare alleles are as vital when looking at triallelic sites as when looking at diallelic ones; singleton alleles atdiallelicsites are already the focus of other coalescent-based tests of neutrality (Fu and Li 1993; Achaz 2009). While earlier genotyping projects often chose to exclude sites below a given minor allele frequency, typi-cally 5%, more recent trends—improved sequencing tech-nologies, larger sample sizes, and an interest in rare variants in their own right (Cirulli and Goldstein 2010; Coventry et al. 2010; Keinan and Clark 2012; Nelson et al. 2012; Tennessenet al.2012)—should serve to make the appropri-ate data more readily available. As this trend continues, we expect our results tofind further use as recurrent mutations manifest themselves more and more commonly.
Acknowledgments
We thank Christoph Theunert for helpful discussions and Alan Hodgkinson for providing ancestral allele information to ac-company the triallelic site data. We also thank John Wakeley for helpful suggestions for improving the exposition of this article. This research is supported in part by National Institutes of Health grant R01-GM094402, an Alfred P. Sloan Research Fellowship, and a Packard Fellowship for Science and Engineering.
Literature Cited
Achaz, G., 2009 Frequency spectrum neutrality tests: one for all and all for one. Genetics 183: 249–258.
Bhaskar, A., J. A. Kamm, and Y. S. Song, 2012 Approximate sam-pling formulae for general finite-alleles models of mutation. Adv. Appl. Probab. 44: 408–428.
Boyko, A., S. H. Williamson, A. R. Indap, J. D. Degenhardt, R. D. Hernandez et al., 2008 Assessing the evolutionary impact of amino acid mutations in the human genome. PLoS Genet. 4(5): e1000083.
Burnham, K. P., and D. R. Anderson, 2002 Model Selection and Multi-Model Inference: A Practical Information-Theoretic Ap-proach, Ed. 2. Springer-Verlag, Berlin/Heidelberg, Germany/ New York.
Bustamante, C. D., J. Wakeley, S. Sawyer, and D. L. Hartl, 2001 Directional selection and the site-frequency spectrum. Genetics 159: 1779–1788.
Campbell, C. D., J. X. Chong, M. Malig, A. Ko, B. L. Dumontet al., 2012 Estimating the human mutation rate using autozygosity in a founder population. Nat. Genet. 44(11): 1277–1281. Chan, A. H., P. A. Jenkins, and Y. S. Song, 2012 Genome-wide
fine-scale recombination rate variation in Drosophila mela-nogaster. PLoS Genet. 8(12): e1003090.
Chen, H., 2012 The joint allele frequency spectrum of multiple pop-ulations: a coalescent approach. Theor. Popul. Biol. 81: 179–195. Cirulli, E. T., and D. B. Goldstein, 2010 Uncovering the roles of rare variants in common disease through whole-genome se-quencing. Nat. Rev. Genet. 11: 415–425.
Coventry, A., L. M. Bull-Otterson, X. Liu, A. G. Clark, T. J. Maxwell
et al., 2010 Deep resequencing reveals excess rare recent var-iants consistent with explosive population growth. Nat. Com-mun. 1: 131.
Crawford, D. C., C. L. Sanders, X. Qin, J. D. Smith, C. Shephard
et al., 2006 Genetic variation is associated with C-reactive pro-tein levels in the Third National Health and Nutrition Examina-tion Survey. CirculaExamina-tion 114: 2458–2465.
Desai, M. M., and J. B. Plotkin, 2008 The polymorphism fre-quency spectrum offinitely many sites under selection. Genetics 180: 2175–2191.
Evans, S. N., Y. Shvets, and M. Slatkin, 2007 Non-equilibrium theory of the allele frequency spectrum. Theor. Popul. Biol. 71: 109–119.
Fu, Y.-X., 1995 Statistical properties of segregating sites. Theor. Popul. Biol. 48: 172–197.
Fu, Y.-X., and W.-H. Li, 1993 Statistical tests of neutrality of mu-tations. Genetics 133: 693–709.
Griffiths, R. C., 2003 The frequency spectrum of a mutation, and its age, in a general diffusion model. Theor. Popul. Biol. 64: 241–251. Griffiths, R. C., and S. Tavaré, 1994 Sampling theory for neutral alleles in a varying environment. Philos. Trans. R. Soc. Lond. B Biol. Sci. 344: 403–410.
Griffiths, R. C., and S. Tavaré, 1998 The age of a mutation in a general coalescent tree. Stoch. Models 14: 273–295. Gutenkunst, R. N., R. D. Hernandez, S. H. Williamson, and C. D.
Bustamante, 2009 Inferring the joint demographic history of multiple populations from multidimensional SNP frequency data. PLoS Genet. 5(10): e1000695.
GVS, 2011 Genome Variation Server 134, August 2011.http:// gvs.gs.washington.edu.
Hobolth, A., and C. Wiuf, 2009 The genealogy, site frequency spectrum and ages of two nested mutant alleles. Theor. Popul. Biol. 75: 260–265.
Hudson, R. R., 2002 Generating samples under a Wright-Fisher neutral model of genetic variation. Bioinformatics 18: 337–338. Hüebner, C., I. Petermann, B. L. Browning, A. N. Shelling, and L. R. Ferguson, 2007 Triallelic single nucleotide polymorphisms and genotyping error in genetic epidemiology studies: MDR1
(ABCB1) G2677/T/A as an example. Cancer Epidemiol. Bio-markers Prev. 16(6): 1185–1192.
Jenkins, P. A., and Y. S. Song, 2011 The effect of recurrent mu-tation on the frequency spectrum of a segregating site and the age of an allele. Theor. Popul. Biol. 80(2): 158–173.
Keinan, A., and A. G. Clark, 2012 Recent explosive human pop-ulation growth has resulted in an excess of rare genetic variants. Science 336(6082): 740–743.
Kent, W. J., C. W. Sugnet, T. S. Furey, K. M. Roskin, T. H. Pringle
et al., 2002 The human genome browser at UCSC. Genome Res. 12(6): 996–1006. Available at: http://genome.ucsc.edu (hg19, August 2011).
Kong, A., M. L. Frigge, G. Masson, S. Besenbacher, P. Sulemet al., 2012 Rate ofde novomutations and the importance of father’s age to disease risk. Nature 488(7412): 471–475.
Kullback, S., and R. A. Leibler, 1951 On information and suffi -ciency. Ann. Math. Stat. 22: 79–86.
Luki´c, S., and J. Hey, 2013 Demographic inference using spectral methods on SNP data, with an analysis of the human out-of-Africa expansion. Genetics 192: 619–639.
Luki´c, S., J. Hey, and K. Chen, 2011 Non-equilibrium allele frequency spectra via spectral methods. Theor. Popul. Biol. 79: 203–219. Nelson, M. R., D. Wegmann, M. G. Ehm, D. Kessner, P. St. Jean
et al., 2012 An abundance of rare functional variants in 202 drug target genes sequenced in 14,002 people. Science 337 (6090): 100–104.
NIEHS SNPs, 2011 NIEHS Environmental Genome Project. Univer-sity of Washington, Seattle. Available at:http://egp.gs.washington. edu. Accessed: August 2011.
Polanski, A., and M. Kimmel, 2003 New explicit expressions for relative frequencies of single-nucleotide polymorphisms with application to statistical inference on population growth. Genet-ics 165: 427–436.
Polanski, A., A. Bobrowski, and M. Kimmel, 2003 A note on dis-tributions of times to coalescence, under time-dependent pop-ulation size. Theor. Popul. Biol. 63: 33–40.
Sargsyan, O., 2006 Analytical and simulation results for the gen-eral coalescent. Ph.D. Thesis, University of Southern California, Los Angeles.
Sawyer, S. A., and D. L. Hartl, 1992 Population genetics of poly-morphism and divergence. Genetics 132: 1161–1176.
SeattleSNPs, 2011 SeattleSNPs. NHLBI Program for Genomic Ap-plications, SeattleSNPs, Seattle. Available at: http://pga.gs. washington.edu. Accessed: August 2011.
Self, S. G., and K.-Y. Liang, 1987 Asymptotic properties of maxi-mum likelihood estimators and likelihood ratio tests under non-standard conditions. J. Am. Stat. Assoc. 82(398): 605–610. Slatkin, M., and R. R. Hudson, 1991 Pairwise comparisons of
mitochondrial DNA sequences in stable and exponentially grow-ing populations. Genetics 129: 555–562.
Song, Y. S., and M. Steinrücken, 2012 A simple method forfi nd-ing explicit analytic transition densities of diffusion processes with general diploid selection. Genetics 190: 1117–1129. Steinrücken, M., Y. Wang, and Y. S. Song, 2013 An explicit
tran-sition density expansion for a multi-allelic Wright-Fisher diffu-sion with general diploid selection. Theor. Popul. Biol. 83: 1–14. Tennessen, J. A., A. W. Bigham, T. D. O’Connor, W. Fu, E. E. Kenny
et al. 2012 Evolution and functional impact of rare coding variation from deep sequencing of human exomes. Science 337(6090): 64–69.
Watterson, G. A., 1975 On the number of segregating sites in genetical models without recombination. Theor. Popul. Biol. 7: 256–276.
Williamson, S. H., R. Hernandez, A. Fledel-Alon, L. Zhu, and C. D. Bustamante, 2005 Simultaneous inference of selection and population growth from patterns of variation in the human ge-nome. Proc. Natl. Acad. Sci. USA 102(22): 7882–7887. Wiuf, C., and P. Donnelly, 1999 Conditional genealogies and the
age of a neutral mutant. Theor. Popul. Biol. 56: 183–201. Wooding, S., and A. Rogers, 2002 The matrix coalescent and an
application to human single-nucleotide polymorphisms. Genet-ics 161: 1641–1650.
Zˇivkovi´c, D., and T. Wiehe, 2008 Second-order moments of seg-regating sites under variable population size. Genetics 180: 341–357.
Appendix
Proof of(2). The arguments given here mimic in part those found in Jenkins and Song (2011), and we refer the reader to that work for further details. In that article we work withunorderedconfigurations,n; here, the argument is easier to illustrate usingorderedconfigurations. We denote a random vector ofnalleles consistent with the unordered configurationnbyvn; by sampling exchangeability there are n!=QKi¼1ni! equiprobable such vectors. First, denote the event that a single mutation
occurred in the genealogical history relating the sample and that it gave rise to a derived allelebbyEð1bÞ. Now, inspection of
Figure 2 tells us that any particular coalescent history with leaf configurationvn and consistent withE1ðbÞ must exhibit the
following sequence of events going back in time, for somela2{1, 2,. . .,na}: a collection ofna2lacoalescence events of
typealineages and a collection ofnb21 coalescence events of typeblineages, with the two collections in some interspersed
ordering; a mutation event taking the single remaining typeblineage to a typealineage; and coalescence of the remaining la+ 1 typealineages to a most recent common ancestor of the sample.
The quantitylarepresents the number of extant lineages ancestral to samples of typeaat the time of the single mutation
event. Suppose thefirst coalescence event is between two lineages whose allele at the leaves of the tree isb; such a co-alescence occurs (among all possible coco-alescence events) with probability
nbðnb21Þ nðn21Þ :
Continuing in this vein back to the most recent common ancestor, wefind that the probability of a given sequenceCvn;la of n21 alleles corresponding to each coalescence event, which is consistent withvnand withE1ðbÞ;satisfies
ℙCvn;la
¼na!ðna21Þ!nb!ðnb21Þ!
n!ðn21Þ! laðlaþ1Þ:
For example, in Figure 2, Cvn;la¼ ðb;a;a;b;b;a;a;aÞ: In fact, for a fixed la this probability is invariant with respect to
permutations of the alleles in this sequence [i.e., with respect to the way the coalescence events are interspersed (Jenkins
and Song 2011)]. There are
n2la21
nb21
ways to intersperse thefirstn2la21 coalescence events (Jenkins and Song
2011, Lemma 3.1).
Now, givenCvn;la, we require the probability that a single mutation event occurs on the correct branch of the tree, an event
we denote byMvn:Since mutation events occur along the branches as a Poisson process of rateu/2, we have that
ℙMvnjCvn;la
¼E
u
2Lne
2ðu=2ÞLnTlaþ1 Ln
¼u
2E
Tlaþ1 þO
u2;
asu/0, whereLn ¼
Pn
j¼2jTjis the total branch length.
Putting all this together,
ℙn¼naeaþnbeb;Eð1bÞ
¼ n
nb !
ℙvn;E1ðbÞ
;
¼Pab n
nb !
Pna la¼1
n2la21 nb21
! ℙCvn;la
ℙMvnjCvn;la
;
¼uPab 2
Pna
la¼1
na21 la21
! n21
la !21
ETlaþ1 þO
u2: ðA1Þ
Summing overna, wefind
ℙEð1bÞ
¼ X
n21
na¼1
ℙðn¼naeaþnbeb;E1Þ ¼ uPab
2
X n21
la¼1
ðlaþ1ÞETlaþ1 þO
u2;
fðiÞ:¼ lim
u/0ℙ h
n¼ ðn2iÞeaþiebjEð bÞ 1
i
¼ lim
u/0
ℙhn¼ ðn2iÞeaþieb;Eð1bÞ i
ℙE1ðbÞ
;
substituting for the numerator and denominator and lettingu/0 yields the given result.h Henceforward we denote the trinomial coefficient by
n i;j;k
Proof of Lemma 1. The argument here is very similar to that of theProofof (2). This time a coalescent tree compatible with
vnand withEð2Nb;cÞmust exhibit the following sequence of events (Jenkins and Song 2011, Lemma 4.1):na2lycoalescence
events of typeaalleles,nb2mcoalescence events of typeballeles, andnc21 coalescence events of typecalleles, in some
interspersed ordering; a mutation event reverting the sole remaining typecallele to a typeb;ly2locoalescence events of
typeaalleles andmcoalescence events of typeballeles; a mutation event reverting the sole remaining typeballele to a type a; and coalescence of the remaininglo+ 1 typealineages to a most recent common ancestor of the sample.
Here, ly is the number of extant typea lineages at the time of the younger mutation event, lo is the number of type
alineages at the time of the older mutation event, andmis the number of typeblineages at the time of the younger mutation
event (Figure 3). Arguing as above, any one of the
n2ly2m21
na2ly;nb2m;nc21
mþly2lo
m
compatible sequencesCvn;m;ly;lo
satisfies
ℙCvn;m;ly;lo
¼na!ðna21Þ!nb!ðnb21Þ!nc!ðnc21Þ!
n!ðn21Þ! mðmþ1Þloðloþ1Þ;
and the two mutation events land on the correct pair of branches with probability
ℙMvnjCvn;m;ly;lo ¼E " u 2Ln 2 e2ðu=2ÞLn
2! 2
Tmþlyþ1 Ln
Tloþ1 Ln
#
¼u2
4E
h
Tmþlyþ1Tloþ1 i
þOu3:
Hence, following the reasoning that led to (A1), wefind
ℙn¼naeaþnbebþncec;Eð2bN;cÞ
¼PabPbc
n na;nb;nc
3 Pna
ly¼1 Ply
lo¼1 Pna m¼1
n2ly2m21 na2ly;nb2m;nc21
mþly2lo m
ℙCvn;m;ly;lo
ℙMvnjCvn;m;ly;lo
:
Substituting for each term in the summand and simplifying leads to (4), and summing over triallelic configurations n yields (6).
The nonnested case is similar. There are
n2m2ly21
na2ly;nb2m;nc21
mþly2lo
m21
possibleCvn;m;ly;lo (Jenkins and Song
2011, Lemma 4.2), each with probability
ℙCvn;m;ly;lo
¼na!ðna21Þ!nb!ðnb21Þ!nc!ðnc21Þ! n!ðn21Þ! ly
lyþ1loðloþ1Þ:
The two mutation events land on the correct pair of branches and are in the correct age order with probability
ℙMðvbn;cÞCvn;m;ly;lo ¼E " u 2Ln 2 e2ðu=2ÞLn
2! 2
Tmþlyþ1 Ln
Tloþ1 Ln
#
1
1þdmþly;lo
(A2)
¼u2
4
EhTmþlyþ1Tloþ1 i
1þdmþly;lo
þOu3:
The additional factor on the right-hand side of (A2) accounts for the fact that, should the two mutations arise during the same epoch (m+ly+ 1 =lo+ 1), then only with probability 1/2 is the mutation giving rise to theballele the elder one.
ℙn¼naeaþnbebþncec;Eð2bN N;cÞ
¼PabPac
n na;nb;nc
3 Pna
ly¼1 P lyþ1
lo¼1 Pnb m¼1
n2m2ly21 na2ly;nb2m;nc21
mþly2lo m21
ℙCvn;m;ly;lo
ℙMðvbn;cÞCvn;m;ly;lo
;
which yields (5) after substituting and simplifying. Summing over triallelic configurationsnyields (7).h
Proof of Theorem 2. Conditional on the eventE19, the single simultaneous mutation event occurs uniformly on then21
coalescence nodes of the coalescent tree. Hence, immediately prior to (i.e., more recently than) the coalescence event at which the mutation event occurred, there areLlineages ancestral to the present-day sample, withLUniform{2,. . .,n}. GivenL=l, it is well known (e.g., Griffiths and Tavaré 1998) that the distribution of the number of leaves subtending each of
thesellineages is uniform on the
n21
l21
possible compositions ofn. Of these,
na21
l23
compositions havenbleaves and
nc leaves, respectively, subtending the two lineages coalescing into the node that experiences the simultaneous mutation
event. Hence,
ℙn¼naeaþnbebþncec jE19;fL¼lg
¼Qa;fb;cg
na21 l23
n21
l21
;
for 3#l#n(and 0 otherwise). Also note that
ℙO3jE19
¼n22
n21:
This is the probability that the simultaneous mutation event does not occur at the oldest of the coalescence nodes (l= 2), which would lead to a sample containing no copies of the ancestral allele.
Putting all this together we have
ℙn¼naeaþnbebþncec jO3;E19
¼ℙ
n¼naeaþnbebþncec;O3 jE19
ℙðO3 jE19Þ ;
¼
Pn l¼2ℙ
L¼l jE19
ℙn¼naeaþnbebþncec;O3 jE19;fL¼lg
ℙðO3jE19Þ ;
¼n21
n22
Xn
l¼3
1
n21Qa;fb;cg
na21
l23
n21
l21
21 ;
GENETICS
Supporting Information http://www.genetics.org/lookup/suppl/doi:10.1534/genetics.113.158584/-/DC1
General Triallelic Frequency Spectrum Under
Demographic Models with Variable Population Size
Paul A. Jenkins, Jonas W. Mueller, and Yun S. Song