The need for the development and deployment of reliable and efficient energy storage
devices, such as lithium-ion rechargeable batteries, is becoming increasingly important due
to the scarcity of petroleum. Lithium-ion batteries have been used for a wide range of
applications, from power tools and portable electronics to recent plug-in hybrid electric
vehicles and pure electric vehicles. Lithium-ion batteries operate via an electrochemical
process in which lithium ions are shuttled between cathode and anode while electrons flow
through an external wire to form an electrical circuit. The study showed that the
development of lithium-iron-phosphate (LiFePO4) batteries promises an alternative to
conventional lithium-ion batteries, with their potential for high energy capacity and power
density, improved safety, and reduced cost. However, current prototype LiFePO4 batteries
have been reported to lose capacity over ~3000 charge/discharge cycles or to degrade rapidly
under high discharging rates. In this thesis, we report that the mechanical and structural
failures are attributed to dislocation formations. Analytical models and crystal visualizations
provide details for further understanding the stress developments due to lithium movement
during charging or discharging. In the present study, we report three different lithium
intercalation-induced dislocation mechanisms explaining experimental observed cracks. We
use the theory of elasticity to calculate dislocation stress fields. In most cases, dislocations
are not perfectly parallel to one specific axis. Therefore, stress variations for arbitrary
dislocation directions are investigated. In addition, multiple dislocations usually co-exist and
IL), and anisotropic material properties of electrodes are employed. The results provide links
between stress fields and the observed structural failure in lithium-ion batteries. This study
contributes to the fundamental understanding of the mechanisms of capacity loss in
lithium-ion battery materials and helps the design of better rechargeable batteries, and thus leads to
© Copyright 2011 by Yixu Wang
by Yixu Wang
A thesis submitted to the Graduate Faculty of North Carolina State University
in partial fulfillment of the requirements for the degree of
Master of Science
Mechanical Engineering
Raleigh, North Carolina
2011
APPROVED BY:
_______________________________ ______________________________ Dr. Hsiao-Ying Shadow Huang Dr. Jeffery Eischen
Committee Chair
DEDICATION
To my parents: Z.G. Wang and Y.Q. Xing. Thank you for all your love, substantially
support and faith on me! I would not have made it this far without you!
This work is also dedicated to Dr. Hsiao-Ying Shadow Huang, who led me to this field as
a mentor and provided me all the valuable knowledge a researcher requires and all the golden
BIOGRAPHY
Yixu, Richard, Wang was born in Chinfeng, China, in 1987. He received the B.S. in
Major of Material Science and Engineering from Zhejiang University in 2009, where his
field of specialty was mechanical properties of ceramic and metal materials. Currently, he is
pursuing his M.S. degree in Department of Mechanical and Aerospace Engineering, North
Carolina State University. His research field is investigating structural failure mechanisms
with Li-ion batteries cathode material as the modeling system. His specialty is software
ACKNOWLEDGMENTS
First and foremost, I would like to express my profound gratitude to NCSU department of
Mechanical & Aerospace for supporting me to pursue my graduate studies in U.S. The
support has given me not only a future career, but also opportunities to be exposed to
industrial opportunities, to work on a project I am interested in, and to prepare myself to
better serve the society and the mechanical industry.
There are two people whom I would like to acknowledge individually. First, I am deeply
grateful to Professor Hsiao-Ying Shadow Huang, my thesis advisor, for her encouragement,
and careful and wise guidance of my project. Secondly, I owe a great deal to Professor
Robert T. Nagel, director of graduate program, who was fighting for my opportunity of
studying in Mechanical Engineering department.
I would also like to offer my sincerest thanks to my committee members: Dr. Jeffery W.
Eischen, for strengthening my academic achievement and wise counsel; and to Dr. Gracious
Ngaile, who always answering my inquiries so promptly and providing me valuable advices.
Many thanks are also due to my friends in this department: Jingxiao Lu, Letisha
McLaughlin, Mike Stamps, Siyao Huang, Chen-kai Chiu Huang, Siqi Xu, Jing Ouyang,
Guang Yang, Shuowei Yang, and many others who always provide me both academic and
emotional supports during the long process of completing this project.
Finally, I would like to thank all my friends in Raleigh who have always supported me. You
made my life here colorful. It would be difficult to acknowledge everyone who has in some
TABLE OF CONTENTS
LIST OF TABLES ... vii
LIST OF FIGURES ... viii
CHAPTER 1 INTRODUCTION ... 1
1.1 The Needs for Alternative Energy Solution... 1
1.2 Rechargeable Batteries as Energy Storage solution... 1
1.3 Li-ion Batteries ... 3
CHAPTER 2 THE PROSPECTIVE CATHODE MATERIALS ... 5
2.1 Power and Energy Densities: ... 8
2.2 Thermal Stability and Safety ... 10
2.3 Environmental and Cost Factors ... 11
2.4 Capacity and Rate-capacity ... 12
2.5 Summary ... 13
CHAPTER 3 AGING MECHANISMS OF ELECTRODE MATERIALS ... 17
3.1 Aging of cathode Material ... 18
3.1.1 Storage ... 19
3.1.2 State of Charge ... 21
3.1.3 Structure and Jahn-Teller Effects... 23
3.1.4 Lithium ions Diffusion and Particle Size ... 25
3.2 Aging of Anode Material ... 26
3.2.1 SEI layer formation ... 27
3.2.2 Equation of Li Lost versus Time ... 31
CHAPTER 4 DISLOCATION BASED STRESS AND FORCE DEVELOPMENT IN LiFePO4 MATERIAL ... 33
4.1 Dislocation and Burgers Vector ... 34
4.2 Development of Stress Field Calculation ... 37
CHAPTER 5 LiFePO4 CATHODE MATERIAL FRACTURE ACCOMMODATED TO DISLOCATION MOVEMENT... 65
5.1 Dislocation Movement ... 65
5.2 Lithium Ion Diffusion and Dislocation Formation ... 65
5.3.1 Edge dislocation based mode I fracture ... 67
5.3.2 Edge dislocation based mode II fracture:... 68
5.3.3 Screw dislocation based mode III fracture: ... 69
CHAPTER 6 CONCLUSION ... 71
REFERENCES ... 73
APPENDICES ... 88
Appendix A: Stress Data at Each Node in FEA Modeling and from Analytical Calculation 89 1. Nodal Element Numbering Chart: ... 89
2. Nodal Coordinates: ... 90
3. Average Nodal Stresses Computed by ANSYS: ... 94
4. Nodal Stress Calculated by Classical Elastic Theory Equation: ... 97
Appendix B: Mathematica Code for Stress and Force Calculation Code ... 100
1. Mathematica code for stress calculation with classical equation (equation 1) for single dislocation in isotropic material ... 100
2. Mathematica code for stress calculation with generalized equation (equation 2) for single dislocation in isotropic material ... 105
3. Mathematica code for stress calculation with generalized equation (equation 2) for single dislocation in anisotropic material ... 112
4. Mathematica code for stress calculation with generalized equation (equation 2) for multiple dislocation in anisotropic material ... 119
LIST OF TABLES
Chapter 2
Table 2.1: Comparison of various cathode materials, LiCoO2, LiMn2O4, LiNiO2, and LiFePO4, looking at the volumetric power/energy, gravimetric power/energy, density, decomposition temperature, and capacity loss. The capacity is measured as the hourly
(dis)charge rate for 100 cycles ... 7 Table 2.2: Volumetric and gravimetric energy density for four different types of Li-ion batteries and the comparison to USABC requirements ... 10 Table 2.3: Thermal stability characteristics and other factors in cost and environmental issues for battery materials... 12
Chapter 4
Table 4.1: Anisotropic elastic constants for olivine structure LiFePO4 material ... 52
Appendices
LIST OF FIGURES
Chapter 1
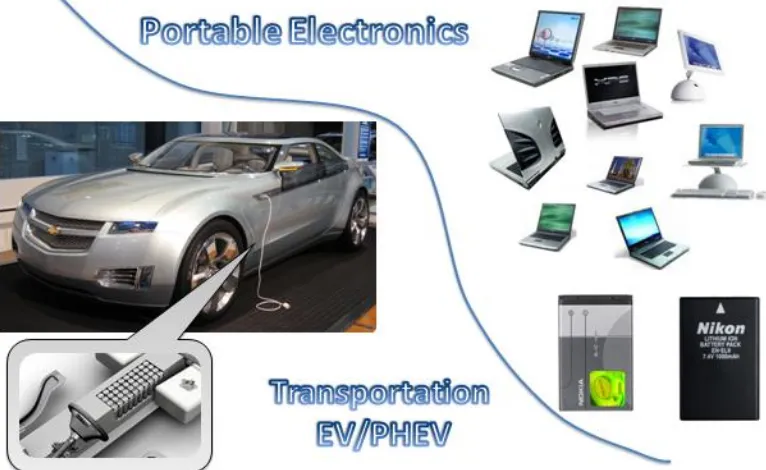
Figure 1.1: The most common Li-ion battery applications in the market are for portable
electronics, power tools, and transportation ... 2
Figure 1.2: Electrochemical processes in lithium-ion batteries during charging and discharging ... 3
Chapter 2 Figure 2.1: Three categories of host structures: (a) the layered LiMO2 with 2D lithium ion diffusion pathway (such as LiCoO2 and LiNiO2); (b) the LiMn2O4 spinels with 3D lithium ion diffusion pathway; and (c) the LiFePO4 with 1D lithium ion diffusion channel ... 6
Figure 2.2: Comparison of various cathode materials, LiCoO2, LiMn2O4, LiNiO2, and LiFePO4, looking at the volumetric power/energy, gravimetric power/energy, density, decomposition temperature, and capacity loss. The capacity is measured as the hourly (dis)charge rate for 100 cycles ... 15
Chapter 3 Figure 3.1: Electrode aging/degradation categories based on different causes and influences ... 18
Figure 3.2: The different electron losing ratio obtained by Vegard’s Law and Mossbauer spectroscopy method indicates that the loss of active material occurred ... 20
Figure 3.3: Reactions related to soluble Mn ions (Vetter, 2005) ... 22
Figure 3.4: (a) Eight LiFePO4 unit cells without dislocations where lithium ions lay in the spaces along the b(y)-direction. (b) A FeO6 octahedron and five PO4 tetrahedra connect each other by sharing one edge and three corners ... 23
Figure 3.5: An schematic diagram for Jahn-Teller effect ... 25
Figure 3.6: Formation, growth, and failure of SEI layers (Vetter, 2005) ... 28
Figure 3.7: Examples of capacity evolutions during 100% DOD cycling ... 29
Chapter 4
Figure 4.1: (a) edge dislocation and (b) screw dislocation ... 34 Figure 4.2: Determine the Burgers vector by drawing rectangular. (a) edge dislocation; (b) screw dislocation ... 36 Figure 4.3: (a) Determine Burgers vector by PLM/AFM photo. (b) determine Burgers vector by XRD picture ... 37 Figure 4.4: Observed cracks in LiFePO4 particles from SEM images (Chen, 2006) ... 39 Figure 4.5: HRTEM image of the disordered region at the end of the crack in Fig.4, with Fourier transforms of the indicated areas. (Chen, 2006) ... 39 Figure 4.6: A LiFePO4 crystal model with an infinite length edge dislocation. Edge
dislocation is along z-direction (c-direction) ... 40 Figure 4.7: Distortion zone between LFP phase and FP phase (Delmas, 2008)... 40 Figure 4.8: (a) FEA Model for our dislocation problem. (b) dislocation problem in larger scale... 46 Figure 4.9: Dislocation stress distribution plot in LiFePO4 material with isotropic property and classical equations (model A) ... 46 Figure 4.10: (a) Plot of stresses σ-xx calculated by classical equation and ANSYS model. (b) Numerical difference between two sets of stress data (Equation - ANSYS) ... 47 Figure 4.11: (a) Plot of stresses σ-yy calculated by classical equation and ANSYS model. (b) Numerical difference between two sets of stress data (Equation - ANSYS) ... 48 Figure 4.12: (a) Plot of stresses τ-xy calculated by classical equation and ANSYS model. (b) Numerical difference between two sets of stress data (Equation - ANSYS) ... 49 Figure 4.13: Comparison of stress distribution graphs from ANSYS and analytical equation ... 51 Figure 4.14: Flow chart of stress distribution plotting: from converting elastic constants to choosing modeling equations. Red: classical equation with isotropic property; purple: generalized equation with isotropic property; green: generalized equation with anisotropic property ... 54 Figure 4.15: The stress field for edge and screw dislocations. (a) Stress distribution
Figure 4.16: Representative multiple edge dislocation distributions in LiFePO4 crystals. For dislocation number 1, the Burger’s vectors is varied from (bx=1, by=0) in (a) to (bx=0,
by=0.6) in (b). Dislocation number 2 is fixed in its direction ... 57 Figure 4.17: Stress field for multiple edge and screw dislocations. (a) The stress field on the ab-plane is calculated by varying Berger’s vector directions of dislocation 1 when dislocation 2 is fixed in its direction, where the Burger’s vector of dislocation 1 is (bx=1, by=0). (b) The stress distribution between two edge dislocations for which the Berger’s vector of dislocation 1 is (bx=1, by=0.6). (c) The stress distribution between two edge dislocations for which the Berger’s vector of dislocation 1 is (bx=0, by=0.6). (d) The stress distribution between two screw dislocations for which the Berger’s vector of dislocation 1 is (bz=0.47) ... 59 Figure 4.18: The force field of dislocation interactions. The force field changes due to the direction of dislocation 2. (a) and (e): bx=1, by=0; (b) and (f): bx=1, by=0.6; (c) and (g): bx=0, by=0.6; (d) and (h): bx= -1, by=0. Equal and opposite forces act on dislocation 1. Warm color represents positive force, which means it push/pull the dislocation towards positive direction of x/y axis, and vice versa ... 63
Chapter 5
Figure 5.1: (a) LiFePO4 crystal structure of eight unit cells. (b) Lithium ions diffusion along the b-direction in LiFePO4 material during the discharging process (fill the crystal layer by layer in the a-direction) ... 66
Appendices
CHAPTER 1 INTRODUCTION
1.1 The Needs for Alternative Energy Solution
For over a century, petroleum-derived fuels have been the first choice as an energy source
for transportation, and accounted for more than 71.4% of U.S. petroleum use in 2009 [1].
Although petroleum-based fuel energy resources are convenient and technically mature,
researchers started looking for alternative energy sources such as batteries due to the shortage
of petroleum and because burning fossil fuels has become an environmental issue. It is
reported that 98% of carbon dioxide emissions come from petroleum fuels [2]. Since carbon
dioxide accounts for the largest share of greenhouse gases, to meet the stated goal of
reducing total U.S. greenhouse gas emissions to 83% below 2005 levels by 2050, an
alternative energy storage system is required.
1.2 Rechargeable Batteries as Energy Storage solution
One of the most promising energy storage solutions for future automotive technology is
the rechargeable battery. Compared with other resources such as flywheels, capacitors,
biofuel, solar cells, and fuel cells, rechargeable batteries are more portable and provide quick
energy storage and release [3-5]. Moreover, it is more difficult to use these other resources
for these other energy sources [5]. Compared with capacitors, rechargeable batteries have
lower self-discharge rates [4, 5], thus holding their charge for longer periods of time.
Therefore, to best serve as a future automotive technology, rechargeable batteries should
have both high energy and power densities [3], the ability to output high current for a long
period of time, and to be fully charged quickly. The durability and environmental
friendliness of rechargeable batteries is also very important. They should safely work for
several years under different climatic conditions, even if involved in an unfortunate car
collision. Among the rechargeable batteries, Li-ion batteries have dominated the field of
advanced power sources due to their high gravimetric and volumetric energy density [6].
The most common Li-ion battery applications in the market are for portable electronics,
power tools, and transportation (Figure 1.1).
1.3 Li-ion Batteries
Li-ion battery contains three main parts: the cathode, the anode, and the electrolyte (Fig.
1). It operates via an electrochemical process in which lithium ions are shuttled between
cathode and anode while electrons flow through an external wire to form an electrical circuit.
During discharge, an electrical circuit is formed, and lithium ions move out (extraction) from
the anode to the cathode (intercalation) to neutralize these charges (Figure 1.2). The
reactions occur continuously and while electrons continue to flow, providing electrical
energy to the connected device. The electrical energy is then restored to the battery upon
recharge.
Both anode and cathode materials exhibit layered structures, which allow lithium ions to
stay in or pass through the structures. On the cathode side, intercalated lithium compound
such as LiFePO4, LiMn2O4, and LiCoO2 are commonly used. On the anode side, layered
carbon materials (graphite or carbon nanotube) [7, 8], titanate materials [9], or silicon
nanowires [10] are widely used due to their low electrochemical potential with respect to Li
metal [11]. The most common electrolyte is a solution that contains lithium salt in an organic
solvent. To avoid unnecessary reactions between electrode materials and H/H2 or O2/H2O in
the electrolyte, an organic solvent or organic solid were adopted to replace the aqueous
solvent [11]. The current collectors, connecting to the anode and cathode, carry electrons and
transmit the current to the external circuit. The separator is a membrane that lies between the
anode and cathode to avoid the possibility of short circuit (Figure 1.2).
In following work, I provide an overview of commonly used cathode materials for Li-ion
rechargeable batteries. I will also discuss our previous works on dislocation-based stress
CHAPTER 2 THE PROSPECTIVE CATHODE MATERIALS
Four mainstream cathode materials on the present market are compared: LiCoO2,
LiMn2O4, LiNiO2, and LiFePO4. The four materials fall in three categories of host
structures: the layered LiMO2 with 2D lithium ion diffusion pathway (such as LiCoO2 and
LiNiO2) (Figure 2.1(a)), the LiMn2O4 spinels with 3D lithium ion diffusion pathway (Figure
2.1(b)), and the LiFePO4 with 1D lithium ion diffusion channel (Figure 2.1(c)) [12, 13].
LiCoO2 is in a layered structure in which the Li+ and Co3+ ions appear on the (111) planes
alternatively. The layer sequence is -O-Li-O-Co-O-, and the stacking sequence is ABCABC.
Li ions lay between CoO2 layers and could diffuse from/into the layer structure during
charging/discharging process [14]. LiCoO2 is the most commonly used in portable electronic
devices due to its excellent charging/discharging rate and power/energy density [15].
However, only 50% lithium ions could diffuse between cathode and anode reversible during
charging/discharging, which means the capacity of battery in application could only reach
50% of its theoretical capacity [14]. Also, a battery with LiCoO2 as its cathode material does
not have good thermal stability [16]. Moreover, cobalt is toxic and expensive, which makes
LiCoO2 an imperfect choice for a cathode material for electric vehicles (EVs), hybrid electric
vehicles (HEVs), and plug-in hybrid electric vehicles (PHEVs), although it is widely used in
portable devices. LiMn2O4, with a 3-dimensional spinel structure, is able to provide higher
voltage, but it does not have a good power/energy density [17]. Due to Jahn-Teller distortion
effect and Mn dissolution phenomenon during cycling, the capacity of this material fades
is not an ideal cathode material for Li-ion batteries for EV/HEV/PHEV applications. The
LiNiO2 material, with the same structure as LiCoO2, has more reversible Li ions (65%) [14],
and provides good power and energy densities [21]. However, it is difficult to order Li+ and
Ni3+ in LiNiO2. Since it is very difficult to prepare pure LiNiO2 composite, Co-doped
LiNiO2, Li1−x(Ni0.8Co0.2)1+xO2, is usually considered as an alternative material in research
and other applications [22]. Another disadvantage of this material is that the impedance
would increase when temperature rises [23].
(a) (b) (c)
Figure 2.1: Three categories of host structures: (a) the layered LiMO2 with 2D lithium ion diffusion pathway (such as LiCoO2 and LiNiO2); (b) the LiMn2O4 spinels with 3D lithium
ion diffusion pathway; and (c) the LiFePO4 with 1D lithium ion diffusion channel.
With the demand for Li-ion batteries increasing worldwide, an alternative Li-ion battery
cathode material, olivine structure LiFePO4, was developed by Goodenough in 1996 [13].
The charging/discharging process of this material is a two phase reaction that olivine host
FePO4 allows a reversible insertion of Li to LiFePO4. He and his group also discovered that
stability, and flat discharge voltage (~3.6V versus Li+/Li0). However, the two-phase
insertion reaction limits the electronic and ionic conductivity and therefore the rate capacity
where the cathode particles are too large [24-26]. LiFePO4 suffers from low intrinsic
electronic conductivity (10-10–10-9 S/cm) [27]. Based on the study by Chung and Chiang [28], the low electronic conductivity of LiFePO4 could be significantly enhanced by doping
other metal elements such as zirconium, niobium, and magnesium [28]. It could also be
solved by coating the particles with carbon [29] or other Li-permeable phase [30].
Characteristics and specifications of the aforementioned cathode materials were collected and
compared for Li-ion batteries (Table 2.1). Specifically, I focus on (1) volumetric power and
energy densities, (2) gravimetric power and energy densities, (3) stability, safety and
environmental factors, and (4) capacity and rate-capacity. Since synthetic methods are
different for the four different cathode materials, only the representative data that appeared
most frequently within the past five years were chosen to ensure that data from different
literature sources are comparable.
Table 2.1: Comparison of various cathode materials, LiCoO2, LiMn2O4, LiNiO2, and LiFePO4, looking at the volumetric power/energy, gravimetric power/energy, density, decomposition temperature, and capacity loss. The capacity is measured as the hourly (dis)charge rate for 100 cycles.
LiCoO2 LiMn2O4 LiNiO2 LiFePO4 Capacity Loss (percentage 100 cycle@1C) 85 90 N/A 92
2.1 Power and Energy Densities:
Power and energy densities are important properties for cathode materials. They
determine the energy release rate and energy storage capacity per unit weight or volume. For
electric vehicles, the volumetric power density and energy density are very important,
because with the same energy capacity, a smaller battery is easier to fit into a car. For battery
cathode materials, it is observed that LiFePO4 has the highest volumetric power density and
energy density (1236 W/L, 970 Wh/L, respectively) among the four mainstream cathode
materials [31, 32] (Table 2.1). LiCoO2 has a volumetric power density of around 767 W/L
and an energy density of around 483 Wh/L. These values are roughly half that of LiFePO4
[31, 32] (Table 2.1). LiMn2O4 has a volumetric power density and energy density (900 W/L,
785 Wh/L) higher than those of LiCoO2. However, LiMn2O4 has a slightly lower volumetric
power density and energy density than that of LiFePO4 [31, 32] (Table 2.1). The volumetric
power and energy density data of LiNiO2 were not available since pure LiNiO2 is difficult to
prepare.
In addition, the United States Advanced Battery Consortium (USABC) listed goals for
advanced batteries for EVs where volumetric power density should at least be 600 W/L and
the volumetric energy density should be at least 300 Wh/L [33] (Table 2.2). Considering
batteries as a whole (including cathode, anode, and electrolyte), current battery technologies,
however, are only able to deliver 250-360 Wh/L for LiCoO2 batteries, 330 Wh/L for
LiMn2O4 batteries, 450 Wh/L for LiNiO2 batteries, and 220 Wh/L for LiFePO4 batteries.
2006 by the USABC [33]. Note that the values reported in Table 2.1 are based on raw
materials and the values reported in Table 2.2 are batteries as a whole (including cathode,
anode, and electrolyte) with the said cathode materials.
The gravimetric power and energy densities are very important for portable devices. That
is, with the same power and energy capacity, a lighter battery is easier to carry [32, 34, 35].
It is observed that LiNiO2 has high gravimetric power and energy densities of 600 W/kgand
629 Wh/kg, respectively (Table 2.1). The gravimetric power density of LiFePO4 is reported
around 600 W/kg whereas its gravimetric energy density (495 Wh/kg) is lower than that of
LiNiO2. LiCoO2 has a gravimetric power density of around 680 W/kg and an energy density
of around 532 Wh/kg. These values are slightly higher than those of LiFePO4 [32, 34, 35]
(Table 2.1). Finally, LiMn2O4 has a gravimetric power density of around 584 W/kg and an
energy density of around 440 Wh/kg. These values are comparable to that of LiFePO4 [32,
34, 35] (Table 2.1). The density of each cathode material was also listed in Table 2.1.
LiFePO4 has the lowest density (2.2 kg/L) and LiCoO2 has the highest (5 kg/L), which is
more than twice of that of LiFePO4.
Gravimetric power/energy densities should not be directly converted to volumetric
power/energy densities based on the provided density values. This is due to the different
synthetic methods that were chosen based on different demands, and the weight of
electrolytes was sometimes included in the collected data when the gravimetric power and
energy densities were calculated. According to the USABC, gravimetric power density
should at least be 400 W/kg and the gravimetric energy density should at least be 200 Wh/kg
electrolyte), current battery technologies are only able to deliver 106-250 Wh/kg for LiCoO2
batteries, 100 Wh/kg for LiMn2O4 batteries, 192 Whkg-1 for LiNiO2 batteries, and 90-110
Wh/kg for LiFePO4 batteries. Therefore, the performance of advanced batteries falls short of
EV goals set forth in 2006 by the USABC [33].
Table 2.2: Volumetric and gravimetric energy density for four different types of Li-ion batteries and the comparison to USABC requirements.
Energy Density LiCoO2 LiMn2O4 LiNiO2 LiFePO4 USABC
Gravimetric (Wh/kg) 180 100 170 130 200
Volumetric (Wh/L) 305 330 450 220 300
2.2 Thermal Stability and Safety
The safety issue for Li-ion batteries is an important factor that determines potential
applications, especially for EV/HEV/PHEV and other electronic devices. Battery safety is
determined primarily by the material's thermal stability, and the reported overheating and
explosion of Li-ion batteries is mainly due to a battery’s thermal instability [36]. The
differential scanning calorimetry (DSC) test is widely used to investigate the exothermic or
endothermic reaction for composite explosives. It determines the ability of a material to
absorb or release heat during electrochemical reactions such as lithium insertion or extraction
in Li-ion batteries. By using DSC testing, Xia et al. [37] collected the thermal activity and
LiFePO4 has the lowest exothermic peak temperature (289oC) and exhibited endothermic
heat flow (-6 W/g). That is, during electrochemical reactions, LiFePO4 will see smaller
temperature increases than the other three cathode materials. Moreover, it is observed that
LiMn2O4 has an exothermic peak at 302oC, which can easily be reached during a car
accident. LiCoO2 and LiNiO2 also release heat and cause overheating or even explosions at
higher temperatures of around 300-400oC, suggesting that LiCoO2 and LiNiO2 as cathode
materials are an undesirable choice for energy storage systems for EV/HEV/PHEV
applications. In contrast, the electrochemical reaction of LiFePO4 is endothermic, suggesting
that LiFePO4 is a safer battery material. In general, exothermic peak temperature can be used
as a description of the self-reaction temperature. The lower the peak temperature, the safer a
material is. The decomposition temperature also indicates that LiFePO4 (950oC) has much
higher thermal stability than any other material (Table 2.1). The decomposition temperatures
for LiCoO2, LiMn2O4, and LiNiO2 are 340oC, 275oC, and 250oC, respectively (Table 2.1)
[37]. The excellent thermal stability of LiFePO4 is due to strong covalent P-O bonds in the
(PO4)3- polyanionic clusters [38].
2.3 Environmental and Cost Factors
In addition to the safety issue, I also compared the cost of cathode materials and
environmentally-related factors (Table 2.3). It could be noted that cobalt is toxic and nickel
has the potential to cause heavy metal pollution. LiFePO4 is made from non-toxic materials
made from this type of cathode material could be relatively cheaper than those made of
LiCoO2 since the transition metal storage of LiCoO2 is approximately 8.3 million tons
(0.005% of LiFePO4). The transition metal storage of LiMn2O4 and LiNiO2 are 99.7 million
and 48 billion tons, respectively. It is suggested that LiFePO4 as a cathode material for
rechargeable batteries is more environmental friendly and cost effective than the other three
cathode materials (Table 2.2).
Table 2.3: Thermal stability characteristics and other factors in cost and environmental issues for battery materials.
LiCoO2 LiMn2O4 LiNiO2 LiFePO4
Exothermic heat flow (Wg-1) 20 7 33 -6
Exothermic peak temperature (Co) 367 302 348 289
Storage of transition metal (×106 ton) 8.3 99.7 48000 160000
Battery cost expensive moderate cheap cheap
Environmental pollution toxic Co good heavy metal Ni good
2.4 Capacity and Rate-capacity
The capacity of a battery is the amount of charge available expressed in
milliampere-hours (mAh), and it depends on discharge conditions such as the magnitude of the current,
the voltage of the battery, temperature, and other factors. Rate-capacity loss after thousands
better examine the rate-capacity, four mainstream cathode materials were compared for their
retained capacity. The retained capacity of cathode materials is measured after a certain
amount of cycles at an nC discharge rate, where a rate nC corresponds to a full discharge in
1/n hours. For example, 0.25C is the rate at which a battery is totally discharged in 4 hours.
The higher the value of the rate nC, the better the energy output ability of the battery material
is. Studies showed that after 100 cycles at 1C-rate discharging, LiFePO4 processes 92%
capacity retention, LiMn2O4 processes 90%, and LiCoO2 processes 85% capacity retention,
respectively [7] (Table 2.1). By extrapolation, if the capacity retention is measured under a
higher rate (n>1), LiFePO4 has a better capability to maintain rate-capacity than do other
cathode materials. Since the preparation and synthetic methods for LiNiO2 are extremely
difficult, its capacity retention data is unavailable. Nevertheless, the rate-capacity loss of
LiFePO4 is reported after thousand-cycles high-rate discharging [39, 40]. It is observed that
under a high discharge rate, the capacity retention rate of LiFePO4 batteries is not as good as
that of other batteries.
2.5 Summary
So far I provide an overview of four mainstream lithium-ion battery cathode materials.
Characteristics of LiCoO2, LiMn2O4, LiNiO2, and LiFePO4 were collected and compared.
Base on the data above, a chart could be drawn to make the comparison more clear (Figure
2.2). The first four rows of bars from behind represent the gravimetric and volumetric energy
power densities of LiFePO4 is in the same level as the rest materials. And the volumetric
energy and power densities of LiFePO4 is higher than the rest of materials. The green bars
represent the physical densities of four materials. The density of LiFePO4 is about half as that
of the rest three materials. A material with lower density has the potential of being made to
lighter weight battery, which is good for electrical vehicle. The red bars, which indicate the
decomposition temperature, shows that the LiFePO4 could remain steady at very high
temperature (over 900oC) while the other three materials decompose at relative low
temperature (about 350oC) which could be easily reached in a car accident. Also, according
Figure 2.2: Comparison of various cathode materials, LiCoO2, LiMn2O4, LiNiO2, and LiFePO4, looking at the volumetric power/energy, gravimetric power/energy, density, decomposition temperature, and capacity loss. The capacity is measured as the hourly
(dis)charge rate for 100 cycles.
From above, I could safely reach the conclusion that LiFePO4 has the potential to become a better cathode material due to its combination of several superior properties for most
common usage. The advantages of LiFePO4 are: Relatively good energy/power density, light weight, raw materials are cheap and abundant, high thermo stability, and friendly to
electron conductivity, and high capacity loss rate under high discharging rate. To solve the
above problems, researchers are trying to optima its properties during the preparation. The
most commonly used methods developed by MIT researchers are: carbon coating, doping the
transition metal material, and minimizing the material into nano-size. Those methods solved
the problem of low conductivity. But the high capacity loss rate, which is related to
complicated aging mechanism, is still need to be solved.
In conclusion, current electrochemical technology is still limited to developing cathode
materials to achieve EV goals set by the USABC. And the main obstacle for advanced
rechargeable batteries is found in the rate-capacity loss at high C-rate discharging. It is
currently one of the most challenging issues in developing energy storage systems for
EV/HEV/PHEV, and the enhancement of rate-capacity retention is the primary design goal of
battery chemistry in the electrochemical community. The goal of my research is to learn the
mechanism of aging process and rate-capacity loss of LiFePO4 material, and try to build up a
model of structural aging mechanism. To start my research, I need to begin with learning the
CHAPTER 3 AGING MECHANISMS OF ELECTRODE
MATERIALS
Electrode failures in Li-ion batteries are usually a result of the accumulation of aging or
degradation, which affect the ability of electrodes to hold charge, and result in capacity loss
in Li-ion batteries, and the mechanism can be categorized based on storage/cycling or
chemical/mechanical activities. For anode materials, the aging/degradation mechanism is
primarily determined by the development of a solid-electrolyte interphase (SEI) film [41]; it
is a chemical reaction. For cathode materials, the aging/degradation mechanisms could be
categorized into two groups: (1) ones that cause the loss of active material via storage and
cycling, such as the chemical interaction of aging products with anodes, oxidation of
electrolyte components, and surface film formation [39, 42-45], and (2) ones that increase the
battery impedance or decrease the output voltage, such as structural changes, electrode
components changes, or materials degradation [46-48] (Figure 3.1). In general, the
aforementioned four phenomena do not happen alone and the mechanism of electrode failure
Figure 3.1: Electrode aging/degradation categories based on different causes and influences. The proposed work focuses on understanding the interplay between structural
changes and deterioration in LiFePO4 cathode material.
3.1 Aging of cathode Material
Cathode materials are considered to be the vital part of Li-ion batteries since cathode
materials affect both performance and cycling life in Li-ion batteries. Since the
anode materials, and since there are varieties of electrode materials, it is difficult to provide a
general explanation for cathode aging/degradation mechanisms in all Li-ion systems. In this
part, I focus on basic factors such as storage, state of charge, and the Jahn-Teller effect.
While storing electrode materials, aging/degradation usually occurs because of side
reactions due to the thermodynamic instability of the materials [49-52]. Moreover, the state
of charge, cycling conditions, and temperature are three main factors that cause materials to
age/degrade. Finally, cycling with kinetically-induced effects, such as volume variations and
concentration gradients, could potentially result in capacity loss in Li-ion batteries.
3.1.1 Storage
As a cathode material for Li-ion batteries, LiFePO4 is presently a promising green
material because of its low cost, non-toxicity, rich source of raw materials, and great
electrochemical performance [53]. Yet, although commonly considered to be highly stable
toward air and H2O, aging/degradation of the electrochemical performance of LiFePO4 was
shown after being exposed to air for a few weeks at ambient temperature [54]. To observe the
side reaction and side phase of LiFePO4 materials in an atmosphere of humid hot air, a
nanoscaled sample of LiFePO4 material (70 nm) in 120oC hot air was stored for 30 days. By
comparing it with a pristine sample under the X-ray Diffraction (XRD) test, the decreasing
unit-cell volume after storing at high temperature was observed, suggesting that the
delithiation occurred with hot air [55]. In a parallel study to the XRD test, the decreased
during the high temperature storage. Moreover, the amount of Fe3+ determined by
Mossbauer spectroscopy accounts for 45% of total iron, which is far more than the 11% loss
of lithium (Figure 3.2). This phenomenon indicates that while storing, in addition to the
trivalent Fe from delithiation, an amorphous ferric phosphate side-phase grows detrimentally
to the olivine LiFePO4 upon air exposure. Therefore, this loss of active material in LiFePO4
cathodes could potentially lead to capacity loss in Li-ion batteries.
3.1.2 State of Charge
In current EV/HEV/PHEV markets, LiMn2O4 has been adopted as the cathode material
for Li-ion batteries [56]. The LiMn2O4 cathode material provides higher voltage than other
materials, but its usage is limited by its short cycle life [20, 57, 58]. It is observed that the
accelerated aging/degradation of LiMn2O4 cathode materials is due to the dissolution of Mn
in electrolyte under various charging voltages: with a charging voltage higher than 4.2V or
when nearly fully discharged. During a very low state of charge or at a high temperature
(55˚C), a disproportionation reaction will occur, which consumes two Mn3+ at two Mn sites in LiMn2O4 cathode materials while Mn3+ converts to Mn2+ and Mn4+ [20, 41, 58].
2Mn(III) Mn(IV)+Mn(II)(solv.)
The Mn4+ stays in one of the two Mn sites and takes the place of Mn3+. Mn2+ ions, on the
other hand, escape from the LiMn2O4 and dissolve in the electrolyte. The empty Mn site
caused by the Mn2+ dissolution is then filled by a lithium ion. Therefore, new composite
materials Li[LixMn2-x]O4 are produced. Due to the elemental change at Mn sites in the
spinel structure, structural change happens during the dissolution. Moreover, the LiPF6,
which is dissolved in the electrolyte and acts as a conductive salt, turns to HF acid at times.
HF acid can then react with the Li[LixMn2-x]O4 material and make it soluble in the
electrolyte. After Mn2+ ions get into the electrolyte, many side reactions could be activated
[59-61]. Mn2+ dissolves from the surface in the 4-V domain to cause a capacity fade with
cycling unless ionic substitutions are introduced that reduce the capacity even further (Figure
overcharged (over 50% of Li ions escaped from the host structure), O2 will be generated
inside the sealed cell and the inside pressure will increase, which raises safety concerns [63,
64].
3.1.3 Structure and Jahn-Teller Effects
Structure failures in cathode materials caused by phase transformations during the insertion and desertion of lithium ions are primary factors that influence the aging/degradation mechanisms. A perfect eight-unit cell crystal LiFePO4 model without dislocations is shown in Figure 3.4(a) and lithium ions lay in the spaces along the b(y)-direction in the crystal. The crystal structure is made up by FeO6 octahedra, PO4 tetrahedra, and lithium ions (Fig. 4(b)). During discharging and charging, lithium ions shuttle in and out of the crystal through the spaces along the b(y)-axis and potentially lead to structural distortions or failures.
Figure 3.4: (a) Eight LiFePO4 unit cells without dislocations where lithium ions lay in the spaces along the b(y)-direction. (b) A FeO6 octahedron and five PO4 tetrahedra connect each
The olivine-type crystal structure of LiFePO4 belongs to space group Pnma, in which Li,
Fe, and P atoms occupy octahedral 4a (0, 0, 0), octahedral 4c (x, ¼, z) and tetrahedral 4c
(x,y,z) sites, respectively (Figure 3.4(a)). A FeO6 octahedron lies in the middle and is
surrounded by five PO4 tetrahedra (Figure 3.4(b)). One of the PO4 tetrahedra shares an edge
(O-O bond) with the FeO6 octahedron, and the other four share four corners respectively.
The crystal structures of LiFePO4 and FePO4 are similar except that the lattice parameter of
FePO4 is smaller than that of LiFePO4, due to differences in lattice parameters of LiFePO4
(a=10.334Å, b=6.002Å, c=4.695Å) and FePO4 (a=9.826Å, b=5.794Å, c=4.784Å); mismatch
occurs during the phase transformation. With extraction of lithium from LiFePO4, the
volume decreases by 6.8% and the density increases by 2.6% [38]. The differences in lattice
parameters could also be attributed to the different valences of Fe: the valence of Fe is +2 for
LiFePO4, and the valence of Fe is +3 for FePO4 [65, 66]. The difference in lattice parameter
could be related to the Jahn-Teller effect. It states that the relationship between metal
valences and lattice parameters can be used to justify lattice parameter changes in LiFePO4
and FePO4 [67]. In short, the outer shell electrons of an atom have a strong shielding effect
caused by charge neutralization between outer shell electrons and atomic nucleus. The
shielding effect would cancel out part of the electrostatic forces between the atomic nucleus
and the atoms around it. Changing the valence of an atom will lead to a different electron
configuration and the outer shell will have a different intensity of shielding effect in each
Fe ions changes, and then the shielding effect in different directions around the Fe ions changes; this phenomenon may cause the structure of Fe octahedra to change.
Figure 3.5: An schematic diagram for Jahn-Teller effect.
3.1.4 Lithium ions Diffusion and Particle Size
impurities and defects could attribute to inappropriate raw material ratio during synthesis or
wrong state of charge during usage. It is found that larger LiFePO4 particles are more subject
to stacking faults. The 1D channels are unlikely to be blocked by Li/Fe disorder or stacking
faults if the particles are small. Besides less blocked channel, decrease of the particle size
can also provide shorter diffusion lengths and a larger electrolyte/electrode contact area for
the Li insertion and extraction reaction, which increases the diffusion rate. Many methods
were tested to decrease the particle size. Doping carbon was found to be effective to
decrease the particle size. Carbon acts as a nucleation agent to decrease the particle size.
Moreover, the carbon acts as a reductant to avoid formation of undesirable ferric impurities
[70, 71]. It is stated that the optimal carbon content is <5 wt% [38].
3.2 Aging of Anode Material
For anode aging process, the main mechanism is the formation of solid electrolyte
interface (SEI) layer. The SEI layer is formed at the interface between electrode material and
electrolyte, where is one of the most important places in a Li-ion battery and the place that
the side reactions most likely take place. In following, the SEI layer will be discussed in
3.2.1 SEI layer formation
During the first several charging cycles of Li-ion battery, reductive electrolyte
decomposition accompanied by irreversible consumption of lithium ions takes place at the
electrode and electrolyte interface when the electrode is in the charged state. The
decomposition will build up protective thin layers on the surface of anode. The protective
layers could stop further reaction between anode material and electrolyte thus avoids further
Li-ion consumption. Also, they protect the charged electrode from corrosion.
There are two types of protective layers. The ones covered on the pores and paths that
Li-ions go through are called SEI. The SEI layers are permeable for Li-Li-ions but rather
impermeable for other electrolyte components and electrons. On the other hand, the layers
which are on the non Li-ion transportation areas are called non-SEI. The non-SEI layers have
different structure with SEI layers.[41]
Under some circumstances, such as high temperature or high end of charge voltages
positive to 4.2V versus Li/Li+, the protective layers could be dissolved or broken (Figure
Figure 3.6: Formation, growth, and failure of SEI layers (Vetter, 2005) [58]
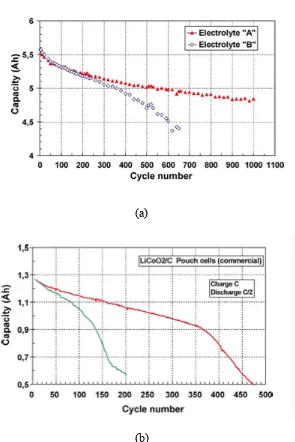
The SEI layer could protect the electrode material from corrosion. An experiment
conducted by M. Broussely agreed the above statement: They cycle the battery for over 600
times and observe the capacity loss [43]. From the data, the capacity fade rate decreases with
cycle time, resulting in stabilization with time of utilization (Figure 3.7). That is because
with the passivation layer growth, the SEI produces a more and more stable interface, thus
(a)
(b)
Figure 3.7: Examples of capacity evolutions during 100% DOD cycling.
(a) capacity loss rate decreases; (b) capacity loss rate increases. (Broussely, 2005) [43]
In some cases, the capacity loss rate increases with cycle number. However, in figure 3.6
(b), the capacity loss is due to the deposit of Li metal, which would also cause the increase of
cell impedance. This phenomenon could be explained by the progressive clogging of the
Figure 3.8: mechanism of Li deposit
If the SEI is broken, or the electrode material and electrolyte material were wrongly
chose, and reaction of forming SEI is not stabilized enough even though the SEI layer is
thick enough, the SEI layer would keep growing. The reaction products will depose in the
microposity, thus significantly reducing the active surface area. Since the total current is a
certain value, the current density will increase on the remaining available surface of the
larger pores, up to the points where the reduction rate in these areas is larger than the
maximum possible diffusion rate of Li in the graphite. Then, the exceed current will cause
the Li deposit on the surface of SEI. When this process starts, lithium plating will produce
more deposit itself and aggravates the phenmomenon, which explains the increasing of
At here, temperature decrease could accelerate the capacity fading rate by lowering the
limit at which the Li plating will occur. Increasing temperature will reduce the Li plating
limit, but it will accelerates the corrosion rate, which reduce the active area.[43]
3.2.2 Equation of Li Lost versus Time
When the battery is in storage, only the thermo stability of the components in battery
affects the capacity fade. Among the four main components, the organic electrolyte and the
Li-ion in anode material has the highest reactivity. Although the SEI layer has the ability to
protect the anode from corrosion, the layer could not be perfectly hermetic, and low rate
corrosion takes place at the surface of uncovered anode material. In 2001, M. Broussely
et.al. developed a lithium corrosion kinetic model to account for the variation of capacity loss
rate during accelerated aging on storage at high temperature. [43]
From that model, the corrosion rate is: dx k s e/
dt , where x is the number of moles of
Li being reacting, is the specific electronic semi-conductivity of the layer, s is the
interface area and e is the SEI thickness. By integration, a parabolic equation of time versus
lithium loss can be established:
2
2
0
e A
t
k s x k s x
Where A is a proportionality coefficient between the layer thickness and the amount of
lost lithium and e0 is the layer thickness at t0, after battery formation. According to his article,
CHAPTER 4 DISLOCATION BASED STRESS AND FORCE
DEVELOPMENT IN LiFePO
4MATERIAL
Based on studies of the aging/degradation mechanisms of electrode materials, several
methods to improve the stability of Li-ion battery have been developed. These include: (1)
decreasing electrolyte decomposition by surface modification and reducing specific surface
area [41, 51, 72-74], (2) neutralizing acid by adding proper additives into the electrolyte [41,
75], and (3) stabilizing the structure by doping anions and cations [76, 77]. However, among
the aforementioned methods, almost no one could predict and prevent degradations caused
by structural failures in cathodes due to lithium intercalation and extraction. Therefore, a
better understanding of the mechanism and plausible models to depict cathode material
structural failures due to lithium intercalation and extraction are required.
In some cases, such as charging/discharging too fast or unsteady charging voltage [41,
43], the moving rate of lithium ions is higher than the maximum allowed diffusion rate of
LiFePO4 cathode material. Under that circumstance, lithium ion diffusion would not be well
organized and might create incomplete or extra lithium ion planes in FePO4 structure. Thus
dislocations will be generated due to the half atom planes.
In this chapter, previous works on dislocation-based stress fields are discussed and stress
distributions in LiFePO4 cathode materials are provided. I chose LiFePO4 as our model
system due to: (1) It is recognized that LiFePO4 is a promising cathode material for Li-ion
batteries, thus understanding stress accumulations inside the material is important for
with anisotropic elastic material properties. Once I successfully build up a model system for
this sophisticated material, I will then be able to provide a general mathematical framework
for other Li-battery cathode materials, such as LiCoO2, LiMnO2, and LiNiO2.
4.1 Dislocation and Burgers Vector
As Li ions leave the parent phosphate, the formation of FePO4 generates strong dislocation
stress fields in the lattice which could lead to the generalization of dislocation. A dislocation
is a crystallographic defect or irregularity, within a crystal structure. Two main types of
dislocation exist: edge dislocation (Figure 4.1(a)) and screw dislocation (Figure 4.1(b)).
Dislocations found in real materials typically are mixed, meaning that they have
characteristics of both.
(a) (b)
The Burgers vector is a vector that denotes the magnitude and direction of lattice
distortion associated with a dislocation. To obtain the vector's magnitude and direction, I
should start with a perfect crystal structure, which has no dislocation or other defects. In the
perfect crystal structure, a rectangle whose lengths and widths are integer multiples of "L"
(the unit cell length) is drawn encompassing the site of the original dislocation's origin. Once
this rectangle is drawn, the dislocation can be introduced. Since the dislocation will deform
the perfect crystal structures near it, the rectangle around it will be affected as well. What
was once a rectangle before the dislocation was introduced is now an open geometric circle,
whose opening defines the direction and magnitude of the Burgers vector (Figure 4.2). The
Burgers vector can be used to identify both magnitude and the nature of a dislocation. If the
Burgers vector is parallel to the dislocation line, this indicates a screw dislocation (Figure
4.2(a)). If, however, it is perpendicular, this indicates an edge dislocation (Figure 4.2(b)).
An angle other than these is indicative of a mixed dislocation. Numerically, Burgers vector
usually represents by a three elements vector. For example, the vector (020) stands for the
Burgers vector is along the y axis and has no components in x and z direction; the length of
Burgers vector is twice as the unit cell length.
In face centered cubic and base centered cubic structures, the Burgers vector may be
expressed as: b=(L/2)[hkl], where L is the unit cell edge length and [h k l] is the crystallographic direction having the greatest linear atomic density. According to vector
(a)
(b)
Figure 4.2: Determine the Burgers vector by drawing rectangular. (a) edge dislocation; (b) screw dislocation
In reality, it is hard to determine the Burgers vector just by drawing circles on a photo of
dislocation (Figure 4.3(a)). Sometimes the dislocation is inside the sample, sometimes the
dislocations is complicated to recognize by eyes. Thus, besides observing the dislocation by
SEM or AFM, researchers may also do some vector calculation by using electron diffraction
pattern got from TEM or XRD methods (Figure 4.3(b)). With the magnitude of Burgers
(a)
(b)
Figure 4.3: (a) Determine Burgers vector by PLM/AFM photo. (b) determine Burgers vector by XRD picture
4.2 Development of Stress Field Calculation
Chen et. al observed cracks in LiFePO4 particles from SEM images, which provide
evidences of accumulation of dislocations (Figure 4.4) [69][78]. In the study, they also
b-direction of the two phases was observed, indicating the deformation and dislocation
associated with delithiation. The same group also reported a TEM image of Li0.5FePO4
sample where a clear disorder region was observed along c-direction (Figure 4.5) [69].
Therefore, it is suggested that the dislocation and distortion zones would be formed by phase
transformation during the insertion and desertion of lithium ions and potentially leads to
structural failures [79, 80]. Since FePO4 and LiFePO4 are connected with a coherent
interface due to similar crystal structures, internal stresses would form during the phase
transformation; the resultant atomic-level displacements lead to dislocations inside crystals
(Figure 4.6). Moreover, it is observed that the lithium ion insertion and extraction process
leads to ~7% volume change between LiFePO4 and FePO4 phase crystals. This is due to
internal stress and strain accommodations that occur in LiFePO4 crystals because of the
coherent interface between phase boundaries (Figure 4.7) [81]. The internal strains initiate
dislocations that form after several intercalation-extraction cycles inside cathode materials,
Figure 4.4: Observed cracks in LiFePO4 particles from SEM images (Chen, 2006) [78]
Figure 4.6: A LiFePO4 crystal model with an infinite length edge dislocation. Edge dislocation is along z-direction (c-direction).
To quantify the stress-fields of dislocation of LiFePO4, numerical models are developed.
Calculations for stress fields of dislocations in crystals are usually approximated as isotropic
materials with the classical analytical solution for convenience (I will use it as model A in
following parts) [82]:
Equation (1)
However, most cathode materials have anisotropic materials properties. For instance,
LiFePO4 cathode materials for Li-ion battery exhibit orthorhombic crystal structures and
have different elastic constants in different directions (Figure 3.4(a)) [83]. Noticing the
importance of elastic property of anisotropic materials, studies have focused on developing
analytical solutions of stress fields causing by dislocations. In 1953, J. D. Eshelby et al.
developed general solutions for evaluating dislocation stresses for an arbitrary homogeneous
equations for pure screw dislocation lines with infinite length in monoclinic crystal system
materials, and for pure edge dislocation lines with infinite length in orthorhombic crystals.
However, limited by computational methods at that time, only few equations for simple cases
were fully solved. Later on, with the developments of computers, graphs for the distributions
of stress fields around dislocations with anisotropic materials properties were developed [85].
Recently, solutions for stress fields of dislocation loops have been developed [86].
In 1975, H. L. Heinishch et al. numerically calculated the elastic stress fields,
self-energies, and energy factors of straight edge and screw dislocations in olivine materials [85].
With the help of computers, stress distributions were provided for different directions of
dislocations. From the figures, Heinisch et al. concluded that the orthorhombic olivine
materials have moderate elastic anisotropy, though the effects of anisotropy seem to be
relatively small. Moreover, the stress distributions of edge dislocations in olivine anisotropic
materials properties are similar to those with the isotropic materials properties, with minor
differences in the valves. They have compared the numerical results with experimental
observations. However, they did not successfully predict the slip direction and glide plane
Later in 1992, V.L. Indenbom and J. Lothe introduced an general analytical solution of
dislocations for orthorhombic material [87] (I will use it as model B in following parts):
Equation (2)
The equation fits well for anisotropic materials, suggesting that it could be used to predict
dislocations of LiFePO4. Based on their model, a coordinate system with the z-axis along the
dislocation was chosen and the sense vector of the dislocation was to point to the negative
z-direction. This coordinate system is aligned with the dislocations lines observed in LiFePO4
Once the elastic coefficients are available [83], the magnitudes and distributions of internal
stress and strain fields that caused by dislocations in LiFePO4 could be obtained.
4.3 Verifying Analytical Solution by Finite Element Modeling Method
Before starting the modeling and calculation process for the dislocation stress field in
LiFePO4 material with its isotropic/anisotropic property, I firstly tested the feasibility of
classical analytical solution (model A) with finite element analysis (FEA) modeling method
by comparing the stress results from FEA method and classical analysis equation. The
classical analytical stress-dislocation equation for isotropic material (model A) has been
developed and widely used for over 50 years. However, the classical equations only fit for
the simplified case: a single infinite length edge dislocation that parallels to z-axis in an
isotropic material, which does not fit our anisotropic LiFePO4 material. So for this
comparison and justification, I only consider this LiFePO4 dislocation system as the simplest
case: (1) LiFePO4 material as polycrystalline material that has isotropic property during the
test; (2) LiFePO4 particle has a square shape and the length of each side is equivalent; (3)
only one dislocation line lays in the particle, and it parallels to z-axis. More complicated and
realistic model will be considered during further modeling in next chapters.
In the modeling and testing process, crystal with an edge dislocation was modeled as a
bulk with an extra half plane lays in y-z plane. Considering the real dimension of crystals, I
set crystal lattice constant (the length between two nearest atoms) as L=10Å=10×10-10m.
accurate results but not too big for meshing and computation. The deformation load brought
by the edge dislocation could be modeled in this way: The extra half atom plane lays in the
upper part of the bulk (plane coordinates: x=0, y>0). That extra plane will take extra space of
1L width, which is one unit of crystal lattice. To make the 1L width room for that extra
plane, two neighboring planes will move to left/right accordingly. The left half plane moves
0.5L to the left and the right half plane moves 0.5L to the right (Figure 4.8a). For boundary
condition, since the atoms in far away area are still in a good order (Figure 4.8b), the
displacements on surfaces of the bulk are 0. At last, since the edge dislocation appears in the
middle of the symmetric shaped bulk on x-y plain, I just need to analyze the left/right half of
the model. In other words, our FEA assumption is that the bulk would not have any
displacement on its surface but only have displacements of crystal lattice inside. According
to the references, Young’s modulus is 88.83 GPa, and Poisson ratio is 0.34 [89].
With the above simplifications and assumptions, I provide dislocation stress distributions
for LiFePO4 crystals calculated by classical equation (model A) with mathematical software
Mathematica. The stress distribution plot is showed in Figure 4.9, and the stress values at
(b)
Figure 4.8: (a) FEA Model for our dislocation problem. (b) dislocation problem in larger scale
Figure 4.9: Dislocation stress distribution plot in LiFePO4 material with isotropic property and classical equations (model A).
After the modeling, I could obtain the computed stress values data by running a static
analysis with ANSYS FEA software. Stress data at each node and the stress distribution plot
could then be obtained. The stress values at each node calculated from ANSYS and from
4.12) were plotted to cross verify the feasibility of classical analytical solutions (model A)
and ANSYS model in function of predicting the stress field from dislocation.
Figure 4.10: (a) Plot of stresses σ-xx calculated by classical equation and ANSYS model. (b) Numerical difference between two sets of stress data (Equation - ANSYS)
Figure 4.11: (a) Plot of stresses σ-yy calculated by classical equation and ANSYS model. (b) Numerical difference between two sets of stress data (Equation - ANSYS)
Figure 4.12: (a) Plot of stresses τ-xy calculated by classical equation and ANSYS model. (b) Numerical difference between two sets of stress data (Equation - ANSYS)
Several characteristics of the data plots could be observed from figure 4.10, 4.11 and
4.12:
(1). As shown in figure 4.10, 4.11 and 4.12, the plot of stress values from ANSYS model
are having the same shape as the plot of analytical results from classical equation. In
addition, the differences between two sets of results are relatively small. Therefore, I could
safely state that the ANSYS method for analyzing the stress field works very well for this (b)
model. In other words, the FEA analyzing method could provide nearly the same results as
classical elastic mechanical theory does.
(2). The stress values from classical analytical equation are slightly higher than values
from ANSYS method. This is because that the stress value generated by FEA method is
lower than the real value due to the stiffness matrix [K] is approximated to be lower than the
actual physical case.
(3). Stresses near the dislocation field are much larger than those in outer part. In those
areas, the differences of stress values between ANSYS model and theoretical equation are
much larger as well. That is due to the stress concentration led by big geometry changes.
(4). The stress value differences are larger in σ-yy and τ-xy calculating than them in σ-xx
calculating, which is the same direction displacement load applies. So I may assume that the
ANSYS model works better in predicting stresses in directions that do not have shape
deformation.
In addition, I use Mathematica 7.0 to plot the stress distribution graphs (Figure. 4.13)
according to classical equation. The graphs shows that the stress distribution generated by
ANSYS and by classical theory are sharing the same shape, which support our statement that


![Figure 3.3: Reactions related to soluble Mn ions (Vetter, 2005) [58].](https://thumb-us.123doks.com/thumbv2/123dok_us/1550789.1190318/36.612.156.492.193.400/figure-reactions-related-soluble-mn-ions-vetter.webp)

![Figure 3.6: Formation, growth, and failure of SEI layers (Vetter, 2005) [58]](https://thumb-us.123doks.com/thumbv2/123dok_us/1550789.1190318/42.612.140.481.113.374/figure-formation-growth-failure-sei-layers-vetter.webp)

![Figure 4.7: Distortion zone between LFP phase and FP phase (Delmas, 2008) [68]](https://thumb-us.123doks.com/thumbv2/123dok_us/1550789.1190318/54.612.202.438.101.360/figure-distortion-zone-lfp-phase-fp-phase-delmas.webp)
