ABSTRACT
WU, ZENGYANG. Investigation of Spray and Combustion of a Piezo-electric Fuel Injector for Gasoline Direct Injection Engines. (Under the direction of Dr. Tiegang Fang).
In recent years, more stringent emission standard and high fuel economy demands have
forced vehicle manufactures to seek alternative techniques to synchronize benefits of both gasoline and diesel fuels. In this work, experimental studies of spray characteristics and fuel auto-ignition properties from an outwardly opening piezoelectric gasoline direct injection fuel
injector were conducted in an optically accessible constant volume combustion chamber (CVCC) experiment system.
Fuel sprays of light naphtha (LN), primary reference fuel (PRF), and E10 gasoline under different ambient pressures from 1 bar to 12.5 bar were investigated first. Spray was visualized by applying a Mie-scattering technique. A high-speed camera was employed to
capture the spray images. Results show that a clear filamentary hollow-cone spray structure is formed for all three fuels at atmospheric conditions, and toroidal recirculation vortices are
observed at the downstream spray edges. A higher ambient pressure leads to a stronger vortex located closer to the injector outlet. Larger spray angles are found under higher ambient pressure conditions for all three fuels.
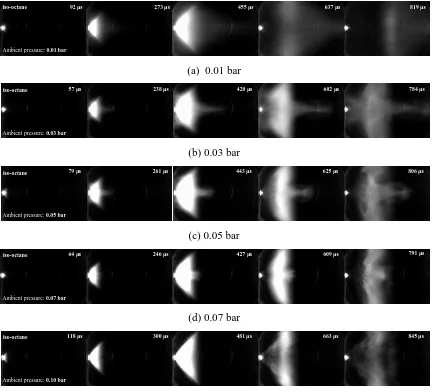
Ambient pressure conditions were then extended to a lower range for iso-octane sprays. Five ambient pressure conditions were selected from 0.01 bar to 0.10 bar to evaluate the effect
of superheated conditions on the spray structure from the piezoelectric fuel injector. Results indicate that spray under a superheated condition presents a distinct spray structure in the flash boiling regime. A lower ambient pressure within the superheated condition range results in a
liquid vaporization rate. These phenomena are dominated by ambient pressures. Effects of fuel the injection pressure and the fuel injection duration are relatively negligible.
Next, the auto-ignition characteristics of LN, primary reference fuels (PRF65, PRF95), gasoline (Haltermann CARB LEV III) and a gasoline surrogate under conditions similar to the
spray G condition (3.5 kg/m3 gas density, 21% ambient oxygen concentration) were studied. Five different ambient temperatures from 650 K to 950 K with a 75 K step were investigated. Fuel auto-ignition was observed with noticeable ignition delay for five investigated fuels under
all selected experiment conditions. Results show that the locations of the occurrence of auto-ignitions are randomly distributed in combustion chamber. Ignition delay of each fuel is always
longer than fuel injection duration under all selected experiment conditions. Differences in ignition delay among the five fuels are more significant when the ambient temperature is lower than 750K.
At last, two-color measurements were conducted for LN under diesel engine conditions. Five ambient oxygen concentrations varying from 10% to 21% and three ambient temperature
conditions, 800K, 100K and 1200K, were selected to simulate both conventional diesel engine operation environment and low temperature and low oxygen concentration environment. Flame temperature distribution and KL factor distribution under different ambient conditions
Investigation of Spray and Combustion of a Piezoelectric Fuel Injector for Gasoline Direct Injection Engines
by Zengyang Wu
A dissertation submitted to the Graduate Faculty of North Carolina State University
in partial fulfillment of the requirements for the degree of
Doctor of Philosophy
Mechanical Engineering
Raleigh, North Carolina
2017
APPROVED BY:
_______________________________ ______________________________ Dr. Tiegang Fang Dr. Alexei V.Saveliev
Committee Chair
________________________________ ________________________________ Dr. Tarek Echekki Dr. William L. Roberts
ii DEDICATION
iii BIOGRAPHY
Zengyang attended University of Science and Technology of China and graduated in 2013 with a B.S. in Mechanical Engineering. Following graduation he was accepted into the
North Carolina State University Ph.D. program in Mechanical and Aerospace Department under Dr. Tiegang Fang. While pursuing a Ph.D. degree, he earned his M.S. degree in
iv ACKNOWLEDGMENTS
I have been privileged to work with and be inspired by many people during last four more years while pursuing a Ph.D. First of all, I would like to express my sincere gratitude to
my advisor Dr. Tiegang Fang for all his support and his encouragement. It was extremely fortunate for me to have such a supervisor, who shared his logical research attitude and research
experiences with me, and taught me so much in every aspect of science. Without his enthusiastic guidance, this research would not have been possible.
I would like to thank members of my doctoral committee: Dr. Alexei V. Saveliev, Dr.
Tarek Echekki, Dr. William L. Roberts and Dr. Wayne Yuan. Specifically, Dr. Roberts sacrificed his spare time to attend my qualify exam, preliminary exam and the final defense, I
appreciate his kind help. Dr. Alexei Saveliev is greatly appreciated for numerous help in the experimental equipment sharing and research suggestions. The first course I attended in NC State is Dr. Echekki’s Fluid Dynamics of Combustion, which is very helpful to my research. I
would also say thanks to Dr. Yuan for being my graduate school representative\.
One benefit of being at NC State for more than years is that I have had a chance to meet
and work with so many wonderful colleagues. I want to thank Dr. Wei Jing, who helped me a lot in the first year at NC State. Without him I could not gain so much valuable experience and ideas on the CVCC experimental system. I appreciate the help from Libing Wang and Fujun
Wang when I encounter difficulties in experiments. I wish them the best in the future. Dr. Weibo Zhang, Dr. Guangyu Zhu, Dr. Bo Gao, Dolanimi Ogunkoya, Aaron McCullough,
v Last but not the least, this work is supported by, or in part by, the Saudi Aramco R&D Center through the Clean Combustion Research Center of the King Abdullah University of
Science and Technology under the FUELCOM program. The funding sources are the important factors in my PhD research work, which is greatly appreciated. Any opinions, findings, and
vi
TABLE OF CONTENTS
LIST OF TABLES ... viii
LIST OF FIGURES ... ix
1. Introduction ... 1
1.1 Motivation ... 1
1.2 Research objective and outline ... 2
2. Literature Review ... 5
2.1 Outwardly opening piezo gasoline direct injection (GDI) fuel injector ... 5
2.2 Spray front penetration Length ... 5
2.3 Spray cone angle ... 6
2.4 Mie-scattering imaging ... 6
2.5 Jet velocity ... 7
2.6 Droplet distribution ... 8
2.7 Superheated fluid and flash boiling ... 8
2.8 Two color pyrometry ... 9
2.8.1 Theory ... 9
2.8.2 Implementation and calibration ... 11
2.8.3 Selection of ... 12
2.8.4 Selection of Wavelength ... 12
2.9 Tables and figures ... 14
3. Experimental setup ... 15
3.1 Experimental System Design ... 15
3.1.1 Chamber body ... 15
3.1.2 Gas delivery system ... 16
3.1.3 Fuel injection system ... 17
3.1.4 Ignition system ... 18
3.2 Data acquisition and control system ... 18
3.2.1 Hardware and software configuration ... 18
3.2.2 Pressure measurement ... 18
3.2.3 Optical diagnostic system ... 19
3.2.4 Experimental procedure ... 19
3.3 Tables and figures ... 21
4. GDI Fuel Sprays Using a Piezoelectric Injector under Different Ambient Pressures ... 26
4.1 Introduction ... 26
4.2 Diagnostics and Measurements ... 29
vii
4.3.1 LN results ... 35
4.3.2 PRF95 results... 38
4.3.3 Gasoline results ... 39
4.3.4 Comparison among three fuels ... 40
4.4 Summary and conclusions ... 43
4.5 Tables and figures ... 45
5. Spray under low pressure environment ... 60
5.1 Introduction ... 60
5.2. Diagnostics and Measurements ... 62
5.3 Result discussions ... 63
5.3.1 Spray images ... 63
5.3.2 Penetration length ... 65
5.3.3 Effect pf fuel injection pressure... 67
5.3.4 Effect of fuel injection duration... 70
5.4 Summary ... 73
5.5 Tables and Figures ... 74
6. Auto-ignition of gasoline fuels under different ambient conditions ... 84
6.1 Introduction ... 84
6.2 Auto-ignition of gasoline fuels under spray G condition ... 88
6.2.1 Diagnostics and Measurements ... 88
6.2.2 Results and Discussions ... 90
6.2.3 Summary ... 98
6.2.4 Tables and Figures ... 100
6.3 Auto-ignition of light naphtha under diesel engine environment ... 114
6.3.1 Diagnostics and Measurements ... 114
6.3.2 Results and Discussions ... 115
6.3.3 Summary ... 124
6.3.4 Tables and Figures ... 126
7. Conclusion ... 146
7.1 Conclusion ... 146
7.2 Future work ... 148
viii
LIST OF TABLES
Table 3.1 Maximum allowable stresses at different positions on chamber ... 21
Table 4.1. Selected fuel properties ... 46
Table 6.2.1 Gas compositions before and after the premixed combustion………..102
Table 6.2.2. Gasoline surrogate composition ... 102
Table 6.2.3. Selected fuel properties of investigated fuels ... 102
Table 6.2.4 Ignition delay of gasoline, gasoline surrogate, LN, PRF65 and PRF95 at different ambient temperatures ... 103
ix
LIST OF FIGURES
Figure 2.1 Typical structure of spray from an outwardly opening piezo gasoline direct injection fuel
injector ... 14
Figure 2.2 Linear relationship between camera exposure time and pixel intensity ... 14
Figure 3.1 1 Experimental system: 1.fuel injector; 2.exhaust line; 3.chamber body; 4.quatz window; 5. plug/window retainer; 6. pressure transducer; 7.intake line; 8.metal plug; 9. spark plug; 10. combustion chamber. ... 22
Figure 3.2 3-D structure of the chamber body design ... 22
Figure 3. 3 The diagram configuration of gas supply system [21]. ... 23
Figure 3. 4 The diagram configuration of fuel delivery system. ... 23
Figure 3. 5 The actual control and data acquisition system ... 24
Figure 3.6 Typical pressure development during premixed combustion ... 24
Figure 3.7 Experiment procedure ... 25
Figure 4.1 Experimental system: 1. fuel injector, 2. exhaust line, 3. chamber body, 4. quartz window, 5.plug/window retainer, 6. pressure transducer, 7. intake line, 8. metal plug, 9. spark plug, 10. Combustion chamber, 11.high speed camera (Phantom V4.3). 12 lighting ... 47
Figure 4.2. Scheme of three different spray angle definitions ... 47
Figure 4.3 LN spray angle with different definitions ... 48
Figure 4.4 Comparison of different spray angle definitions ... 49
Figure 4.5 Scheme of two different spray penetration definitions ... 49
Figure 4.6 LN spray front penetration length with different definitions ... 50
Figure 4.7 Comparison of different spray penetration length definitions ... 51
Figure 4.8 LN spray penetration velocity with different definitions ... 51
Figure 4.9. LN spray images under selected ambient pressures ... 52
Figure 4.10. LN spray structure development under selected ambient pressures... 53
Figure 4.11. LN spray structure development at selected time steps ... 53
Figure 4.12 LN spray front fluctuation ... 53
Figure 4.13. PRF95 spray images under selected ambient pressures ... 54
Figure 4.14. PRF95 spray characteristics: (a) Spray angle (b) Spray front penetration length ... 55
Figure 4.15. Gasoline spray images under selected ambient pressures ... 56
Figure 4.16. Gasoline spray characteristics: (a) Spray angle (b) Spray front penetration length ... 57
Figure 4.17 Spray structure comparison among three fuels ... 58
Figure 4.18 Spray angle comparison among three fuels ... 59
Figure 4.19 Spray front penetration length comparison among three fuels ... 59
Figure 4.20 Spray front penetration velocity comparison among three fuels ... 60
Figure 4.21 Spray front fluctuation comparison among three fuels ... 60
x
Figure 5.2 Saturation pressure of iso-octane at different temperature ... 76
Figure 5.3 Selected spray images under different ambient pressures ... 77
Figure 5.4 Selected spray front images at 0.01 bar ambient pressure ... 78
Figure 5.5 Spray penetration length at different ambient pressures ... 79
Figure 5.6 Spray penetration velocity at different ambient pressures ... 79
Figure 5.7 Spray images with different injection pressure at selected ambient pressures... 80
Figure 5.8 Comparison pf spray penetration length at different fuel injection pressure ... 81
Figure 5.9 Comparison of spray penetration length at 30 bar injection pressure ... 81
Figure 5.10 Comparison of spray penetration velocity at different injection pressures ... 82
Figure 5.11 Comparison of spray penetration velocity at 30 bar injection pressures ... 82
Figure 5.12 Spray images with different injection durations at selected ambient conditions ... 83
Figure 5.13 Comparison of spray penetration length with different injection durations ... 84
Figure 5.14 Comparison of spray penetration velocity with different injection durations ... 84
Figure 5.15 Comparison of spray penetration length with different injection durations at 30bar injection pressure ... 85
Figure 5.16 Comparison of spray penetration velocity with different injection durations at 30bar injection pressure ... 85
Figure 6.2.1. Experimental system: 1. fuel injector, 2. exhaust line, 3. chamber body, 4. quartz window, 5.plug/window retainer, 6. pressure transducer, 7. intake line, 8. metal plug, 9. spark plug, 10. Combustion chamber, 11. high speed camera ... 104
Figure 6.2.2. Locations of injector, pressure transducer and chamber view boundary ... 104
Figure 6.2.3. Auto-ignition images of PRF65 under different ambient temperatures ... 105
Figure 6.2.4. Comparison of auto-ignition images of five fuels under 650 K ambient temperature condition ... 106
Figure 6.2.5. Comparison of auto-ignition images of five fuels under 950 K ambient temperature condition ... 107
Figure 6.2.6. Ignition delay development of five investigated fuels ... 108
Figure 6.2.7. PRF65 spray images before ignition: (a) 650 K (b) 725 K (c) 800K (d) 875 K (e) 950 K ... 109
Figure 6.2.8. Comparison of fuel spray before auto-ignition of five fuels at 650 K ... 110
Figure 6.2.9 Comparison of fuel spray before auto-ignition of five fuels at 950 K ... 111
Figure 6.2.10 Time averaged spray angle of five fuels under different ambient temperatures ... 112
Figure 6.2.11 Comparison of time averaged spray angle among five fuels under different ambient temperatures ... 112
Figure 6.2.12 Spray front penetration length of five fuels under different ambient temperatures ... 113
Figure 6.2.13. Comparison of spray front penetration length among five fuels at: (a) 650 K, (b) 950K ... 114
xi
Figure 6.3.1 Flame temperature and KL factor distribution at 10% and 800K condition ... 130
Figure 6.3.2 Flame temperature and KL factor distribution at 10% and 1000K condition ... 131
Figure 6.3.3 Flame temperature and KL factor distribution at 10% and 1200K condition ... 132
Figure 6.3.4 Flame temperature and KL factor distribution at 21% and 1000K condition ... 133
Figure 6.3.5 Comparison of flame temperature distributions at 1000K with different ambient oxygen concentrations ... 134
Figure 6.3.6 Comparison of flame KL factor distributions at 1000K with different ambient oxygen concentrations ... 135
Figure 6.3.7 Flame temperature and KL factor distribution at 12% and 800K condition ... 136
Figure 6.3.8 Flame temperature and KL factor distribution at 12% and 1000K condition ... 137
Figure 6.3.9 Flame temperature and KL factor distribution at 12% and 1200K condition ... 138
Figure 6.3.10 Flame temperature and KL factor distribution at 15% and 800K condition ... 139
Figure 6.3.11 Flame temperature and KL factor distribution at 15% and 1000K condition ... 140
Figure 6.3.12 Flame temperature and KL factor distribution at 15% and 1200K condition ... 140
Figure 6.3.13 Flame temperature and KL factor distribution at 18% and 800K condition ... 141
Figure 6.3.14 Flame temperature and KL factor distribution at 18% and 1000K condition ... 141
Figure 6.3.15 Flame temperature and KL factor distribution at 18% and 1200K condition ... 141
Figure 6.3.16 Flame temperature and KL factor distribution at 21% and 800K condition ... 142
Figure 6.3.17 Flame temperature and KL factor distribution at 21% and 1200K condition ... 142
Figure 6.3.18 Comparison of flame average temperature at different ambient oxygen concentrations ... 143
Figure 6.3.19 Comparison of flame average temperature at different ambient temperatures ... 144
Figure 6.3.20 Comparison of flame average KL factor at different ambient oxygen concentrations 145 Figure 6.3.21 Comparison of flame average KL factor at different ambient temperatures ... 146
Figure 6.3.22 Comparison of flame accumulated KL factor at different ambient oxygen concentrations ... 147
1
1. Introduction
1.1 Motivation
Currently, gasoline used in spark-ignition engines and diesel used in compression ignition engines are two major types of road transport fuels. Most of commercial transport is run on diesel. The primary difference between these is the auto-ignition quality [1]. Diesel
engine is well known as a significant source of pollution emissions, including nitrogen oxides, unburned hydrocarbons, carbon monoxide and particulate matters. Currently, more stringent
emissions standards along with higher fuel economy demands have forced auto makers to achieve alternative combustion approach or alternative fuels.
Conventional diesel fuels used in current diesel engines mostly have cetane numbers
greater than 40, and fuels get auto-ignited very soon after the start of fuel injection, before fuel and air are adequately mixed. Especially at high loads, diesel fuel auto-ignition usually occurs
far before the end of fuel injection. Advance the fuel injection timing is the most common approach to achieve fully premixed fuel and air. However, combustion phasing is affected by conditions at the start of the compression stroke and the chemical kinetics of fuel/air mixture,
which make the fuel auto-ignition timings control extremely difficult in CI engines. The lack of reliable ignition control has been a major challenge to extend the operation range. However,
Spark ignition (SI) engines are much less efficient than compression ignition engines because they encounter throttling losses under part-load operation. It cannot be operated with lean mixtures and their compression ratio is limited by knock [2].On this concern, it is more
desirable to have a fully premixed combustion with high combustion efficiency and low emissions. Moreover, it has been demonstrated that diesel compression ignition engines can
2 soot and NOx emission at the same time [2]. Hence running compression ignition engines on gasoline offers the potential for developing engines of high efficiency and low emissions at
lower cost and complexity compared to other approaches. Meanwhile, NOx levels can be reduced by reducing combustion temperature by either running lean, pre-mixed or using EGR
[3].
Naphtha fuels has drawn more attention recently due to its beneficial properties for the utilization in transportation sector. Naphtha is a kind of fuel with less processed refinery stream
in the gasoline boiling and carbon number range, but with lower octane number. Generally, it is composed of C5 to C11 hydrocarbons and has a low research octane number (RON) value,
roughly within the 40-70 range. Since naphtha requires much less processing in the refinery than either gasoline or diesel, there is an additional benefit in terms of well-to-wheel CO2 emissions and overall energy consumed [4]. It is of great interest to gain a more thorough
understanding on the gasoline fuels auto-ignition in diesel engine environments, especially with the utilization of naphtha fuels.
1.2 Research objective and outline
This study is mainly focused on spray characteristics and auto-ignition process of
gasoline like fuels from an outwardly opening piezoelectric gasoline direct injection fuel injector under different ambient conditions. The organization of this dissertation is summarized
as follows:
In chapter 2, the background and approaches for the fuel spray characteristics and fuel auto-ignition investigation are described. An overview of the basic definitions involved in
3 the performance of fuel injector, and fuel flame temperature and soot distribution calculation are also described.
Chapter 3 describes the setup of the constant volume combustion chamber experiment system. Design of the experimental system is introduced with consideration of safety concern.
Gas delivery system, fuel injection system, ignition system and data collection system are also described.
Chapter 4 investigates spray characteristics of light naphtha (LN), primary reference
fuel (PRF) and E10 gasoline under different ambient pressures. Effect of ambient pressure on spray structure is discussed in detail. Spray angle, spray front penetration length, spray front
penetration velocity and spray font fluctuation are compared quantitatively.
Chapter 5 studies the spray characteristics of iso-octane under superheated conditions by lowing pressure of the ambient environment. Effect of ambient pressure, fuel injection
pressure and fuel injection duration on spray structure are evaluated. Spray penetration velocity is calculated and discussed.
Chapter 6 explores the possibility of auto-ignition of different gasoline like fuels under spray G condition first. LN, primary reference fuels (PRF65, PRF95), gasoline (Haltermann CARB LEV III) and gasoline surrogate are investigated in this section. Spray development
before fuel auto-ignition are studied first. Ignition delay of different fuels are calculated and compared as well. Compression ignition of light naphtha under both conventional diesel
combustion environment and low-temperature, low-pressure environment are then studied. Two-color pyrometry is employed to calculate flame temperature and KL factor distribution. Average temperature and average KL factor development under different ambient conditions
5
2. Literature Review
2.1 Outwardly opening piezo gasoline direct injection (GDI) fuel injector
Currently solenoid-actuated inwardly opening multi-hole injectors and piezoelectric outwardly opening injectors are predominant injectors in GDI engines. Solenoid injectors are more economical than piezo injectors by sacrificing the precision and repeatability [5]. Piezo
injectors draw attentions because of their sensitive and fast response, which are significant for small quantities or closely spaced multiple injections. Spray from a piezo injector has a
hollow-cone structure with visible striations and filaments. Unlike hollow hollow-cone pressure-swirl sprays, no collapse arises with the spray development [6], and this spray pattern is quite repeatable. A typical spray form a piezo fuel injector is shown in Figure 2.1.
2.2 Spray front penetration Length
Spray front penetration length is defined as the distance from spray front to the injector nozzle. It is one of the key parameters that affect fuel spray combustion process in engines. Selections of spray front location impact the calculation of spray front penetration length a lot.
For a single-hole fuel injector, several models are proposed to predict spray front penetration length. Pastor et al [7] come up with following 1-D model based on a mixing driven
evaporation assumption:
2 1/ 2 L =
tan 2
f P
a mv
K C D
C
(2 - 1)
Where L is the liquid penetration length, KPis a constant depending on ambient conditions,
6 ambient air properties. is the spray cone angle, f and aare fuel and air density. This could
be used as an reference while evaluation spray front penetration for an piezo-electrical hollow
cone fuel injector.
2.3 Spray cone angle
For sprays from a an piezo-electrical hollow cone fuel injector , spray cone angle is defined as the angle between the spray edges at the pre-determined locations near the injector
tip at a specified time after the start of fuel (SOF) [8]. It can be measured by Mie-scattering imaging, shadowgraphy or extinction tomography. Spray cone angle of a piezo-electrical hollow cone fuel injector is mostly determined by injector inner structure.
2.4 Mie-scattering imaging
Mie scattering is elastic scattered light of particles that have a diameter similar to or larger than the wavelength of the incident light [9]. Mie scattering signal is proportional to the square of the particle diameter. Compared with Rayleigh scattering, which describes the elastic
scattering of light by spheres that are much smaller than the wavelength of light, Mie scattering is much stronger. There is a strong angular dependency of the scattered intensity especially for
smaller particles which has to be considered for successful Mie imaging experiments. Mie scattering is often used to measure flow velocities applying Particle Image Velocimetry (PIV). In this study, Mie scattering imaging is utilized to visualize sprays from a piezo-electrical
7 2.5 Jet velocity
For a single-hole fuel injector, jet velocity at the nozzle exit is determined by the
pressure different between fuel in injector and the ambient environment. Musculus et al [10] proposed the following model to predict jet velocity at nozzle exit:
2 inj
d
a f
P C
v
C
(2 - 2)
where Cdis the discharge coefficient, Cais orifice area contraction coefficient, fis the fuel
density, Pinjis the pressure difference. The discharge coefficient is an empirical coefficient
that could only be determined experimentally. So far no clear model is proposed to describe
the jet velocity from a piezo-electrical hollow cone fuel injector.
For jet with phase change, the calculation of the mass and the velocity at the exit of the nozzle strongly depends on the determination of the regime of the jet at the exit of the nozzle.
To simplify the situation, the flow type at the exit could be described as a two-phase fluid in thermodynamic equilibrium as a liquid–vapor flow in non-equilibrium according to the
thermodynamic behavior of the whole system [11]. Under this assumption, flow velocity of liquid and vapor phases can be predicted by using equations as follows:
2 inj exit
l
l
P P
u
(2 - 3)
, 2
v p v inj exit
u C T T (2 - 4)
where Pinjis the fuel injection pressure, Pexitis the jet exit pressure, lis the density of fluid,
,
p v
8 exit environment temperature. Solomon et al. [12] employed equation (2 - 3) and proposed the following equation to describe the discharge velocity.
,
2 inj exit p l inj exit p exit ln inj
l exit
P P T
u C T T C T
T
(2 - 5)
where Cp l, it the specific heat coefficient of the liquid phase.
2.6 Droplet distribution
The representation of the actual droplet size distribution is usually referred to as a
frequency distribution curve. There are different distribution functions based on theoretical or experimental fundamentals that are proposed to describe the number of droplets of a particular
size. One of the most widely used distribution function is the Rosin-Rammler distribution, which represents a probability volumetric size distribution of droplet diameters [13]. It involves two parameters to determine the distribution.
.
1 d Xn
P e (2 - 6)
Where P is the distribution defining the accumulated volume fraction of droplets with diameters less than X, d is the drop diameter. X is the characteristic drop diameter. It is the size of a drop in the distribution whose accumulated fraction is 0.6321.
2.7 Superheated fluid and flash boiling
Superheated is used to describe the situation for a liquid contained at conditions above the ambient saturation pressure is released to the atmosphere. Under this situation, rapid boiling of the resultant liquid jet occurs, producing two-phase flow. Meanwhile, dynamic expansion
9 phenomenon is also known as flashing. Flashing liquid gives rise to potentially explosive and certainly hazardous heterogeneous two-phase clouds. Typically, the flashing phenomenon has
been observed in laboratory experiments where a liquid flows through a short nozzle into a low-pressure chamber at a pressure value considerably lower than the liquid saturation pressure
at the injection temperature.
Superheated fluid flash boiling is closely related to fuel sprays in engines. Flash evaporation might take place inside or outside the injector nozzle, thus the liquid jet behaves
following different mechanisms. Flashing conditions greatly influences atomization and vaporization processes as well as the mixture formation and combustion. The occurrence of
flash vaporization might affect combustion performances, and even create the danger of vapor lock within the fuel line. In internal combustion engines, the expansion process of a liquid flowing through a constriction such as an orifice or a short nozzle may take the liquid into the
saturation condition for certain combinations of pressure drop and thermodynamic properties of the fluid. This would trigger the phase-change process as dictated by equilibrium
thermodynamics [14].
2.8 Two color pyrometry 2.8.1 Theory
Flame luminosity that caused by soot particles thermal radiation at high temperature
10 1 K when the ambient gas and soot particles have reached thermal equilibrium [16]. Therefore flame temperature could be measured by measuring soot particle temperature directly.
Two-color pyrometry is a technique that obtain flame temperature distribution by measuring flamer thermal radiation at two different wavelength. Generally, thermal radiation
of a blackbody resource at a certain temperature and a given wavelength could be evaluated by Planck’s equation.
2 1
. 5 /
1
b C T
C
E T
e
(2 - 7)
where Eb.is the monochromatic emissive power intensity of a blackbody at temperature T.
is the light wavelength, C1and C2 are the first Planck’s constant and the second Planck’s
constant.
16 2
1 3.7418 10
C W m
2
2 1.4388 10
C m K
For non-blackbody resource, the monochromatic emissivity is defined as:
,b
I T
I T
(2 - 8)
where I
T and Ib
Ta are the monochromatic emissive power of a non-black body and ablackbody surface at the same temperature and wavelength, respectively. For two-color
pyrometry, the apparent temperature Tais defined as the temperature of a blackbody, which
emit the same radiation intensity as a non-black body at T [16]. Substitute this parameter into equation (2 - 8)
,,
b a
b
I T
I T
11 and combine with equation (2 - 7)
2 2 / / 1 1 a C T C T e e
(2 - 10)
For soot particles the monochromatic emissivity, Hottel and Broughton [17] proposed an empirical correlation as
/
1 e KL
(2 - 11)
Where K is an absorption coefficient that is proportional to soot particle density, L is
the geometric thickness of the flame along the optical axis. is parameter related to the physical and optical properties of soot particles.
Combining equation (2 - 10) and (2 - 11), if the emissive power at two different wavelength and a certain temperature is given, the real flame temperature and KL factor can
be calculated by solving following two equations.
1 2 1 / 1 1 / 5 1 2 1 1 KL C T C e I e (2 - 12)
2 2 2 / 1 2 / 5 2 2 1 1 KL C T C e I e (2 - 13)
2.8.2 Implementation and calibration
According to equation (2 - 12) and (2 - 13), monochromatic emissive power of a black
body at a certain temperature and wavelength need to be obtained to calculate flame temperature and soot KL factor. In this study, a Halogen Light Sources (LS-1-LL) with a 2800 K bulb was used to calibrate the relationship between image pixel intensity and monochromatic
12 while capturing light intensity from the light source. Signals from this light source were captured at each camera setting that used in experiments. A linear development pattern is
demonstrated between camera exposure time and image pixel signal intensity at all aperture that selected in this study. Plot of image pixel signal to camera exposure time is presented in
Figure 2.2. Therefore the relation between pixel value and emissive power at each pixel could be evaluated by this calibration process.
2.8.3 Selection of
is a parameter that relate to light wavelength, soot particle size, refractive index of
soot and fuel type [16]. In visible wavelength region, selection of is less critical on flame
temperature evaluation, since flame temperature is not sensitive to . Thus in this study, the
difference between 1and 2could be negligible. It is recommended to select 1.39 as the value
of with wavelength 550 nm and 650 nm by Yan and Barman [18].
2.8.4 Selection of Wavelength
In general, visible and infrared wavelengths have been widely selected in two color
measurement. Currently visible wavelength is preferred for a few reasons. Firstly, measuring system is more sensitive to flame temperature changes in visible wavelength region. It has been
demonstrated that in a temperature range of 1000K to 2000K, spectral radiance with respect to wavelength is higher in visible light region. Second, combustion experiments release considerable heat, which leads to a relative high temperature of the experimental system. Hot
14 2.9 Tables and figures
Figure 2.1 Typical structure of spray from an outwardly opening piezo gasoline direct injection fuel injector
Figure 2.2 Linear relationship between camera exposure time and pixel intensity
0 50 100 150 200 250
0 2 4 6 8 10 12 14 16
P
ix
el
in
ten
sity
(a
.u
.)
Exposure time (μs)
Aperture : 2.8
I (650 nm) I (550 nm)
0 50 100 150 200 250
0 2 4 6 8 10 12 14 16
P
ix
el
in
ten
sity
(a
.u
.)
Exposure time (μs)
Aperture: 4 I (650 nm) I (550 nm)
15
3. Experimental setup
3.1 Experimental System Design
Constant volume combustion chamber (CVCC) system is an experimental system that is able to simulate environment near top dead center for both spark ignition engines and compression ignition engines. It has been widely used in several research institutions,
including Sandia National Laboratory, University of Wisconsin at Madison, Brigham Young University, Eindhoven University of Technology, and so on. It offers flexible optical access,
wide range of operation condition and high repeatability, which make the CVCC system an ideal tool to details of reactive and non-reactive spray process.
3.1.1 Chamber body
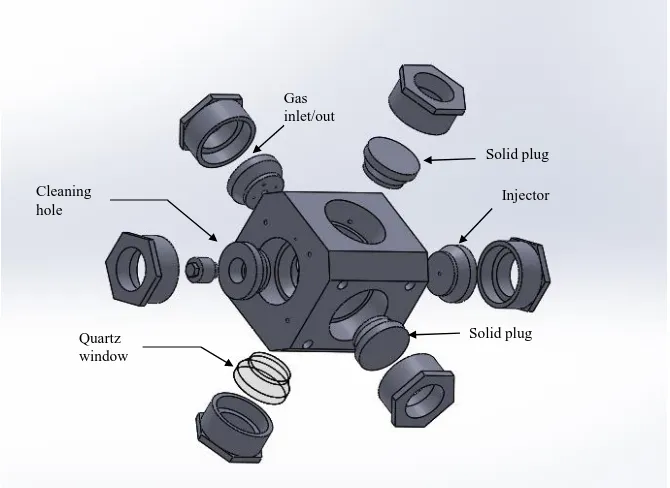
The constant volume combustion chamber was made of alloy steel 4140 due to its good
thermal stability and machinability. There were six ports in the chamber body. Optical access was enabled by quartz windows installed in one or two ports. Other ports were sealed by solid stainless steel plugs fitted with a gas inlet, an outlet, a fuel injector, a spark plug, a pressure
sensor, and other necessary components. A 2D structure and a assemble structure of the chamber body were shown in Figure 3.1 and 3.2. Material of all metal plugs was stainless steel
304, and the material of quartz window was Dynasil 1100. Dynasil 1100 is a fused silica material which is optically bubble free. It has excellent transmission capabilities in the ultraviolet range and allows a transmission of 0.9~0.95 in the spectrums. The inner diameter
of chamber body ports was 100mm. To prevent the crack of windows from possible thermal expansion of surrounding material, and to make metal plugs dismountable, the diameter of
16 plug and quartz window was 130mm. The thickness of the metal plug or the window was 60 mm. To seal the high pressure and high temperature mixture inside chamber, Silicon RTV 60
was used in the gap between the perimeter surface of metal plug or window and chamber body ports. Stainless steel plugs and quartz windows were hold and pushed by customized metal
holders. Holders were fitted on chamber body by thread. When all ports were sealed, the inner chamber volume was 0.95L.
The chamber body was fitted on an optical table with four adjustable feet. In order to
heat the chamber, several straight holes were drilled for heaters and thermocouple. Maximum allowable stress of different components on chamber body were presented in Table 3.1.
3.1.2 Gas delivery system
The simulated high temperature and high pressure engine combustion environment
near top dead center was generated by a premixed combustion of acetylene prior to fuel spray combustion. Therefore a gas delivery system was constructed to supply required gas into
chamber for premixed combustions. Three different gases, acetylene, O2/N2 (50%/50%) and
dry air were selected to formulate proper mixtures to obtain the desired ambient temperature and ambient oxygen concentration. Acetylene was selected mainly because of its high C/H
ratio, which produces less water in the premixed combustion. Other than pure oxygen, O2/N2
(50%/50%) is selected to ensure safety during experiments. Dry air could be used to enable
wide range of stoichiometric conditions and to manipulate inner chamber gas density. A structure of the gas delivery system is shown in Figure 3.3.
Solenoid valves and 90o actuators associated with ball valves were utilized to achieve
17 configuring the solid state relay array with the signal from timing board PCI-6602 and integrated in the system control programs. For a typical spray combustion experiments,
acetylene, O2/N2 and dry air were fed on to a gas accumulator (Parker ACP- 05AA100E1KTC)
in sequence for the first premix process. Gas feeding time was adjustable. The gas feeding
pressure was controlled by regulator and monitored by a pressure transducer (Omega PXI-300). After a mixing time of 15 seconds, mixed gas was pushed into chamber by high pressure nitrogen. It took 15 seconds to pump mixture to chamber. This duration is also adjustable. The
gas pressure in chamber before premixed combustion was monitored by a digital pressure gauge mounted on chamber top. Gas continued mixing in chamber for another 15 seconds.
3.1.3 Fuel injection system
The injector employed in this study was an outwardly opening piezo gasoline direct
injection fuel injector, as shown in Figure 3.4. It was controlled by a piezo injector driver from Drivven (a subsidiary of National Instruments, Inc.). Trigger signal could be generated by an
external pulse delay generator or an integrated Labview program via the signal from timing board PCI-6602. Fuel pressure was controlled by a gasoline common rail fuel system. A typical gasoline fuel filter is used to remove fuel impurities and protect high pressure pump. The high
pressure pump is controlled by the pressure signal feedback from rail with a PID loop. The high pressure pump is driven by a 3 Horsepower motor (Marathon G590) which runs at its
18 3.1.4 Ignition system
The ignition system was made up of a spark plug (Bosch Platinum 4++), a plasma
ignition coil (Okada PD1002102R) and a 12V battery. The plug gas and the pulse width were tuned to 1.6 mm and 5 ms respectively to obtain the best performance according to experiment
observation. The spark plug was mounted at the top of chamber body. In this study, the ignition system was mainly used to ignition premixed gases to generate desired experimental conditions.
3.2 Data acquisition and control system
3.2.1 Hardware and software configuration
All electrical devices on CVCC system could be remote controlled by employing NI PCI-6040E, PCI-6014 and PCI-6602 DAQ boards as the signal source. Both automatic and manual operation of the system were enabled by integrated NI Labview programs. A control
box was constructed to accommodate all the electric parts including relays, power supply, protection circuits, DC power supply, injector and high pressure pump drivers and data
communication interfaces, as shown in Figure 3.5. Power supply for fuel pump and spark plug were separated for safety considerations.
3.2.2 Pressure measurement
An Omega pressure sensor (PX209-300A5V) was utilized to measure gas pressure in
inlet gas lines. According to experiment results, calibration of this pressure sensor is necessary before experimental measurements. Chamber static pressure before premixed combustion was measured by a digital pressure gauge. This gauge was designed to check possible gas leaking.
19 Kistler 6041A transducer coupled with a Kistler 5004 charge amplifier. A water-cooling system was employed to avoid thermal shock. Typical pressure development during premixed
combustions were illustrated in Figure 3.6.
3.2.3 Optical diagnostic system
Spray and flame images were captured by a Phantom V4.3 non-intensified high speed camera. Its spectral response spans from 400 to 800 nm, covering the visible light spectrum.
Camera setting, including resolution, frame rate and exposure time, were set appropriately according to experiment requirement. Band pass filters (550nm and 650nm) with 10nm band
pass width were employed to capture emissions at selected wavelengths. Neutral density filters sometimes were utilized to manipulate emission intensity.
3.2.4 Experimental procedure
For spray combustion experiments, the high temperature and high pressure
environment was generated by a premixed combustion of a mixture of acetylene, O2/N2
(50%/50%) and dry air. A simplified experimental procedure is illustrated in Figure 3.7. Premixed acetylene/air mixture was filled into the chamber. After the ignition by a spark plug,
combustion occurs, which results in a high temperature and a high pressure environment. The premixed combustion is lean to reserve extra oxygen for the second combustion. Ambient
oxygen concentration is adjusted by the compositions of premixed gases controlled by partial pressure during the gas inlet process.
Pressure data was collected by the Kistler 6041A transducer. After the premixed
20 calculated by using corrected ideal gas equation. Fuel injection was triggered at desired ambient temperature. Both ambient oxygen concentration and ambient temperature before fuel
injection are critical for fuel spray combustion. Gas density in the constant volume combustion chamber was constant. It could be manipulated by increasing or decreasing gas partial
21 3.3 Tables and figures
Table 3.1 Maximum allowable stresses at different positions on chamber [21]
NO. Connection position/parameter Max allowable stress(psig)
1 Steel Plug (Hoop stress) 10,559
2 Retainer (Thread shear stress) 11,159
3 Injector (Thread shear stress) 56,532
4 Spark plug (Thread shear stress) 23,567
5 Pressure sensor (Thread shear stress) 15,005
6 Spark plug support (Thread shear stress) 14,952
7 Intake/Exhaust (Thread shear stress) 15,005
22
1 10
9 8
7 6
5 4 3 2
Figure 3.1 1 Experimental system: 1.fuel injector; 2.exhaust line; 3.chamber body; 4.quatz window; 5. plug/window retainer; 6. pressure transducer; 7.intake line; 8.metal plug; 9. spark plug; 10. combustion chamber.
Figure 3.2 3-D structure of the chamber body design
Cleaning hole
Quartz window
Gas inlet/out
Injector Solid plug
23 Figure 3. 3 The diagram configuration of gas supply system
Figure 3. 4 The diagram configuration of fuel delivery system.
Chamber
C2H2
Air O2/N2
Vaccum pump
4
1
2
3 5
6 7
8 9
10
Accumulator
Pressure sensor
N2
Vaccum pump
Atmospheric environment
Solenoid valve Check valve
Motor
Low pressure pump High pressure
pump
Fuel tank Common rail
Injector
Filter
24 Figure 3. 5 The actual control and data acquisition system
Figure 3.6 Typical pressure development during premixed combustion
•Injector driver
•Charge amplifier
Signal generator
•Control box:
•1. High pressure pump driver
•2. Valves control relays
•3. DC power supply
DAQ connector block
0 0.5 1 1.5 2 2.5 3
10 20 30 40 50 60 70 80
Time after start of ignition (s)
P
re
s
s
u
re
(
b
a
r)
25 Figure 3.7 Experiment procedure
Premixed gas combustion
X% of O2 left for spray
combustion
Fuel injection under desired temperatures
26
4. GDI Fuel Sprays Using a Piezoelectric Injector under Different Ambient
Pressures
4.1 Introduction
It is well known that gasoline direct injection (GDI) engines have considerable benefits on reducing exhaust emissions and increasing fuel efficiency. Compared with conventional port-fuel injection (PFI) engines, GDI engines generally have around 5% - 10% higher miles
per gallon (MPG), and lower greenhouse gasemissions [22 - 25]. In recent years, research on GDI engines is mostly focused on new alternative fuels and injection strategies.
Naphtha is a kind of fuel with less processed refinery stream in the gasoline boiling and carbon number range, lower octane number and higher heating values compared to commercial
gasoline. It draws attentions due to its high volatility and stronger resistance to auto-ignition, which potentially could be used for high efficiency compression-ignition combustion with low emissions. Producing naphtha is significantly simpler in a refinery compared to gasoline [26].
According to the refining process, naphtha fuels generally can be categorized as heavy naphtha (HN) and light Naphtha (LN) [27]. Investigations have been performed on the thermal
efficiency, combustion and emission characteristics of naphtha. The Saudi Aramco Fuel Technology research team has been extensively investigating the low octane (naphtha) fuels and gasoline compression ignition (GCI) engine interactions both experimentally [27-29] and
numerically [30-33]. They have reported up to 26% increase in efficiency compared to gasoline spark ignition (SI) engines. Similar observation were found also by Han et al [34]. Their work
demonstrated that the low octane gasoline-GCI pathway leads to a 24.6% reduction in energy consumption and a 22.8% reduction in greenhouse gas emissions. Wang et al. [35] compared naphtha and commercial gasoline on multiple premixed compression ignition (MPCI) mode.
27 same experimental system and combustion mode, they also found that the combustion delay of naphtha fuel is extended with the increase of injection pressure. The soot emission decreases
at high injection pressure with a penalty of higher CO and HC emissions [36]. Manente et al. [37] studied the effect of gasoline-like fuels’ properties on the performance and emissions of
an engine running in partially premixed combustion mode (PPC). Engines operating on lower octane number gasolines were also capable to run idle without increasing the inlet temperature [38]. A more optimized combustion chamber design was also developed by Chang et al. [39]
to improve idle and light load combustion stability of naphtha fuels. The application of low cetane number (CN) naphtha fuels on diesel CI engines were evaluated by Won et al. [19] and
Chang et al. [40] with different bowl and nozzle designs. It turns out that diesel CI engine can run with low CN naphtha fuels without compromising comfort, drivability, emissions or power requirements. CN 35 naphtha fuel was recommended for its better robustness and lower HC
and CO emissions. Viollet et al. [41] developed three newly designed pistons to enable naphtha compression ignition combustion. Zhang et al. [42] compared naphtha fuel and ultra-low sulfur
diesel (ULSD) under both conventional and low temperature combustion modes. Naphtha fuels exhibited appreciably lower levels of soot compared to ULSD across the investigated engine operation range while maintaining a diesel equivalent fuel efficiency.
Meanwhile, the impact of injection strategies has been demonstrated to be significant on fuel combustion and particles emission [43]. Injection rate shaping is one of the most
attractive alternatives to multiple injection strategies [44]. Currently, solenoid-actuated inwardly opening multi-hole injectors and piezo-electrically actuated outwardly opening injectors are predominant injectors in GDI engines. Solenoid injectors are more economical
28 attentions because of their sensitive and fast response, which are significant for small quantities or closely spaced multiple injections [46]. Spray from a piezo injector has a hollow-cone
structure with visible striations and filaments. Unlike hollow cone pressure-swirl sprays, no collapse arises with the spray development [47], and this spray pattern is quite repeatable [48].
Studies have been done on both types of injectors in GDI engines in the past few years. Smith et al. [49] conducted a systematic performance comparison of two spray-guided, single-cylinder, spark-ignited direct-injected (SIDI) engine combustion system designs with both
solenoid and piezo injectors and found that the two kinds of injectors have comparable combustion stability and smoke emissions. Achleitner et al. [50] demonstrated the possibility
to develop a spray-guided combustion system to meet the requirements to the maximum possible extent by using a piezo injector. Skogsberg et al. [48] and Wang et al. [51] explored the atomization of sprays generated by a piezo injector. It was shown that a leading edge vortex
is formed at the outer periphery of the spray. The location of the leading edge vortex depends on back pressure. Zhang and co-authors [52] demonstrated that the cone angles at the
developed phase for alcohol fuels and isooctane are consistently stable for a solenoid swirl GDI fuel injector. Higher injection pressure helps reduce droplet size.
Multiple techniques were employed to explore the spray characteristics of a piezo
injector. Zigan et al. [53] applied a planar imaging technique to investigate the spray formation and fuel evaporation of a piezo injector in direct injection spark ignition (DISI) engines. They
noted that fuel vapor and smaller droplets follow the recirculating flow and concentrate in the reduced pressure regions. Shi et al. [54] carried out spray experiments using a Mie scattering technique and a phase-Doppler anemometry (PDA) measurement in a conditioned pressure
29 spray. Stiehl et al. [55] used a time-resolved particle image velocimetry (PIV) technique to reveal significant spray-induced vortices perturbing the tumble flow. Recirculation vortices
were found to form at both the inner and outer edges of the hollow cone. In addition, spray penetration length and spray angle follow a steep rise with linear slope as long as the nozzle is
open, and the outer recirculation vortex therefore provides a favorable zone for ignition [56]. While studies of piezo injectors and naphtha fuels have been undertaken, little study was done on fuel spray characteristics of naphtha fuels with a GDI piezoelectric outwardly
opening hollow-cone fuel injector under different back pressure conditions, and experimental validated data was insufficient for unconventional fuels. Therefore, light naphtha (LN), PRF95,
and E10 gasoline sprays using a GDI piezo fuel injector are studied and compared in this study. The ambient pressure was changed from the atmospheric condition up to 10 bar for the three fuels. The spray angle, spray front penetration length, spray front penetration velocity, and
spray front fluctuation were calculated and discussed.
4.2 Diagnostics and Measurements
The spray development during fuel injection process was visualized by applying a
Mie-scattering technique, as shown in Figure 4.1. A high-speed camera (Phantom V4.3 from Vision Research Inc.) was employed to capture spray images of each selected fuel. The frame rate was set at 25,000 frames per second (fps) with a resolution of 128×128 pixels. The camera exposure
time, aperture and other parameters were set appropriately and kept constant. Injector and camera were triggered simultaneously by an external pulse generator. More details of the
30 Three fuels were selected including light naphtha (LN), primary reference fuel (PRF), and E10 gasoline. LN mostly consists of molecules with 5-6 carbon atoms. LN was obtained
from Saudi Aramco, with an AKI value of 61. Conventionally, PRF is a binary mixture of iso-octane and n-heptane and is used as a surrogate for gasoline. PRF used in this work was PRF95,
a blend of 95% iso-octane and 5% n-heptane by volume. The AKI of PRF95 is 95 [59]. The gasoline fuel (AKI = 87) was obtained by mixing fuels with equal volume ratios from three different local gas stations (Shell, Exxon and BP). It contains up to 10% ethanol by volume
(often referred as E10). The tested gasoline fuel represents the commercially available regular grade gasoline on the market at most gas stations. For all experiments, the injection duration
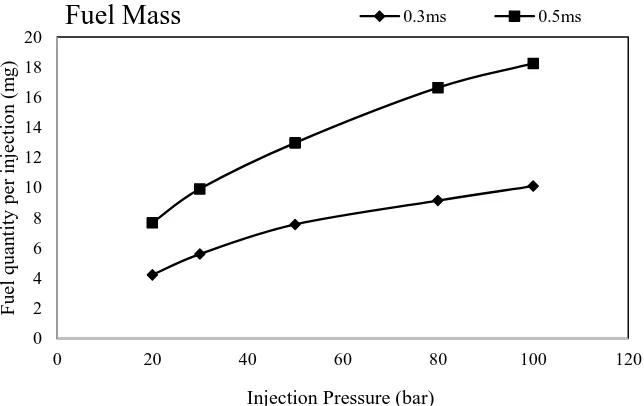
was set as 0.3 ms and the injection pressure was kept at 10 MPa (100 bar). Chamber and fuel temperature were the same as the ambient for all experiments, namely 298 K. Fuel mass per injection was around 10 mg per injection. Selected fuel properties are listed in Table 4.1 [60 -
62].
In order to characterize the spray of different fuels, the spray angle, spray front
penetration length, spray front penetration velocity, and spray front fluctuation were calculated and compared. Since the spray developed freely and had no definite angle after the end of the injection (around 430 μs ASOIT), transient spray angles were calculated only from the
beginning to the end of each single injection. The spray front penetration length, spray front penetration velocity and spray front fluctuation were analyzed in a much longer time interval (up to 790 μs ASOIT). Depending on the spray structure, certain key parameters may be
31 4.2.1 Spray angle definitions
The spray angle is defined as the angle between two spray edges at pre-determined
locations near the injector tip at a specified time after the start of fuel (SOF) [63]. Specifically,
reference points are defined for each image at two different axial distances downstream from the
injector tip.To calculate the spray angle, spray edges were detected using a Matlab code developed
in-house with the same threshold for all transient images in each single injection. Two spray edges
were marked red and blue separately as shown in attached figures. Multiple selections of the
references points were used in literatures. Wang et al. [51] selected the average angle between the
whole detected spray edges as the spray angle, especially for spray under atmospheric conditions
(Definition A). However, under an environment with a pressure higher than the atmosphere, an
obvious vortex can be found at downstream of the spray edges. This vortex results in a swell on
the spray edges and affects the spray angle calculation. Therefore, 5 mm to 15 mm downstream of
the injector tip is recommended for defining reference points by SAE international [53].
Considering that the spray front penetration length at the end of the injection under high pressure
is much shorter than atmospheric condition, the effective spray edges in this study used for spray
angle calculation are limited within 5 mm to 10 mm downstream of the exit plane (Definition B).
In our study, the vortex is even stronger since the ambient pressure was set up to 10 bar. In order
to completely eliminate the effect of the vortex, a third spray angle, defined as the angle between
the two spray edges located within 1-5 mm downstream of the exit plane, is also applied to spray
angle calculation (Definition C). In this near-nozzle region, there is no or little occurrence of vortex
at spray edges even for high ambient pressures. The schematics of the three definitions are
illustrated in Figure 4.2. These different spray angle definitions are discussed and compared in this
section. For LN, PRF95, and gasoline, only one properly selected spray angle definition was
32
LN is selected as an example to compare the differences in the spray angles obtained from
the three definitions. The spray angle results under different ambient pressures are shown in Figure
4.3. Apparently, three definitions lead to distinct spray angle developments. For Definition A, the
spray angle slowly increases with time, and the slope becomes larger for a higher ambient pressure.
Meanwhile, higher ambient conditions lead to smaller spray angles at the beginning and larger
spray angles by the end of the injection. Overall the spray angle ranges from 98° to 105° for this
definition. For Definition B, the spray angle still increases with time. However, both the slope and
the absolute value are much larger than the results in Definition A. In addition, a larger spray angle
is found at both the beginning and the end of the injection under higher ambient pressures. The
spray angle range rises from 100° to 113° for Definition B. While for Definition C, the spray angle
variation among different ambient pressures is much smaller than Definitions A and B. The spray
angle stays quite stable under each ambient condition for Definition C and only a slight increase is
observed under the 10 bar condition.
The spray angles using different definitions were compared under selected ambient
conditions in Figure 4.4. Definition B leads to a much larger spray angle compared with Definitions
A and C, and the difference is getting larger with increasing ambient pressure. Results of
Definitions A and C are quite close for most injection process, but a slightly higher spray angle is
noticed with Definition A at the end of the injection. This phenomenon is expected because, in this
study, the spray vortex is mostly located at the downstream for all selected ambient pressures,
while the spray edge at the upstream is smooth and stable. Definition B mostly covers the vortex
area, which apparently make the spray angle larger. Moreover, the location of the vortex moves
toward the exit plane with increasing ambient pressure, which means more vortex regions are
covered under higher ambient pressure conditions for Definition B. Thus the difference between
Definition B and Definitions A and C is getting larger under higher ambient pressures. Definition
33
A and C have the same effective sprays edges. Therefore, during the early injection stage, the spray
angle results of Definitions A and C are close. For the later injection process, Definition A
gradually covers the vortex region. As a result, the spray angle using definition A is higher than
definition C during this stage.
Overall, the largest spray angle is found for Definition B, which covers the most of swell
area caused by the vortex. This indicates that the vortex is a key factor that has great influence on
the spray angle calculation. In order to eliminate the effect of the vortex, Definition C is employed
in this study for all three selected fuels to show the near-nozzle spray angles.
4.2.2 Spray penetration length definitions
Similar to the spray angle, the spray front is detected and marked by green lines for the spray front penetration length calculation. Generally, there are two different spray penetration
length definitions widely used in literatures. In most cases, spray penetration length is defined as the average distance between the entire detected spray front and the exit plane (Definition
A). The other definition adopts the distance between the exit plane and the furthest detected spray location as the spray penetration length (Definition B). Definition B is mostly used for spray plumes that are inclined to the spray axis [63]. The logic of two definitions is presented
in Figure 4.5. Again, LN is selected as an example, and the spray penetration length is calculated using two different definitions, as shown in Figure 4.6. Comparison of the spray
penetration length of the two definitions under different ambient pressure conditions is shown in Figure 4.7. Apparently the penetration length using Definition B is longer than Definition A
34 The spray penetration velocity is also calculated based on two different penetration length definitions, as presented in Figure 4.8. As expected, the spray penetration velocity with
different definitions develops distinctly. The spray penetration velocity development for Definition A is quite consistent for all the investigated ambient pressures. A velocity peak is
observed at almost the same timing right after the end of the injection for all investigated ambient conditions. While for Definition B the spray penetration velocity has visibly stronger fluctuations than Definition A for all the ambient pressures, and the velocity peak location
varies a lot for different ambient pressures. In order to make more reliable quantitative results comparison for different fuels, Definition A was used for all the penetration length and velocity
calculations as shown in the following section.
4.2.3 Spray front fluctuation definition
The spray front fluctuation is defined as the standard deviation of the entire detected spray front in this study. This definition is independent from the selections of spray angle and
spray penetration length definitions.
4.3 Results and Discussions
In this section, macroscopic spray features of LN, PRF95 and gasoline are presented and analyzed, respectively. Spray angle (Figure 4.2, Definition C), spray front penetration
35 4.3.1 LN results
A set of LN spray images with marked spray edges and front under different ambient
pressures are presented in Figure 4.9. It is seen that the spray develops smoothly with a clear filamentary hollow-cone structure at the atmospheric condition. The spray front stays quite
evenly during the injection process. However, the filamentary structure gets blurred with increasing ambient pressure, and a noticeable toroidal recirculation vortex is observed at the downstream region of the spray, which deforms the hollow-cone shape. A shrinking spray
dimension or size is also noted with increasing ambient pressure. Similar to the discussion in [51], an increase of fuel liquid signal at frames after the end of the injection is noticed for all
the selected ambient conditions. This is believed to be caused by the shutting off of the injector pintle, which squeezes out the residual fuel in the gap between the pintle and the injector body. This may result in a velocity increase and more spray front fluctuation after the end of fuel
injection as discussed later. In order to better understand the ambient pressure effect on the toroidal recirculation vortex formation, the spray structure is evaluated with contour-plots at
selected ambient pressure conditions, as shown in Figure 4.10. The reduction in the spray radial and axial penetrations with increasing ambient pressure is distinctly observed in this figure. Martin et al. [56] described a parallel moving string shape at the spray front with GDI fuel
injectors. A similar phenomenon is observed in this study for all the selected ambient conditions, which indicates a relatively uniform velocity distribution at the spray font.