IN-STRUCTURE SEISMIC ACCELERATION RESPONSE SPECTRA
GENERATED FROM NONLINEAR VS. LINEAR BUILDING RESPONSE
ANALYSIS
Jorma Arros1, Nikolay Doumbalski2
1
Associate, MMI Engineering, Oakland, CA ([email protected]) 2
Project Engineer, MMI Engineering, Oakland, CA
ABSTRACT
Linear and nonlinear analyses of the response of a fictitious reinforced concrete building with a HCLPF capacity of 0.65g PGA to the ground motion of the 1994 magnitude 6.7 Northridge earthquake were performed to study differences in the in-structure accelerations depending on which of the two modeling assumptions were used. Analyses were performed for three levels of ground motion intensity by scaling the actual ground motion records to 0.75g, 0.5g and 0.2g PGA. The results indicated quite marked differences in the in-structure response spectra, with the values from the nonlinear analyses being lower, even at the low 0.2g PGA level for the relatively high capacity structure. In particular, the spectral peaks and typically, but not always, also the zero period acceleration values from the nonlinear analyses, were lower than those obtained from the linear analyses. The results of the work provide insights to the magnitude and the nature of the differences between in-structure spectra generated from linear vs. nonlinear response analyses and help in assessing when nonlinear analysis may be beneficial and more appropriate. The results and conclusions will aid in the process to enhance the procedures for seismic response analysis and equipment seismic qualification in nuclear power plant structures.
INTRODUCTION
Typically, seismic qualification of equipment mounted in nuclear power plant buildings is performed based on the in-structure acceleration response spectra at the location of the equipment. In the past, the in-structure acceleration response spectra have customarily been computed from the acceleration time histories stored for the desired locations throughout a building during a linear building time history response analysis. With the evolving requirements for seismic evaluations, especially with the need to perform seismic evaluations for higher levels of ground motions in response to the Fukushima event and the Generic Safety Issue GI-199 [US NRC (2005)], there is a growing need for nonlinear building response analysis and generation of in-structure acceleration response spectra using the responses from nonlinear response analyses.
With the advances in computer hardware and software, performing nonlinear response analyses of NPP structures has not only become feasible, but significant experience has been gained in such analyses in various engineering disciplines. However, to date, the NPP industry practice is to perform the seismic response analyses using linear modeling. The main objective of the work discussed in this paper was to gain insights about the differences between in-structure spectra generated from nonlinear vs. linear response analyses.
MODELING
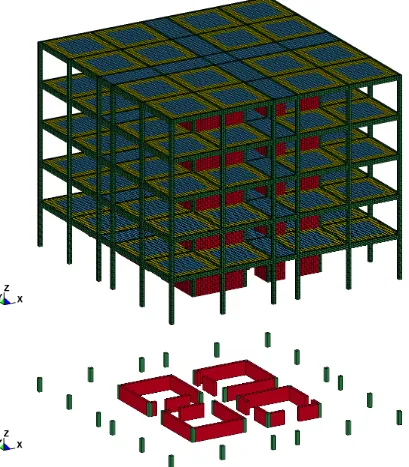
Figure 1. The shear walls are 0.3m thick and the slabs are 0.4m thick. The columns are 0.3m square. The main lateral load resisting shear walls have a reinforcement ratio of 1% both horizontally and vertically. Material properties are provided in Table 1.
Figure 1: 3D view of solid model (top) and the base of structure (bottom)
Table 1: Material properties Material Modulus of
Elasticity [MPa]
Poisson Ratio
Yield Stress [MPa]
Compressive Strength [MPa]
Tensile Strength [MPa]
Concrete C25/30
31,000 0.17 - 25.00 2.60
Reinforcing Steel
The Winfrith concrete material model (*MAT_085) in 8-noded solid elements with smeared reinforcement representation was used to model the reinforced concrete walls, slabs and columns. The walls and columns had three and slabs had four elements through the thickness. Four elements through the thickness were used for the slabs as vertical, out-of-pane accelerations were tracked at the selected mid-panel slab nodes; and typically, for single point integrated elements, four elements through the thickness are considered minimum. As flexural response was not of interest for the walls and columns, three elements through the thickness were used in this study – mainly to control run times.
EARTHQUAKE LOADING
Actual records from the Northridge 1994 magnitude 6.7 earthquake were utilized for the ground motion definition. The accelerograms and 5% damped acceleration response spectra from station IIEA097 USC (1994), with an epicentral distance of 10.8 km, are shown in Figure 2.
-0.4 -0.3 -0.2 -0.1 0.0 0.1 0.2 0.3 0.4 0.5
0 5 10 15 20 25 30
Northridge 00 -0.4 -0.3 -0.2 -0.1 0.0 0.1 0.2 0.3 0.4
0 5 10 15 20 25 30
Northridge 90 -0.4 -0.3 -0.2 -0.1 0.0 0.1 0.2 0.3 0.4
0 5 10 15 20 25 30
Northridge UP 0.0 0.2 0.4 0.6 0.8 1.0 1.2
0.1 1 10 100
Northridge 00 Northridge 90 Northridge UP
ANALYSES AND RESULTS
HCLPF Capacity of the Building
Based on a response spectrum analysis with a linear version of the model, using a spectral shape provided by the USGS website for the vicinity of the Northridge earthquake epicenter, the HCLPF capacity [EPRI (1991, 1994, 2009)] was estimated as 0.65g PGA – governed by the shear wall capacity at the base.
Modal Frequencies
Modal analysis indicated the first modes, sway in X and Y-directions, having frequencies of about 6Hz.
Earthquake Time History Analysis
Time history analyses were performed and in-structure acceleration spectra computed utilizing the three ground motion acceleration histories of Figure 2 for six cases with the time histories scaled as follows:
1. The ground motion PGA scaled to 0.2g - linear analysis 2. Same as Case 1, except nonlinear analysis
3. The ground motion PGA scaled to 0.5g - linear analysis 4. Same as Case 3, except nonlinear analysis
5. The ground motion PGA scaled to 0.75g - linear analysis 6. Same as Case 5, except nonlinear analysis
Based on the material properties and element size, the explicit time integration algorithm in LS-DYNA set the time step based on the inherent stability condition to 2.2E-05. A constant 5% damping over the 5 Hz to 70 Hz frequency range was specified (*DAMPING_FREQUENCY_RANGE).
To control run times, the transient runs were performed only through the first 15 seconds of the excitation as it was evident that the lower level of excitation during the last 15 seconds did not affect the computed in-structure acceleration response spectra.
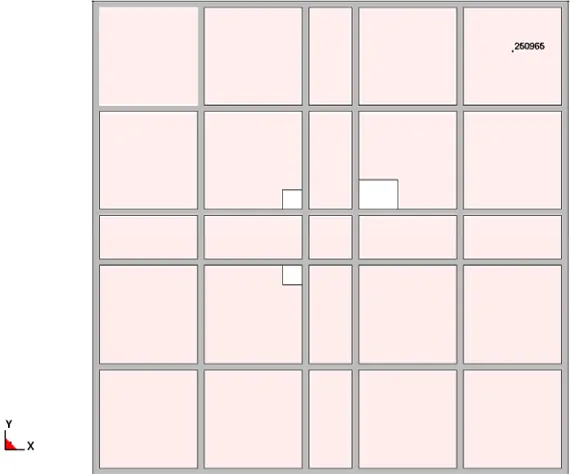
During the transient runs, displacements and accelerations were stored at the two nodes indicated in Figure 3.
In all the following time history and spectra plots, the continuous curves are from linear building response runs and the dashed curves are from nonlinear building response runs.
Figure 4 shows relative displacement time histories in the X, Y, and Z-directions for the node on the fourth floor for Case 4; 0.50g PGA. As expected, the displacement peaks from the nonlinear run have higher magnitudes than the peaks from the linear run. The Z-curve from the nonlinear run also indicates slight permanent deformation – drop.
-0.025 -0.020 -0.015 -0.010 -0.005 0.000 0.005 0.010 0.015 0.020
0 3 6 9 12 15
Linear (X) NonLin (X)
-0.020 -0.015 -0.010 -0.005 0.000 0.005 0.010 0.015 0.020
0 3 6 9 12 15
Linear (Y) NonLin (Y)
-0.008 -0.006 -0.004 -0.002 0.000 0.002 0.004 0.006
0 3 6 9 12 15
Linear (Z) NonLin (Z)
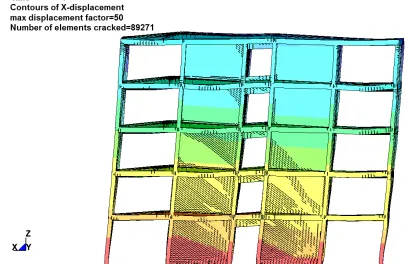
Figure 5 illustrates deformation and cracking at the time of peak X-deflection – the plot has a displacement scale factor equal to 50; significant cracking in the lower level shear walls is evident. The slab deflections are larger at the top floors.
Figure 5: Cracking at the time of max horizontal displacements – displacement plot scale factor = 50 – 0.50g PGA
0 2 4 6 8
0.1 1 10 100
(X) Linear (X) NonLin
0 6 12 18 24 30
0.1 1 10 100
(X) Linear (X) NonLin
0 2 4 6 8
0.1 1 10 100
(Y) Linear (Y) NonLin
0 6 12 18 24 30
0.1 1 10 100
(Y) Linear (Y) NonLin
0 5 10 15 20
0.1 1 10 100
(Z) Linear (Z) NonLin
0 10 20 30 40 50
0.1 1 10 100
(Z) Linear (Z) NonLin
0 5 10 15 20
0.1 1 10 100
(X) Linear (X) NonLin
0 20 40 60 80
0.1 1 10 100
(X) Linear (X) NonLin
0 5 10 15 20
0.1 1 10 100
(Y) Linear (Y) NonLin
0 20 40 60 80
0.1 1 10 100
(Y) Linear (Y) NonLin
0 10 20 30 40 50
0.1 1 10 100
(Z) Linear (Z) NonLin
0 30 60 90 120
0.1 1 10 100
(Z) Linear (Z) NonLin
0 10 20 30
0.1 1 10 100
(X) Linear (X) NonLin
0 40 80 120
0.1 1 10 100
(X) Linear (X) NonLin
0 10 20 30
0.1 1 10 100
(Y) Linear (Y) NonLin
0 40 80 120
0.1 1 10 100
(Y) Linear (Y) NonLin
0 25 50 75
0.1 1 10 100
(Z) Linear (Z) NonLin
0 60 120 180
0.1 1 10 100
(Z) Linear (Z) NonLin
CONCLUSION
Linear and nonlinear analyses of the response of a fictitious reinforced concrete building, with a HCLPF capacity of 0.65g PGA, to the ground motion of the 1994 magnitude 6.7 Northridge earthquake were performed to study differences in the in-structure accelerations depending on the method used. Analyses were carried out for three levels of ground motion intensity by scaling the actual ground motion records to 0.75g, 0.5g and 0.2g PGA. The results indicated quite marked differences in the in-structure response spectra; the values from the nonlinear analyses being lower, even at the low 0.2g PGA level for the relatively high capacity structure. Particularly, the spectral peaks and typically, but not always, also the zero period acceleration values from the nonlinear analyses were lower than those obtained from the linear analyses.
The results of the work provide insights as to the magnitude and the nature of differences between in-structure spectra generated from nonlinear vs. linear response analyses and provides indication when nonlinear analysis may be beneficial and more appropriate. The results and conclusions will aid in the process to enhance the procedures for the seismic response analysis and equipment seismic qualification in NPP structures.
REFERENCES
Electric Power Research Institute (EPRI). (1991). A Methodology for Assessment of Nuclear Power Plant
Seismic Margin, Report NP-6041-SL, Revision 1.
EPRI. (1994). Methodology for Developing Seismic Fragilities, Report TR-103959. EPRI. (2009). Seismic Fragility Applications Guide Update. Palo Alto, California.
Livermore Software Technology Corp. (LSTC). (2013). LS-DYNA software, Livermore, Califonia, http://www.lstc.com
University of Southern California (1994).
ftp://cwis.usc.edu/pub/todorovs/North_aft_M5/USC/MAIN/V2/V2X0600.USC
![Figure 2: Ground motion: time histories [units are sec and g] and 5% damped acceleration response spectra [units are Hz and g]](https://thumb-us.123doks.com/thumbv2/123dok_us/1509628.1184887/3.612.141.477.235.694/figure-ground-motion-histories-damped-acceleration-response-spectra.webp)
![Figure 4: Relative displacements comparison – 0.50g, 4th floor (Node 647925) [units are sec and m]](https://thumb-us.123doks.com/thumbv2/123dok_us/1509628.1184887/5.612.109.507.168.592/figure-relative-displacements-comparison-floor-node-units-sec.webp)
![Figure 6: Response Spectra – Comparison – 0.20g, 1st floor (left) and 4th floor (right) [units are Hz and m/sec2]](https://thumb-us.123doks.com/thumbv2/123dok_us/1509628.1184887/7.612.71.550.71.600/figure-response-spectra-comparison-floor-floor-right-units.webp)
![Figure 7: Response Spectra – Comparison – 0.50g, 1st floor (left) and 4th floor (right) ) [units are Hz and m/sec2]](https://thumb-us.123doks.com/thumbv2/123dok_us/1509628.1184887/8.612.71.550.70.600/figure-response-spectra-comparison-floor-floor-right-units.webp)
![Figure 8: Response Spectra – Comparison – 0.75g, 1st floor (left) and 4th floor (right) ) [units are Hz and m/sec2]](https://thumb-us.123doks.com/thumbv2/123dok_us/1509628.1184887/9.612.74.548.81.611/figure-response-spectra-comparison-floor-floor-right-units.webp)