INVESTIGATION
A Test for Selection Employing Quantitative Trait
Locus and Mutation Accumulation Data
Daniel P. Rice*,1and Jeffrey P. Townsend*,†,2
*Department of Ecology and Evolutionary Biology and†Program in Computational Biology and Bioinformatics, Yale University, New Haven, Connecticut 06520
ABSTRACTEvolutionary biologists attribute much of the phenotypic diversity observed in nature to the action of natural selection. However, for many phenotypic traits, especially quantitative phenotypic traits, it has been challenging to test for the historical action of selection. An important challenge for biologists studying quantitative traits, therefore, is to distinguish between traits that have evolved under the influence of strong selection and those that have evolved neutrally. Most existing tests for selection employ molecular data, but selection also leaves a mark on the genetic architecture underlying a trait. In particular, the distribution of quantitative trait locus (QTL) effect sizes and the distribution of mutational effects together provide information regarding the history of selection. Despite the increasing availability of QTL and mutation accumulation data, such data have not yet been effectively exploited for this purpose. We present a model of the evolution of QTL and employ it to formulate a test for historical selection. To provide a baseline for neutral evolution of the trait, we estimate the distribution of mutational effects from mutation accumulation experiments. We then apply a maximum-likelihood-based method of inference to estimate the range of selection strengths under which such a distribution of mutations could generate the observed QTL. Our test thus represents thefirst integration of population genetic theory and QTL data to measure the historical influence of selection.
I
DENTIFYING which quantitative traits have been subject to strong selection and which have evolved under neutral or nearly neutral conditions is a challenging and important task for evolutionary biologists (Boakeet al.2002). To this end, biologists are devoting increased attention to the ge-netic basis and evolutionary causes of quantitative variation (Barton and Keightley 2002; Laiet al.2007; Barton and De Vladar 2009). On one hand, substantial progress has been made in revealing the genetic architecture of quantitative traits (Zimmermanet al.2000; Ashtonet al. 2001; Mackay 2001; Gleason et al.2002; Verhoeven et al.2004; Mackay and Lyman 2005; Brem and Kruglyak 2005; Laiet al.2007; Gleasonet al.2009). On the other hand, it has been difficult to connect the action of microevolutionary forces detected in studies of contemporary populations to their macroevolu-tionary effects (Grant and Grant 2002). Consequently, fewattempts to detect natural selection currently exploit the growing body of knowledge about the sizes and directions of quantitative trait locus (QTL) effects (for counterexamples, see Rieseberget al.2002; Albertsonet al.2003; Lexeret al.
2005).
Progress toward understanding the basis of quantitative genetic variation is likely to come from studying allelic variation at specific QTL (Barton and Keightley 2002). Iden-tifying the genetic architecture of quantitative traits begins with mapping QTL to broad genomic regions and ends with the molecular definition of quantitative trait loci alleles. This high degree of resolution has been achieved, for instance, for some QTL in Drosophila (Zimmerman et al. 2000; Mackay 2001; Palsson and Gibson 2004; Palsson et al. 2005). QTL mapping may be coupled with further genetic dissection (e.g., fine-scale mapping, disequilibrium mapping, transgenic ma-nipulation; Mackay 2001) to characterize the specific loci targeted by selection. Weiniget al.(2003) demonstrated that the QTL architecture behind herbivory tolerance was one of many loci of small effect and simultaneously elucidated locus-specific evolutionary constraints, demonstrating that linking molecular genetic tools to quantitative genetic analysis and field studies in ecologically relevant settings can clarify the role of specific loci in the evolution of quantitative traits.
Copyright © 2012 by the Genetics Society of America doi: 10.1534/genetics.111.137075
Manuscript received November 23, 2011; accepted for publication January 17, 2012 Supporting information is available online at http://www.genetics.org/content/ suppl/2012/01/31/genetics.111.137075.DC1.
1Present address: Department of Organismic and Evolutionary Biology, Harvard
University, 26 Oxford St., Cambridge, MA 02138.
2Corresponding author: Department of Ecology and Evolutionary Biology, Yale
These QTL studies not only generate maps from genotype to phenotype, but also yield information that may be applied to the study of phenotypic evolution (Ericksonet al. 2004). Behind every genetically based phenotypic difference lies an evolutionary history. Despite the evident relevance of QTL data to the study of the evolutionary process, very little the-ory has been developed to link data from QTL studies to population genetic parameters via the methods of molecular evolution. This lack of theoretical tools has inhibited progress in explaining the process underlying the evolution of pheno-types that are genetically dissected in empirical QTL studies. While most tests for selection depend directly on molec-ular data (McDonald and Kreitman 1991; Depaulis et al.
2003; Schlenke and Begun 2003; Mousset et al. 2004; Schlenke and Begun 2004; Nurminskyet al.2005; Schlenke and Begun 2005), Orr (1998a) presented two innovative attempts to integrate QTL data and population genetic the-ory into tests for selection: the QTL sign test and the QTL effect size test. These tests employ a null model of the evo-lutionary process that produces QTL. They have been ap-plied multiple times to empirical data (Rieseberg et al.
2002; Albertson et al.2003; Lexer et al.2005; Orr 2010). However, the QTL sign test has been deemed substantially flawed by its high false-positive rate (Anderson and Slatkin 2003) and the QTL effect size test has been shown to provide very low power to detect selection (Anderson and Slatkin 2003). Moreover, the tests neither model selection explicitly nor account for the distribution of mutational effects, both of which are important to accurately model the “filtering” ac-tion of natural selecac-tion (Orr 1998b).
Accordingly, understanding the evolutionary signifi -cance of QTL observations requires evaluation of both the origin and fate of heritable variation. In particular, the evolutionary forces that result in the genetic differences we observe must be estimated (Barton and Keightley 2002). Here we develop a test for a history of directional selection on quantitative traits and a method for estimating the strength of that selection. Using mutation accumulation (MA) data and the QTL effect distribution derived from a cross between two divergent populations, we infer the selective history of the trait. While existing tests (Orr 1998) only model neutral evolution and assume selection to be at work whenever data does notfit the model’s pre-dictions under neutrality, we model selection explicitly and consider neutrality as one potential inference on a contin-uum. Such aflexible model is a keyfirst step toward unrav-eling the complex link between molecular evolution and quantitative trait variation.
Theory
Overview
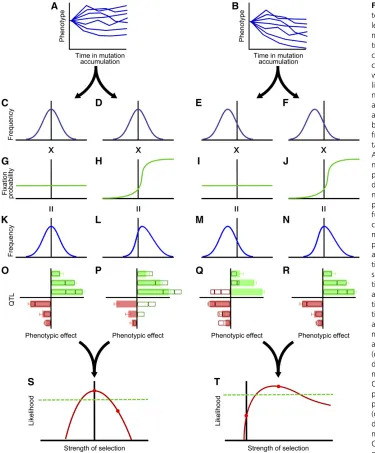
Our framework for inference integrates information from mutation accumulation experiment (Figure 1, A and B), population genetic theory on selection (Figure 1, G–J), the consequent expected outcome of selection (Figure 1, K–N),
and the empirically obtained QTL effect size distribution (Figure 1, O–R). In our schematic example, mutation accu-mulation is depicted as resulting in increased variance of the phenotype with no directional bias (Figure 1A) or, alterna-tively, as resulting in an increased variance in phenotype with a downward bias (Figure 1B). From phenotypic obser-vations obtained along the time course of a mutation accu-mulation experiment (Figure 1, A and B), the distribution of mutational effects on phenotype can be inferred (Figure 1, C–F). Data as in Figure 1A yield an inferred distribution of mutational effects that is symmetrical around no change (Figure 1, C and D); in contrast, data as in Figure 1B yield asymmetry (Figure 1, E and F).
We multiply the mutation effect distribution by the calculated probability of fixation as a function of the strength of selection corresponding to the phenotypic effect (Figure 1, G–J). For a neutral phenotype,fixation probabil-ities are equivalent across all phenotypes (Figure 1, G and I), whereas under selection,fixation probabilities depend upon the phenotype conferred (Figure 1, H and J). The product of the mutation effect distribution and thefixation probability distribution is the probability distribution of fixed pheno-typic differences resulting from substitutions at quantitative trait loci (Figure 1, K–N). Sampling a number of substitu-tions from this distribution and summing their effects (e.g.
Figure 1, O–R, outlines), we compare the cumulative effects with those of the observed QTL (Figure 1, O–R, bars). The accord between the sampled effects and the observed effects varies with the estimated mutation effect distribution and selective regime considered: the accord will be better when the level of selection is appropriate for generating fixed effects whose cumulative effects are close to those of the observed QTL. A likelihood function (Figure 1, S and T) quantifies thefit of the model and provides a test of the hypothesis of neutrality and an estimate of the strength of selection. In our schematic example, the MA and QTL data together could support an effectively neutral model (Figure 1, A, C, D, G, H, K, L, O, P, S). Alternatively, parameterizing with the same QTL data (Figure 1, O–R, bars), but with different MA data (Figure 1, A and B) could yield rejection of neutrality and thus, a conclusion that the quantitative trait has been subject to a history of selection.
the number of generations between observations, we esti-mate a Gaussian distribution of mutational effects (Turelli 1984; Sawyeret al.2003; Joneset al.2007).
We then derive the phenotypic effect fixation function from components of classical population genetic theory
approach to inferring the historical regime of genetic drift or natural selection.
We apply this test to an example trait, sensory bristle number in the fruitflyDrosophila melanogaster. The genetic architecture of Drosophila sensory bristle number is well studied (Lai et al.1994; Longet al.1995, 1996; Dilda and Mackay, 2002; Robin et al. 2002; MacDonald et al.2005; Mackay and Lyman 2005) and the selective history on this trait has been the subject of much debate (Mather 1941; Robertson 1955; Robertson 1967; Kearsey and Barnes 1970; Mackayet al.1994,).
Estimating the mutational effect distribution
To estimate the distribution of the phenotypic effects of mutations on the trait, we analyze the time course of a mutation accumulation experiment. Although the appro-priate formal distribution of the mutational effects for any given trait is unknown (Keightley and Lynch 2003), moments of the distribution of mutation effects on a trait can be inferred from the changes in the trait over time. For analytical tractability, we follow Turelli (1984), Sawyer
et al.(2003), and Joneset al.(2007) and assume that the effects of mutations on a trait follow a Gaussian distribution
fðx;m;sÞ ¼ ffiffiffiffiffiffiffiffiffiffiffiffi1
2ps2
p e2 ðx2mÞ2=2s2; (1)
with mean m and standard deviations. This notation and other notation to be used in the derivation of the model are summarized in Table 1.
The sum ofk independent normally distributed random variables with the same mean and variance is normally dis-tributed with meankmand varianceks2. Assuming
indepen-dence of mutational effects, the distribution of the total effect ofkmutations is
fðx;m;s;kÞ ¼ ffiffiffiffiffiffiffiffiffiffiffiffiffiffiffi1
2p ks2
p e2 ðx2kmÞ2=2ks2: (2)
The distribution of the total effect of the mutations that accumulate inggenerations is the sum of the distributions of
the effect of k mutations, as k varies from zero to infinity, weighted by the probability thatkmutations occur. If muta-tions are independent, the number of mutamuta-tions affecting the trait that occur in g generations follows a Poisson distribution,
Pðnumber of mutations¼kÞ ¼ðguÞ k
k! e2gu; (3)
whereuis the per generation rate of mutations affecting the trait. The sum overkof Equation 2 weighted by Equation 3 is
hðx;g;u;m;sÞ¼X
N
k¼1 ðguÞk
k! e2gu !
1 ffiffiffiffiffiffiffiffiffiffiffiffiffiffiffi 2p ks2
p e2 ðx2kmÞ2=2ks2
:
(4)
Equation 4 is an infinite sum and cannot readily be calculated exactly. In practice, however, accurate approx-imations for small gu may be achieved by sums of only a small number of terms normalized by the total of all terms considered. We included terms so that, for a given gu, the total Poisson weight of the terms was at least 0.999.
Inference of historical selection from QTL and MA data
Inference of historical selection from QTL and MA data requires specification of the relationship between the strength of selection and the distribution of effect sizes of mutations that fix in the population. To calculate the probability that a mutation with a particular effect would fix, we apply the solutions of selection–diffusion equations. Assuming that these equations hold, the probability of a new mutationfixing in the population is given by Kimura (1962),
PðfixationÞ ¼ 12e 2s
12e22Ns; (5)
where sis the selection coefficient andNis the population size.
Following Lande (1983) and Chevin and Hospital (2008), we assume that the selective value of the mutation is proportional to its quantitative effect on the trait. To avoid
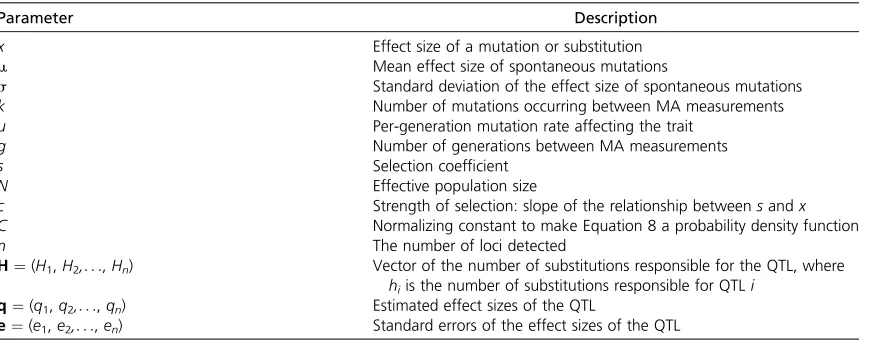
Table 1 Notation
Parameter Description
x Effect size of a mutation or substitution
m Mean effect size of spontaneous mutations
s Standard deviation of the effect size of spontaneous mutations
k Number of mutations occurring between MA measurements
u Per-generation mutation rate affecting the trait
g Number of generations between MA measurements
s Selection coefficient
N Effective population size
c Strength of selection: slope of the relationship betweensandx
C Normalizing constant to make Equation 8 a probability density function
n The number of loci detected
H¼(H1,H2,. . .,Hn) Vector of the number of substitutions responsible for the QTL, where
hiis the number of substitutions responsible for QTLi q¼(q1,q2,. . .,qn) Estimated effect sizes of the QTL
making assumptions about the optimal value of the trait, we assume that thefitness gradient did not change as the value of the trait changed. This assumption stands in contrast to some existing models of adaptive walks (Orr 1998; Martin and Lenormand 2006) that use a Gaussianfitness landscape. It is also a conservative assumption for our purposes: a walk toward a nearby optimum on a peakedfitness landscape will fix mutations of smaller effect than in our model, diminish-ing the signature of selection that our method is sensitive to. Additionally, we assume that adaptation proceeds by succes-sivefixation of beneficial mutations (Atwoodet al.1951), as opposed to simultaneous selection at many loci. If many loci are selected simultaneously, the strength of selection on a particular locus will tend to decrease over time (Chevin and Hospital 2008), rather than remain constant. Hence, the assumption of successive fixation is also conservative. Fur-thermore, we assume that the mutation has no other effects onfitness beyond its effect on the trait in question. Thus, for a mutation with phenotypic effectx,
s¼cx; (6)
wherecis a constant whose sign and magnitude determine the direction and strength of selection, respectively. A posi-tive value ofcindicates selection for an increase in the trait and a negative value ofcindicates selection for a decrease in the trait. Whenc= 0, the trait is neutral (i.e., the selection coefficient for a mutation of any effect size is zero). Substituting Equation 6 into Equation 5 yields
PðfixationÞ ¼ 8 > < > :
12e2cx
12e22Ncx; c6¼0 1
2N; c¼0
; (7)
which provides the probability that a mutation of sizexwill fix in the population.
The probability distribution of the phenotypic effects of substitutions is determined by the distribution of mutational effects multiplied by the relativefixation probability of those effects. Accordingly, multiplying Equation 1 by Equation 7 yields the distribution of effect sizes of substitutions, given that they havefixed
fðxÞ ¼C
12e2cx 12e22Ncx
1 ffiffiffiffiffiffiffiffiffiffiffiffi 2ps2
p e2 ðx2mÞ2=2s2
(8)
To makef(x) a probability distribution, Equation 8 contains a normalization constant, C, chosen to ensure that the in-tegral off(x)over allxis equal to one.
Methods
Overview of the data required
To infer a mutation effects distribution, we use the time course of a mutation accumulation experiment, specifically the change in trait value and number of generations between each
measurement in each line. We also use an independent estimate of the per-generation mutation rate of the trait. To calculate probabilities of fixation of mutants drawn from the effect distribution, we also use the historical effective popula-tion size of the populapopula-tion in quespopula-tion. To construct a likelihood function for the parameters underlying the observed change in the quantitative trait, we use the effect size and standard error of QTL identified by crossing individuals from two divergent populations that differ in the trait value.
Mutation effects distribution
Moments of the distribution of mutation effects on a trait were inferred from the changes in the trait value over the course of a mutation accumulation experiment. Given the change in the trait means, the number of generations between observations, and an independent estimate of the per-generation mutation rate for the trait, a likelihood function was specified for the parameters m and s of the distribution of mutation effects as
Lðm;sÞ ¼X i
lnhðxi;gi;u;m;sÞ; (9)
whereL(. . .) is the log likelihood,h(. . .) is from Equation 4, andxiandgiare the change in the mean value of the trait
and number of generations between each observation. The values of mandsfor which this function is maximized are the maximum-likelihood estimates of the parameters of the Gaussian distribution of mutational effect sizes.
Estimating selection
We also applied a maximum-likelihood framework to estimate the strength of historical selection on the trait. The phenotypic effect of each QTL is the result of one or more underlying substitutions, so we maximize the joint likelihood ofcand the vectorH= (H1,H2,. . .,Hn), whereHi
is the number of substitutions at theith locus and can be any positive integer, and n is the number of loci. There is no explicit constraint on the number of mutations at each locus, nor on the directions of the underlying mutational effects, only the constraint of the specified total effect. Thus, our method can properly accommodate amalgamations of sev-eral QTL that are detected as single QTL by a QTL analysis (cf. Mackay 2001; Mackay and Lyman 2005; Studer and Doebley 2011), even if the cryptic QTL are in opposing directions, just as it accommodates multiple mutations of opposing direction. The likelihood of c and H given the QTL data are the product of the joint likelihood ofc andH given each locus individually:
lðc;H;q;eÞ ¼Y n
i
lðc;Hi;qi;eiÞ: (10)
lðc;Hi;qi;eiÞ ¼ Z N
2Ngðx;qi;eiÞFðx;c;HiÞdx; (11)
whereg(. . .) is the probability density function of a Gaussian distribution with mean qi and standard deviation ei, and
F(. . .) is the probability density function of the sum of Hi
substitutions under strength of selectionc. The latter is cal-culated by Hi convolutions of f(x) from Equation 8 with
itself.
The integral in Equation 11 has no closed-form solution and is difficult to evaluate by typical numerical approaches for most values ofHi. We effectively approximated the
likeli-hood by Monte Carlo sampling from the distribution given by F(x) and calculating average value ofg(x) evaluated for each sampled effect:
lðc;Hi;qi;eiÞ
gxj;qi;ei
j¼ *
1 ffiffiffiffiffiffiffiffiffiffiffiffi 2pei2
p e2 ðxj2qiÞ2=2ei2 +
j :
(12)
Angle brackets represent averaging over all Monte Carlo samplesxj. As the number of Monte Carlo samples increases,
the right-hand side of Equation 12 approaches the true likelihood.
To calculate the likelihood of a given value ofc, wefixed
cat a value and evaluated the right-hand side of Equation 12 for a range of vectors ofH. For each locusi, we started with
Hi= 1 and then increased Hiuntil we found its unimodal
maximum likelihood value. We took the likelihood ofcto be the product over i of these likelihoods (Equation 10). We calculated the likelihood of a dense grid of values ofcin this way to obtainĉ, the maximum-likelihood value. To test the hypothesis of neutral evolution, we performed a likelihood-ratio test with a null hypothesis of c= 0 and an alternate hypothesis ofc=ĉ.
Sources of data
We applied our method to QTL and MA data for sensory bristle number inD. melanogaster. QTL effect size data were extracted from Dilda (2002), who had applied four different artificial selection regimes on bristle traits. Populations HST and LST were selected for high and low numbers of sterno-pleural bristles, respectively, while populations HAB and LAB were selected for high and low numbers of abdominal bristles. The QTL effects and standard errors from each pop-ulation are presented in Figures 3A, 4A, 5A, and 6A. These QTL were assayed by crossing the artificially selected pop-ulations with a wild-type laboratory strain. Because the QTL for this trait were assayed using artificially selected strains rather than phenotypically divergent strains from wild pop-ulations, our example serves to illustrate the use of the test rather than to make an inference about the selective history of the trait in the wild.
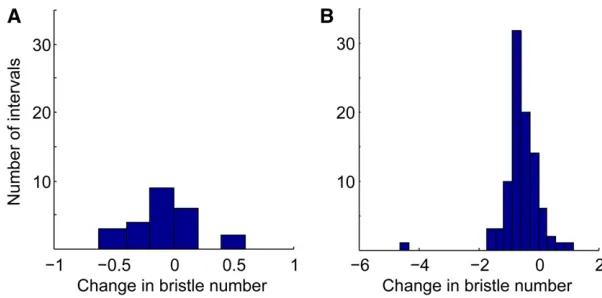
Mutation accumulation data for sternopleural bristle number and abdominal bristle number were extracted from
Paxman (1957) and Lopez and Lopez-Fanjul (1993), respec-tively. Paxman (1957) propagated six lines offlies to accu-mulate mutations for 40 generations and measured the average number of sternopleural bristles in each line at 5 time points. The distribution of trait changes in the mean sternopleural bristle number of each line between each mea-surement is depicted in Figure 2A. Lopez and Lopez-Fanjul (1993) maintained 93 MA lines for 61 generations and mea-sured the change in the number of abdominal bristles in each line at the end of the experiment. The distribution of trait changes is depicted in Figure 2B.
The per-generation rate of mutation affecting sensory bristle number inDrosophilais estimated to be 0.03 (Mackay and Lyman 2005).
Estimating the distribution of mutational effects
To estimate the mean and standard deviation of the distribution of mutation effectsmands, we calculated their maximum-likelihood values for each type of bristle. For each bristle trait, we evaluated Equation 9, letting u = 0.03 (Mackay and Lyman 2005). We let xi and gi be the trait
changes and numbers of generations between measure-ments for all measuremeasure-ments in all lines. Implementing a sim-ple hill-climbing algorithm in MATLAB, we calculated the joint maximum-likelihood estimates for m and s(see sup-porting information, File S1). We estimated the standard deviations of our estimates by finding the values ofm and
s whose log likelihood was equal to the maximum log likelihood minus one (Hudson 1971).
Estimating selection
For each of the four QTL data sets, we calculated the likelihood of a range of values of cusing an effective pop-ulations sizeN= 50 (Gurganus et al.1999) and the maxi-mum-likelihood estimates of m and s for the appropriate bristle trait. For each value ofc andHi, we generated 6.5·
104Monte Carlo samples from the distribution of
substitu-tion effects in MATLAB and calculated the likelihood accord-ing to Equation 12 (see File S2). To calculate the significance of the likelihood-ratio test, we computed the test statistic
D¼ 22 log
lðc¼0Þ
lðc¼^cÞ
(13)
Dis approximatelyx2-distributed with 1 d.f. (Hudson 1971).
It follows that the 95% confidence interval includes values ofcwith likelihoods within 2 log units of the maximum.
False-positive rate
To estimate the false-positive rate of the test, we simulated QTL data under a neutral model of evolution. For each of the four data sets, we found the maximum-likelihood value of H for c = 0. For the ith observed locus, we generated a neutral locus by summing Hieffects drawn from the
Although it entailed extensive computation, we generated 100 sets of simulated neutral QTL for each data set. We applied the likelihood-ratio test for selection to these simu-lated data and recorded the proportion of neutral data sets for which the neutral hypothesis was rejected.
Undetected QTL
A well-documented bias in QTL studies is the failure to detect small-effect loci (Beavis 1998; Bost et al. 2001; Xu 2003). To assess whether undetected QTL might have infl u-enced our estimate, we applied the analytical approach of Otto and Jones (2000) to estimate the number and average effect of undetected loci in each data set. We then reran our analysis including in each data set the estimated number of additional QTL, with their effect sizes following an exponen-tial distribution with the estimated mean.
Sensitivity to the mutation effect distribution
To assess the sensitivity of our test to the estimates of the mutation-effect distribution parameters, we perturbedm by 1 SD in each direction and applied the test. We then simi-larly perturbedsand compared the resulting estimates and confidence intervals to our primary results.
Power
To estimate the power of the test with a diverse set of putatively realistic QTL distributions, we applied the test to all subsets of the QTL from each of the four populations, using the appropriate mutation-effect distribution parame-ters in each case. We examined how the proportion of times the test rejected neutrality varied with the number of loci included in the subset.
Results
The distribution of mutation effects
We estimated the maximum-likelihood mean and standard deviation of the Gaussian distribution of mutational effects (Equation 9) on the basis of the MA data of each type of sensory bristle. For sternopleural sensory bristles (Paxman 1957), the maximum-likelihood estimate (MLE) of m was 20.08 6 0.06 (61 SD) and the MLE of s was 0.23 6
0.05. For abdominal bristles (Lopez and Lopez-Fanjul 1993), our estimate of m was20.25 6 0.04 and our esti-mate ofswas 0.3460.05. We calculated the MLEĉfor the four QTL data sets, in each case applying the corresponding mutation-effect distribution.
Selection in the HST population
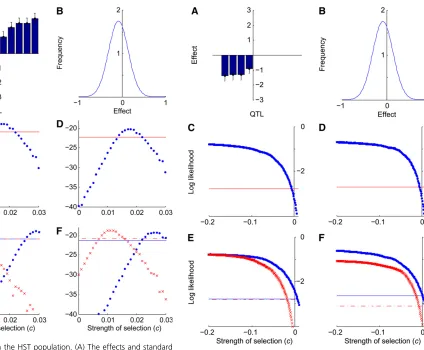
Based on the nine QTL detected in the HST population (Figure 3A) and the mutation-effect distribution estimated for sternopleural bristle number (Figure 3B), the likelihood-ratio test (x2= 38.1,P,0.001) rejects a neutral hypothesis
for an increase in sternopleural bristle number. The MLE for
c,ĉ, was 0.018, with a 95% confidence interval (CI) ranging from 0.013 to 0.022 (Figure 3C). None of the corresponding one hundred simulated neutral data sets based on the HST data yielded a false positive.
Applying Otto and Jones (2000) to assess whether un-detected QTL might have influenced our HST result yielded an estimate that four loci were not detected and that these loci had an average effect of 0.388. Including four simulated QTL following an exponential distribution with mean 0.388, the MLEĉremained 0.018 and the CI ranged from 0.013 to 0.022 (Figure 3D), the same result as in our main analysis. To assess the sensitivity of our test to the estimates of the mutation-effect distribution parameters, we perturbedm by 1 SD in each direction and applied the test. Form=20.144, ĉ= 0.027 with a CI ranging from 0.021 to 0.031, while for
m = 20.022, ĉ = 0.012 with a CI ranging from 0.007 to 0.016 (Figure 3E). Similarly perturbings, we found that for
s = 0.183, ĉ = 0.029, with a CI ranging from 0.025 to 0.034, and for s = 0.288, ĉ = 0.005, with a CI from 0.001 to 0.01 (Figure 3F). Because confidence intervals for ĉ did not include zero, rejection of the hypothesis of neu-trality underlying the evolution of the HST QTL data are robust to moderate perturbations inm ands.
Selection in the LST population
On the basis of the four QTL detected in the LST population (Figure 4A) and the mutation-effect distribution estimated for sternopleural bristle number (Figure 4B), a likelihood-ratio test (x2= 4.88,P= 0.027) rejects a neutral hypothesis
the log-likelihood curve does not have a maximum, but in-stead increases asymptotically as ĉ decreases (Figure 4C). Conservatively using the largest sampled likelihood as the maximum likelihood and applying the likelihood-ratio test, we found thatĉ, 20.005 with 95% confidence. None of the 100 simulated neutral data sets based on the LST data yielded a false positive.
We estimated that four loci were not detected and that these loci had an average effect of 20.284. When we in-cluded these simulated QTL in the data, we again found ĉ , 20.005 (Figure 4D). Perturbingm, we found that for
m =20.144,ĉ,0.007, and form=20.022,ĉ, 20.017 (Figure 4E). Perturbings, we found that fors= 0.183,ĉ, 0.001, and fors= 0.288,ĉ, 20.007 (Figure 4F). Because confidence intervals for ĉ included zero, rejection of the
hypothesis of neutrality underlying the evolution of the LST QTL data were not robust to moderate perturbations inmands.
Selection in the HAB population
On the basis of the three QTL detected in the HAB population (Figure 5A) and the mutation-effect distribution estimated for abdominal bristle number (Figure 5B), a likeli-hood-ratio test (x2 = 34.7, P,0.001) rejects the neutral
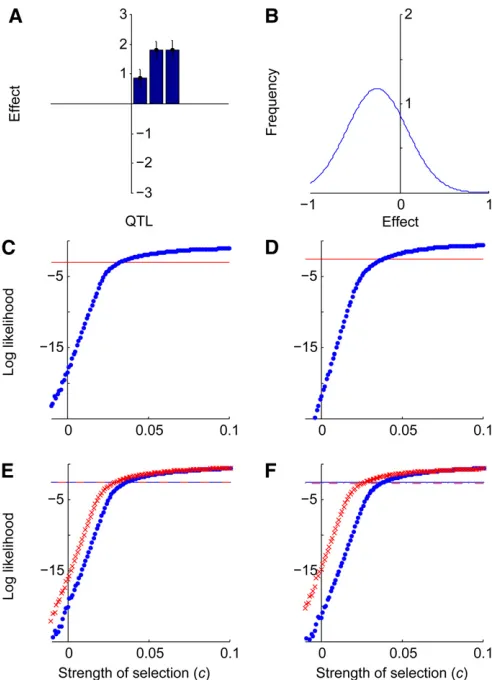
hypothesis for an increase in the number of abdominal bris-tles. As in the LST population, the log-likelihood curve does not have a maximum, instead increasing asymptotically asĉ increases (Figure 5C). Conservatively using the largest ob-served likelihood as the maximum likelihood and applying the likelihood ratio test, we found thatĉ.0.031 with 95% Figure 3 Selection in the HST population. (A) The effects and standard
errors of sternopleural bristle QTL detected in the HST population selected for high sternopleural bristle number. (B) The maximum-likelihood esti-mate of the distribution of mutational effects for sternopleural bristles. (C) Log likelihoodvs. c, the strength of selection, given the HST QTL data and the maximum-likelihood distribution of mutational effects. The horizontal line indicates the likelihood threshold for a 95% confidence interval. (D) Log likelihood vs. c, given the HST QTL data plus four imputed unob-served loci. (E) Log likelihoodvs. c, given the HST QTL data, with the estimate ofmperturbed by adding 1 SD (crosses, dashed threshold line) and subtracting 1 SD (circles, solid threshold line). (F) Log likelihoodvs. c given the HST QTL data, with the estimate ofsperturbed by adding 1 SD (crosses, dashed threshold line) and by subtracting 1 SD (circles, solid threshold line).
Figure 4 Selection in the LST population. (A) The effects and standard errors of sternopleural bristle QTL detected in the LST population, selected for low sternopleural bristle number. (B) The maximum-ikelihood estimate of the distribution of mutational effects for sternopleural bristles. (C) Log likelihoodvs. c, the strength of selection, given the LST QTL data and the maximum-likelihood distribution of mutational effects. The horizontal line indicates the likelihood threshold for a 95% confidence interval. (D) Log likelihoodvs. c, given the LST QTL data plus four imputed unobserved loci. (E) Log likelihoodvs. c, given the LST QTL data, with the estimate ofm
confidence. Only 1 of the 100 simulated neutral data sets based on the HAB data yielded a false positive.
We estimated that five loci were not detected and that these loci had an average effect of 0.245. When we included these simulated QTL in the data, we found thatĉ .0.037 (Figure 5D). Perturbingm, we found that form =20.294, ĉ .0.037, and for m = 20.215, ĉ . 0.026 (Figure 5E). Perturbing s, we found that fors= 0.30, ĉ .0.034, and for s= 0.392,ĉ .0.029 (Figure 5F). Because confidence intervals forĉdid not include zero, rejection of the hypoth-esis of neutrality underlying the evolution of the HAB QTL data are robust to moderate perturbations ofmands.
Selection in the LAB population
On the basis of the three QTL detected in the LAB population (Figure 6A), and the mutation-effect distribution estimated for abdominal bristle number (Figure 6B), a likeli-hood-ratio test (x2 = 4.00, P = 0.046) rejects a neutral
hypothesis for a decrease in abdominal bristle number (Fig-ure 6C). Conservatively using the largest observed likeli-hood as the maximum likelilikeli-hood and applying the likelihood-ratio test, we found that ĉ ,0 with 95% confi -dence. Only 1 of the 100 simulated neutral data sets based on the LAB data yielded a false positive.
We estimated that 13 loci were not detected and that these loci had an average effect of 20.240. When we in-cluded these simulated QTL in the data, ĉ was 0 with a 95% CI ranging from 20.032 to 0.015 (Figure 6D). Per-turbingm, we found that form=20.294,ĉ,0.006, and for
m = 20.215, ĉ , 20.004 (Figure 6E). Perturbing s, we found that for s= 0.30,ĉ,0.003, and fors= 0.39,ĉ, 20.001 (Figure 6F). Because confidence intervals forĉ in-cluded zero, rejection of the hypothesis of neutrality under-lying the evolution of the LAB QTL data are not robust to perturbations inmands.
Power
We examined the power of subsets of the observed QTL to yield a positive result. The proportion of cases in which neutrality could be rejected increased monotonically with the number of QTL in the subset (Figure 7). For single QTL and the observed mutation-effect distribution, the test rejected neutrality in only 43% of cases, while for data sets with six or more of these loci, the test always rejected neutrality.
Discussion
We have derived a new method for detecting the level of historical selection on quantitative traits. First, we showed how to estimate the parameters of a Gaussian distribution of mutational effects from the change in the trait over the course of a mutation-accumulation experiment. Then, we derived the distribution of the effect sizes of mutations that fix as a function of the regime of selection or neutrality applied to the trait. We demonstrated how to integrate these
two results to yield a maximum-likelihood estimate of the strength of historical selection given a set of observed QTL effect sizes and the results of a mutation-accumulation experiment. Finally, we applied the test to a well-studied quantitative trait, detecting a history of artificial selection on four cases of sensory bristle numbers inD. melanogaster.
The test we have derived is thefirst test for selection on phenotype that incorporates information about a trait’s ge-netic architecture as well as the phenotypic change induced by mutation. It is also the first test to include an explicit model of how neutrality and selection shape the loci that affect a trait. Finally, our test is the first that will allow biologists not only to distinguish between neutrally evolving traits and selected traits but also to estimate the range of Figure 5 Selection in the HAB population. (A) The effects and standard errors of abdominal bristle QTL detected in the HAB population (selected for high abdominal bristle number. (B) The maximum-likelihood estimate of distribution of mutational effects for abdominal bristles. (C) Log likeli-hoodvs. c, the strength of selection, given the HAB QTL data and the maximum-likelihood distribution of mutational effects. The horizontal line indicates the likelihood threshold for a 95% confidence interval. (D) Log likelihoodvs. c, given the HAB QTL data plusfive imputed unobserved loci. (E) Log likelihoodvs. cgiven the HAB QTL data, with the estimate of
strengths of selection that are most likely to have produced the current phenotypic value. As such, it represents a theo-retical and practical improvement on existing methods to detect selection on quantitative traits.
Application of the test to sensory bristle number in D. melanogaster demonstrated its ability to detect a history of selection. Likelihood-ratio tests demonstrated sufficient power to reject neutrality in four out of four populations that had been subject to artificial selection. For the HST data, we were able to identify a MLE for a coefficient de-termining the strength of selection, as well as to describe its 95% CI. For the other three data sets, we were able to estimate upper or lower bounds for the strength of selection. Because the HST data contained the largest number of QTL
(9), this difference in precision is expected. The HST data set was also the only one that contained some QTL with effects opposite to the actual and inferred direction of selec-tion. Similarly, by applying the test to subsets of the data, we demonstrated that the test’s power increased with an in-creased number of QTL. We also assessed the false-positive rate by applying the test to 100 simulated neutral data sets based on each set of real QTL. In no case did more than 1 of the 100 simulated data sets yield a false positive.
We assessed the sensitivity of our test to the estimates of the mutation-effect distribution parameters by perturbingm andsby 1 SD in each direction and reapplying the test. For the HST and HAB data, rejection of neutrality was robust to these perturbations. However, for the LST data and the LAB data, the result was no longer significant in the case of a more negative mand in the case of a smallers. This loss of significance speaks to a perhaps unsurprisingly higher sensitivity of the test in cases in which selection and muta-tion are acting in opposite direcmuta-tions (as they are in HST and HAB) than in cases in which selection and mutation are acting in the same direction. Our low false-positive rate across both cases in which selection and mutation are acting in concert or in conflict indicates that this difference in sen-sitivity is in accord with the actual inferential difficulty and not a problem of a biased test construction.
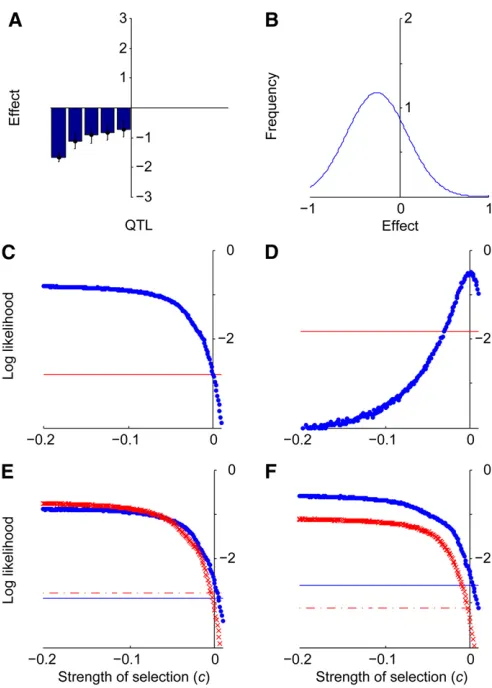
A well-documented bias in QTL studies is the tendency to fail to detect small-effect loci (Beavis 1998; Bostet al.2001; Xu 2003). To assess whether undetected QTL might have influenced our estimates, we applied the analytical approach of Otto and Jones (2000) to estimate the number and effect of undetected QTL and included simulated loci following these parameters in our analysis. For the three data sets in which the test rejected neutrality, this modification did not change the significance of the result and had little effect on the estimates of c. However, when we included the simu-lated loci in the LAB data set, where we had already bor-dered on insufficient power to detect the action of selection, the MLE forcwas shifted to 0. For this data set in particular, Figure 6 Selection in the LAB population. (A) The effects and standard
errors of abdominal bristle QTL detected in the LAB population. (B) The maximum-likelihood estimate of distribution of mutational effects for abdominal bristles. (C) Log likelihoodvs. c, the strength of selection, given the LAB QTL data and the maximum-likelihood distribution of mutational effects. The horizontal line indicates the likelihood threshold for a 95% confidence interval. (D) Log likelihoodvs. c, given the LAB QTL data plus 13 imputed unobserved loci. (E) Log likelihoodvs. cgiven the LAB QTL data, with the estimate ofmperturbed by adding 1 SD (crosses, dashed threshold line) and subtracting 1 SD (circles, solid threshold line). (F) Log likelihoodvs. cgiven the LAB QTL data, with the estimate ofsperturbed by adding 1 SD (crosses, dashed threshold line) and subtracting 1 SD (circles, solid threshold line).
the analysis indicated that there were many more unde-tected loci (13) than observed QTL (5). Furthermore, the simulated loci had a mean of20.240, almost identical to the estimate of m for abdominal bristles, making them effec-tively neutral for the purposes of our test. Therefore, appli-cation of Otto and Jones (2000) imputation can have a considerable impact when the expected number of unob-served loci is much larger than the number of detected QTL. Wider application of this test awaits the availability of more MA and QTL data. Unfortunately, there are few traits for which both MA and QTL analysis have been performed. Practical and ethical considerations limit the range of species for which mutation-accumulation experiments may be performed. On the other hand, numerous examples of applications of Orr’s 1998 test to empirical data (Rieseberg
et al. 2002; Albertson et al. 2003; Lexer et al. 2005; Orr 2010) demonstrate that tests for selection on phenotypic traits are in demand. Although both types of experiments can be labor intensive and time consuming, there are many cases in which either MA or QTL data are already available, and only the corresponding partner experiment need be completed to apply this test for historical selection.
Several expansions of our model would improve its scope and precision. First, the model presented here implicitly rather than explicitly incorporates time. Because the gener-ation and fixation of mutations take time, the amount of time a trait has had to evolve is an important factor in how many substitutions are responsible for each QTL effect. Explicitly incorporating time into the model should provide more information for determining in which vectorHis most likely. Since H affects the likelihood of c, this additional discriminatory power would yield more precise estimates of the strength of selection. However, explicit rather than implicit incorporation of time in our framework is complex. Our test assumes that the probability offixation of a new mutation follows Equation 5, which has been derived from various models of evolution (Kimura 1962; Moran 1960; Gillespie 1974), and is a fairly general result, accommodat-ing a variety of evolutionary scenarios for which the effec-tive population size captures all relevant complications. Examples include cyclically varying population size (Otto and Whitlock 1997), population subdivision with symmetric migration (Pollack 1966), and deleterious mutations at com-pletely linked loci (Charlesworth 1994). Probability offi xa-tion results that could be used in place of Equaxa-tion 5 under more diverse evolutionary scenarios are reviewed by Patwa and Wahl (2008).
Because we model the sequential mutation and fixation of alleles at different loci, our test applies to QTL identified by crossing related populations and estimates the selective regime responsible for the trait difference between the populations. The method is not applicable, as currently implemented, to QTL identified by crossing individuals from the same population. However, since selection should shape the standing variation within a population, a related test that applies to QTL variation in a single population is
conceivable. Accordingly, one potential weakness of the test is that our model assumes that QTL between the divergent populations are constructed from novel mutations, without allowing some proportion of fixed differences to arise from standing variation in the ancestral population. QTL arising from standing variationfix faster and are likely to be of smaller effect size than QTL arising from novel mutations (Barrett and Schluter 2008). Consequently, our model assumption that all variation arises as new mutation is conservative for the purpose of our test: within our framework, smaller QTL effect sizes will be more consistent with neutrality.
Finally, distributions of mutational effect other than the Gaussian distribution used here should be explored. Imple-menting the model with other distributions would allow assessment of its sensitivity to this assumption and provide flexibility to its use as new information comes to light about the distributions of mutational effects found in nature. The central challenge in this endeavor is that other distributions lack the convenient property of the normal distribution that the sum of normally distributed random variables is also normally distributed. As currently implemented, our ap-proach relies on this fact for tractability (Equation 2).
As a theoretical result, this test for selection on quanti-tative traits is important because it bridges population genetic theory and genetic architecture as revealed by QTL. Furthermore, the test for selection outlined here provides an improvement over currently available methods for determining the regime of historical selection or neu-trality that generated observed quantitative differences in phenotype. Results of the test applied to four data sets known to be the result of artificial selection for sensory bristle number in D. melanogaster are highly encouraging, because they indicate that the test has sufficient power to be used on moderately sized QTL data sets and also that the false-positive rate is very low. Applying the test to QTL data generated by crossing two individuals representative of di-verged wild populations will yield conclusions about the history of selection responsible for the observed trait differ-ences. Finally, our model provides a novel framework that holds promise for expansion in future work to incorporate such factors as time, varying probabilities of fixation, and diverse shapes of the distribution of mutational effects.
Acknowledgments
Literature Cited
Albertson, R., J. Streelman, and T. Kocher, 2003 Genetic basis of
adaptive shape differences in the cichlid head. J. Hered. 94:
291–301.
Anderson, E., and M. Slatkin, 2003 Orr’s quantitative trait loci
sign test under conditions of trait ascertainment. Genetics
165: 445–446.
Ashton, K., A. Wagoner, R. Carrillo, and G. Gibson,
2001 Quantitative trait loci for the monoamine-related traits
heart rate and headless behavior in Drosophila melanogaster.
Genetics 157: 283–294.
Atwood, K. C., L. K. Schneider, and F. J. Ryan, 1951 Periodic
selection in Escherichia coli. Proc. Natl. Acad. Sci. USA 37:
146–155.
Barrett, R. D. H., and D. Schluter, 2008 Adaptation from standing
genetic variation. Trends Ecol. Evol. 23: 38–44.
Barton, N., and H. De Vladar, 2009 Statistical mechanics and the
evolution of polygenic quantitative traits. Genetics 181: 997–1011.
Barton, N., and P. Keightley, 2002 Understanding quantitative
genetic variation. Nat. Rev. Genet. 3: 11–21.
Beavis, W. D., 1998 QTL analyses: power, precision and accuracy,
pp. 145–162 inMolecular Dissection of Complex Traits, edited by
A. H. Paterson. CRC Press, Boca Raton, FL.
Boake, C., S. Arnold, F. Breden, L. Meffert, M. Ritchie et al.,
2002 Genetic tools for studying adaptation and the evolution
of behavior. Am. Nat. 160: S143–S159.
Bost, B., D. de Vienne, F. Hospital, L. Moreau, and C. Dillmann,
2001 Genetic and nongenetic bases for the L-shaped
distribu-tion of quantitative trait loci effects. Genetics 157: 1773–1787.
Brem, R. B., and L. Kruglyak, 2005 The landscape of genetic
com-plexity across 5,700 gene expression traits in yeast. Proc. Natl.
Acad. Sci. USA 102: 1572–1577.
Charlesworth, B., 1994 The effect of background selection against
deleterious mutations on weakly selected, linked variants.
Genet. Res. 63: 213–227.
Chevin, L.-M., and F. Hospital, 2008 Selective sweep at a
quanti-tative trait locus in the presence of background genetic
varia-tion. Genetics 180: 1645–1660.
Depaulis, F., S. Mousset, and M. Veuille, 2003 Power of neutrality
tests to detect bottlenecks and hitchhiking. J. Mol. Evol. 57
(Suppl. 1): S190–S200.
Dilda, C., 2002 The genetic architecture of Drosophila sensory
bristle number. Ph.D. dissertation, North Carolina State
Univer-sity, Raleigh, NC. Available from http://www.proquest.com,
publication number AAT 3346505, accessed November 22, 2011.
Dilda, C., and T. Mackay, 2002 The genetic architecture of
Dro-sophila sensory bristle number. Genetics 162: 1655–1674.
Erickson, D., C. Fenster, H. Stenoien, and D. Price,
2004 Quantitative trait locus analyses and the study of
evolu-tionary process. Mol. Ecol. 13: 2505–2522.
Garciadorado, A., 1997 The rate and effects distribution of viable
mutation in Drosophila: minimum distance estimation.
Evolu-tion 51: 1130–1139.
Gillespie, J. H., 1974 Natural selection for within-generation
var-iance in offspring number. Genetics 76: 601–606.
Gleason, J., S. Nuzhdin, and M. Ritchie, 2002 Quantitative trait
loci affecting a courtship signal inDrosophila melanogaster.
He-redity 89: 1–6.
Gleason, J., R. James, C. Wicker-Thomas, and M. Ritchie,
2009 Identification of quantitative trait loci function through
analysis of multiple cuticular hydrocarbons differing between
Drosophila simulansandDrosophila sechelliafemales. Heredity
103: 416–424.
Grant, P., and B. Grant, 2002 Unpredictable evolution in a
30-year study of Darwin’sfinches. Science 296: 707–711.
Gurganus, M. C., S. V. Nuzhdin, J. W. Leips, and T. F. C. Mackay,
1999 High-resolution mapping of quantitative trait loci for
sternopleural bristle number inDrosophila melanogaster.
Genet-ics 152: 1585–1604.
Halligan, D. L., and P. D. Keightley, 2009 Spontaneous mutation
accumulation studies in evolutionary genetics. Annu. Rev. Ecol.
Evol. Syst. 40: 151–172.
Hudson, D. J., 1971 Interval Estimation from the likelihood
func-tion. J. R. Statist. Soc. B Methodol. 33: 256–262.
Jones, A., S. Arnold, and R. Burger, 2007 The mutation matrix
and the evolution of evolvability. Evolution 61: 727–745.
Kearsey, M. J., and B. W. Barnes, 1970 Variation for metrical
characters in Drosophilapopulations. 2. Natural selection.
He-redity 25: 11.
Keightley, P. D., 1994 The distribution of mutation effects on
vi-ability inDrosophila melanogaster. Genetics 138: 1315–1322.
Keightley, P., and M. Lynch, 2003 Toward a realistic model of
mutations affectingfitness. Evolution 57: 683–685.
Kimura, M., 1962 On probability offixation of mutant genes in
a population. Genetics 47: 713.
Kimura, M., 1983 The Neutral Theory of Molecular Evolution.
Cam-bridge University Press, New York.
Lai, C., R. Lyman, A. Long, C. Langley, and T. Mackay,
1994 Naturally-occuring variation in bristle number and
DNA polymorphisms at thescabrous locus ofDrosophila
mela-nogaster. Science 266: 1697–1702.
Lai, C., J. Leips, W. Zou, J. Roberts, K. Wollenberg et al.,
2007 Speed-mapping quantitative trait loci using microarrays.
Nat. Methods 4: 839–841.
Lande, R., 1983 The response to selection on major and minor
mutations affecting a metrical trait. Heredity 50: 47–65.
Lexer, C., D. Rosenthal, O. Raymond, L. Donovan, and L. Rieseberg,
2005 Genetics of species differences in the wild annual
sun-flowers, Helianthus annuus and H. petiolaris. Genetics 169:
2225–2239.
Long, A., S. Mullaney, L. Reid, J. Fry, C. Langleyet al., 1995
High-resolution mapping of genetic factors affecting abdominal
bris-tle number inDrosophila melanogster. Genetics 139: 1273–1291.
Long, A., S. Mullaney, T. Mackay, and C. Langley, 1996 Genetic
interactions between naturally occurring alleles at quantitative trait loci and mutant alleles at candidate loci affecting bristle
number inDrosophila melanogaster. Genetics 144: 1497–1510.
Lopez, M., and C. Lopezfanjul, 1993 Spontaneous mutation for
a quantitative trait inDrosophila melanogaster. 2. Distribution of
mutant effects on the trait and fitness. Genet. Res. 132: 117–
126.
MacDonald, S., T. Pastinen, and A. Long, 2005 The effect of
poly-morphisms in the Enhancer of split gene complex on bristle
number variation in a large wild-caught cohort of Drosophila
melanogaster. Genetics 171: 1741–1756.
Mackay, T., 2001 Quantitative trait loci in Drosophila. Nat. Rev.
Genet. 2: 11–20.
Mackay, T., and R Lyman, 2005 Drosophila bristles and the nature
of quantitative genetic variation. Philos. Trans. R. Soc. B Biol.
Sci. 360: 1513–1527.
Mackay, T. F. C., J. D. Fry, R. F. Lyman, and S. V. Nuzhdin,
1994 Polygenic mutations in Drosophila melanogaster:
esti-mates from response to selection of inbred strains. Genetics
136: 937–951.
Martin, G., and T. Lenormand, 2006 Thefitness effects of
muta-tions across environments: a survey in light offitness landscape
models. Evolution 60: 2413–2427.
Mather, K., 1941 Variation and selection of polygenic characters.
J. Genet. London 41: 159–193.
McDonald, J., and M. Kreitman, 1991 Adaptive protein evolution
Moran, P. A. P., 1960 The survival of a mutant gene under
selec-tion II. J. Aust. Math. Soc. 1: 485–491.
Mousset, S., N. Derome, and M. Veuille, 2004 A test of neutrality
and constant population size based on the mismatch
distribu-tion. Mol. Biol. Evol. 21: 724–731.
Nurminsky, D., F. Depaulis, S. Mousset, and M. Veuille,
2005 Detecting Selective Sweeps with Haplotype Tests: Selective
Sweep. Springer, New York.
Orr, H., 1998a Testing natural selectionvs.genetic drift in
phe-notypic evolution using quantitative trait locus data. Genetics
149: 2099–2104.
Orr, H. A., 1998b The population genetics of adaptation: the
dis-tribution of factorsfixed during adaptive evolution. Evolution
52: 935–949.
Orr, H. A., 2010 The population genetics of beneficial mutations.
Philos. Trans. R. Soc. B. Biol. Sci. 365: 1195–1201.
Otto, S. P., and C. D. Jones, 2000 Detecting the undetected:
es-timating the total number of loci underlying a quantitative trait.
Genetics 156: 2093–2107.
Otto, S. P., and M. C. Whitlock, 1997 The probability offixation in
populations of changing size. Genetics 146: 723–733.
Palsson, A., and G. Gibson, 2004 Association between nudeotide
variation in Egfr and wing shape in Drosophila melanogaster.
Genetics 167: 1187–1198.
Palsson, A., J. Dodgson, I. Dworkin, and G. Gibson, 2005 Tests
for the replication of an association between Egfr and natural variation in Drosophila melanogaster wing morphology. BMC Genet. 6: 44.
Patwa, Z., and L. M. Wahl, 2008 Thefixation probability of
ben-eficial mutations. J. R. Soc. Interface 5: 1279–1289.
Paxman, G. J., 1957 A study of spontaneous mutation in
Drosoph-ila Melanogaster. Genetica 29: 39–57.
Pollak, E., 1966 On the survival of a gene in a subdivided
pop-ulation. J. Appl. Probab. 3: 142–195.
Rieseberg, L., A. Widmer, A. Arntz, and J. Burke, 2002. Directional
selection is the primary cause of phenotypic diversification.
Proc. Natl. Acad. Sci. USA 99: 12242–12245.
Robertson, A., 1955 Selection in animals: synthesis. Cold Spring
Harb. Symp. Quant. Biol. 20: 225–229.
Robertson, A., 1967 The nature of quantitative genetic variation
Drosophila melanogaster. Proceedings of the Mendel Centennial
Symposium of the Genetics Society of Heritage from Mendel,
September 7–11, 1965, Fort Collins, CO, pp. 265–280.
Robin, C., R. Lyman, A. Long, C. Langley, and T. Mackay,
2002 hairy: a quantitative trait locus for Drosophila sensory
bristle number. Genetics 162: 155–164.
Sawyer, S., R. Kulathinal, C. Bustamante, and D. Hartl,
2003 Bayesian analysis suggests that most amino acid
replace-ments in Drosophila are driven by positive selection. J. Mol.
Evol. 57 (Suppl. 1): S154–S164.
Schlenke, T., and D. Begun, 2003 Natural selection drives
dro-sophila immune system evolution. Genetics 164: 1471–1480.
Schlenke, T., and D. Begun, 2004 Strong selective sweep
associ-ated with a transposon insertion in Drosophila simulans. Proc.
Natl. Acad. Sci. USA 101: 1626–1631.
Schlenke, T., and D. Begun, 2005 Linkage disequilibrium and
re-cent selection at three immunity receptor loci inDrosophila
sim-ulans. Genetics 169: 2013–2022.
Shaw, F. H., C. J. Geyer, and R. G. Shaw, 2002 A comprehensive
model of mutations affecting fitness and inferences for
Arabi-dopsis thaliana. Evolution 56: 453–463.
Studer, A., and J. F. Doebley, 2011 Do large effect QTL
fraction-ate?: a case study at the maize domestication QTL teosinte
branched1. Genetics 188: 673–681.
Turelli, M., 1984 Heritable genetic variation via mutation-selection
balance: Lerch’s zeta meets the abdominal bristle. Theor. Popul.
Biol. 25: 138–193.
Verhoeven, K., T. Vanhala, A. Biere, E. Nevo, and J. Van Damme,
2004 The genetic basis of adaptive population differentiation:
a quantitative trait locus analysis of fitness traits in two wild
barley populations from contrasting habitats. Evolution 58(2):
270–283.
Weinig, C., L. Dorn, N. Kane, Z. German, S. Hahdorsdottir et al.,
2003 Heterogeneous selection at specific loci in natural
envi-ronments inArabidopsis thaliana. Genetics 165: 321–329.
Xu, S., 2003 Theoretical basis of the Beavis effect. Genetics 165:
2259–2268.
Zimmerman, E., A. Palsson, and G. Gibson, 2000 Quantitative
trait loci affecting components of wing shape inDrosophila
mel-anogaster. Genetics 155: 671–683.
GENETICS
Supporting Information
http://www.genetics.org/content/suppl/2012/01/31/genetics.111.137075.DC1
A Test for Selection Employing Quantitative Trait
Locus and Mutation Accumulation Data
Daniel P. Rice and Jeffrey P. TownsendSupporting Files
File S1: Matlab Code 1 (Estimating mu and sigma) File S2: Matlab Code 2 (Calculating likelihood)
Files S1 and S2 are available for download at
http://www.genetics.org/content/suppl/2012/01/31/genetics.111.137075.DC1.