University of Windsor
University of Windsor
Scholarship at UWindsor
Scholarship at UWindsor
Electronic Theses and Dissertations
Theses, Dissertations, and Major Papers
2009
Performance analysis of multimodal biometric systems – An
Performance analysis of multimodal biometric systems – An
automated statistical approach
automated statistical approach
Gaurav Kumar
University of Windsor
Follow this and additional works at:
https://scholar.uwindsor.ca/etd
Recommended Citation
Recommended Citation
Kumar, Gaurav, "Performance analysis of multimodal biometric systems – An automated statistical
approach" (2009). Electronic Theses and Dissertations. 8046.
https://scholar.uwindsor.ca/etd/8046
This online database contains the full-text of PhD dissertations and Masters’ theses of University of Windsor students from 1954 forward. These documents are made available for personal study and research purposes only, in accordance with the Canadian Copyright Act and the Creative Commons license—CC BY-NC-ND (Attribution, Non-Commercial, No Derivative Works). Under this license, works must always be attributed to the copyright holder (original author), cannot be used for any commercial purposes, and may not be altered. Any other use would require the permission of the copyright holder. Students may inquire about withdrawing their dissertation and/or thesis from this database. For additional inquiries, please contact the repository administrator via email
Performance Analysis of Multimodal Biometric Systems
-An Automated Statistical Approach
by
Gaurav Kumar
A Thesis
Submitted to the Faculty of Graduate Studies
through School of Computer Science
in Partial Fulfillment of the Requirements for
the Degree of Master of Science at the
University of Windsor
Windsor, Ontario, Canada
2009
1*1
Library and Archives
Canada
Published Heritage
Branch
395 Wellington Street
Ottawa ON K1A 0N4
Canada
Bibliotheque et
Archives Canada
Direction du
Patrimoine de I'edition
395, rue Wellington
Ottawa ON K1A 0N4
Canada
Your We Votre reference ISBN: 978-0-494-57560-4 Our file Notre reference ISBN: 978-0-494-57560-4
NOTICE:
AVIS:
The author has granted a
non-exclusive license allowing Library and
Archives Canada to reproduce,
publish, archive, preserve, conserve,
communicate to the public by
telecommunication or on the Internet,
loan, distribute and sell theses
worldwide, for commercial or
non-commercial purposes, in microform,
paper, electronic and/or any other
formats.
L'auteur a accorde une licence non exclusive
permettant a la Bibliotheque et Archives
Canada de reproduire, publier, archiver,
sauvegarder, conserver, transmettre au public
par telecommunication ou par Nnternet, preter,
distribuer et vendre des theses partout dans le
monde, a des fins commerciales ou autres, sur
support microforme, papier, electronique et/ou
autres formats.
The author retains copyright
ownership and moral rights in this
thesis. Neither the thesis nor
substantial extracts from it may be
printed or otherwise reproduced
without the author's permission.
L'auteur conserve la propriete du droit d'auteur
et des droits moraux qui protege cette these. Ni
la these ni des extraits substantiels de celle-ci
ne doivent etre imprimes ou autrement
reproduits sans son autorisation.
In compliance with the Canadian
Privacy Act some supporting forms
may have been removed from this
thesis.
Conformement a la loi canadienne sur la
protection de la vie privee, quelques
formulaires secondaires ont ete enleves de
cette these.
While these forms may be included
in the document page count, their
removal does not represent any loss
of content from the thesis.
Bien que ces formulaires aient inclus dans
la pagination, il n'y aura aucun contenu
manquant.
1+1
Performance Analysis of Multimodal Biometric Systems - An Automated Statistical Approach {
Author's Declaration of Originality
I hereby certify that I am the sole author of this thesis and that no part of this thesis has been published
or submitted for publication.
I certify that, to the best of my knowledge, my thesis does not infringe upon anyone's copyright nor
violate any proprietary rights and that any ideas, techniques, quotations, or any other material from the
work of other people included in my thesis, published or otherwise, are fully acknowledged in
accordance with the standard referencing practices. Furthermore, to the extent that I have included
copyrighted material that surpasses the bounds of fair dealing within the meaning of the Canada
Copyright Act, I certify that I have obtained a written permission from the copyright owner(s) t o include
such material(s) in my thesis and have included copies of such copyright clearances to my appendix.
I declare that this is a true copy of my thesis, including any final revisions, as approved by my thesis
committee and the Graduate Studies office, and that this thesis has not been submitted for a higher
Performance Analysis of Multimodal Biometric Systems - An Automated Statistical Approach |
Abstract
This thesis proposes to study and extend the ability of the statistical methodologies that have been
established to measure the performance of multimodal biometric systems. In particular, it takes into
account the various noise factors that are inevitable in a real world scenario, which influence the
performance of biometric systems. The work completed in the past uses the Design of Experiment
framework to create a systematic approach to test the performance of biometric systems. Input
parameters are varied including the data fusion methods and the normalization schemes (both
controlled), and using discrete intervals based deviations in the matching scores (uncontrolled) of
genuine and impostor users to represent noise. This work however, is limited provided the manual
interface to the developed application. All parameters are fixed and operate over a comparatively small
dataset. Further, the design of the existing application limits the extensibility of the same to incorporate
additional data sources, increase or decrease the deviation values that contribute to the noise, and
generate analytical graphs and reports.
It is the purpose of this thesis to establish a framework that is scalable to accommodate additional
biometric databases for a larger subject pool. The developed application will also allow users to identify
a larger set of deviation values for noise, automatically generate test cases for all possible biometric
modalities defined within the system, etc. It is also the intent to provide, as results, the ability for the
user to choose from a set of possible graphs and reports that are in tune with the common industry
Performance Analysis of Multimodal Biometric Systems - An Automated Statistical Approach j
Dedication
"Knowing is not enough; we must apply!" - Goethe
This Master's thesis paper is dedicated to my parents as well as other members of my family who have
consistently supported me throughout the course of my education and my life. It is through their
guidance and teachings to be persistent and to strive for more knowledge that have enabled me to
complete this thesis.
The thesis is also dedicated to the faculty and staff of the Computer Science department at the
University of Windsor. Without the knowledge imparted by them and their constant support, I would
Performance Analysis of Multimodal Biometric Systems - An Automated Statistical Approach |
Acknowledgements
Performance Analysis of Multimodal Biometric Systems - An Automated Statistical Approach |
Table of Contents
Author's Declaration of Originality iii
Abstract iv
Dedication v
Acknowledgements vi
List of Tables x
List of Figures xi
Glossary of Terms xiii
Chapter 1. Introduction 1
Chapter 2. Overview of Biometric System 3
2.1 Biometric Systems 3
2.1.1 Physiological Features 5
2.1.2 Behavioral Features 6
2.1.3 Biometric System Components 7
2.1.4 Limitations of Unimodal Systems 9
2.2 Multimodal Biometric Systems 10
2.2.1 Necessity of Multimodal Biometric Systems 11
2.2.2 Multimodal Biometric Systems - Schemes 12
2.2.3 Combining Information in Multimodal Biometric Systems - 'Fusion' 13
Chapter 3. Problem Statement 15
3.1 Performance Evaluation of Multimodal Biometric Systems 15
3.1.1 FAR (False Accept Rate) 17
3.1.2 FRR (False Reject Rate) 17
Performance Analysis of Multimodal Biometric Systems - An Automated Statistical Approach |
3.1.4 EER (Equal Error Rate) 19
3.1.5 FTA (Failure to Acquire Rate) 19
3.1.6 FIR (False Identification Rate) 20
3.2 A Statistical Approach 21
3.3 Automated Analysis 23
3.4 Problem Definition 25
Chapter 4. Method of Analysis 27
4.1 Dataset Partitioning Methods 28
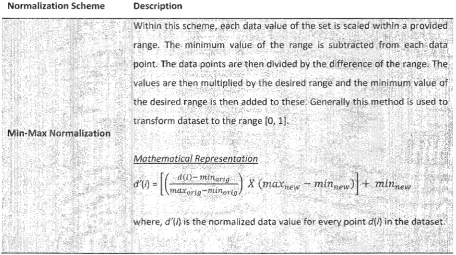
4.2 Normalization Methods 29
4.3 Data Fusion Methods 32
Chapter 5. Method of Approach 40
5.1 System Modules - Architecture 40
5.2 System Algorithm 42
5.3 Implemented Software Application Components 43
5.4 Multimodal biometrics database 44
5.5 Test Data Generator 45
5.6 Test Database 46
5.7 BSSR Processor 50
5.8 Modality Scores 50
5.9 MUBI Analysis Tool 51
5.10 Reporting and Graphing module 51
5.11 System Controller 52
Chapter 6. Sample Experiments & Results 53
Performance Analysis of Multimodal Biometric Systems - An Automated Statistical Approach |
6.1.1 Experiment Results 57
6.2 Experiments Setup - Comparative Analysis 64
6.2.1 Experiment Results 66
Chapter 7. Conclusion 77
7.1 Contributions 77
7.2 Future Work 78
Bibliography 79
Performance Analysis of Multimodal Biometric Systems - An Automated Statistical Approach |
List of Tallies
Table 1: Data set partitioning, data normalization and fusion methods used in previous work 28
Table 2: Summary of Dataset Partitioning Methods 29
Table 3: Summary of common Normalization Schemes 32
Table 4: Summary of Fusion Methods 34
Table 5: Noise rates applied to modality scores in previous work 35
Table 6: NIST BSSR1 Modalities Parameters 45
Table 7: Table BIOMETRIC_MODALITIES structure 47
Table 8: Table MODAUTIES_CONFIGURATION structure 48
Table 9: Table MODALITY_GENUINE_SCORES structure 48
Table 10: Table MODALITY_IMPOSTOR_SCORES structure 48
Table 11: Table TEST_SETUP_MASTER structure 49
Table 12: Table TEST_SETUP_RESULTS structure 50
Table 13: Test setups in (Gan, 2007). The configurations marked have been used for experiments in this
Performance Analysis of Multimodal Biometric Systems - A n Automated Statistical Approach
List of Figures
Figure 1: Common biometric traits (A. K. Jain, 2004) 4
Figure 2: A comparison of various biometric traits for properties (Jain, 2004) (H=High, M=Medium,
L=Low) 7
Figure 3: Diagrams identifying system modules within various application context modes (A. K. Jain,
2004) .' 9
Figure 4: Comparison of multimodal biometrics system and unimodal systems in performance measured
in GAR against FAR 12
Figure 5: Performance of various biometric systems using standard measurable (Biometrics, 2008) 15
Figure 6: (a) Impostor and Genuine scores distributions for threshold t with corresponding FMR and
FNMR. (b) Receiver Operating Characteristics (ROC) curve with varied operating points resulting in
different FMR and FNMR. (A. K. Jain, 2004) 16
Figure 7: ROC curve indicating the Equal Error Rate (EER), where EER = FNMR = FMR 19
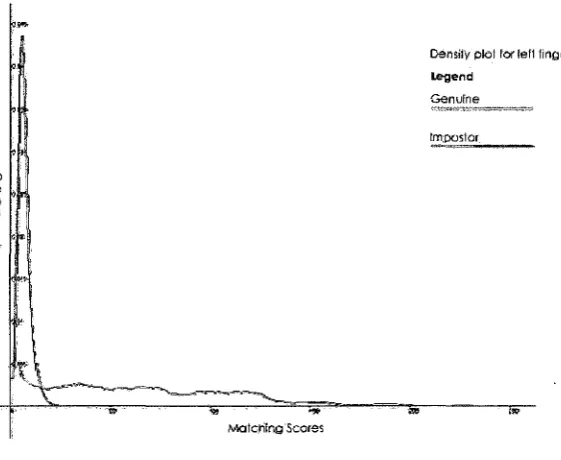
Figure 8: Density plot for left finger modality using original scores 35
Figure 9: Density plot for Face C using original scores 36
Figure 10: Probability density curves for right index finger with original scores and scores with 10%
deviation added 36
Figure 11: ROC curves for combined modalities with simple product fusion 37
Figure 12: Datasheet excerpt from Bioscrypt's V-Station biometric system 39
Figure 13: Automated System Modules 41
Figure 14: Test Database Tables and Relationships 46
Figure 15: BIOMETRIC_MODALITIES table with initial test setup data from NIST BSSR1 biometric
database 53
Figure 16: MODALITY_GENUINE_SCORES table with initial test setup data from NIST BSSR1 biometric
database 54
Figure 17: MODALITY_GENUINE_SCORES table with initial test setup data from NIST BSSR1 biometric
database 55
Figure 18: MODALITIES_CONFIGURATION table as configured for the sample test environment consisting
Performance Analysis of Multimodal Biometric Systems - An Automated Statistical Approach |
Figure 19: TEST_SETUP_MASTER table outlining the configuration for test multimodal biometric systems
with partitioning and fusion schemes 56
Figure 20: ROC curves, without fusion, for multimodal system ID
[7f060644-f3e0-47f8-bf25-18f99844da8f] 58
Figure 21: ROC curves, without fusion, for multimodal system ID
[bad95161-abcd-4859-a02c-Cl2e0a98e374] 59
Figure 22: ROC curves, without fusion, for multimodal system ID
[51ba6a89-9de0-4el3-afa3-c2d593ae0639] 60
Figure 23: ROC curves, with fusion, for multimodal system ID [7f060644-f3e0-47f8-bf25-18f99844da8f]
61
Figure 24: ROC curves, with fusion, for multimodal system ID
[bad95161-abcd-4859-a02c-Cl2e0a98e374] 62
Figure 25: ROC curves, with fusion, for multimodal system ID [51ba6a89-9de0-4el3-afa3-c2d593ae0639]
63
Figure 26: Comparison of test multimodal systems using the GAR value against the FAR value of 0.1%. 64
Figure 27: ROC curve, without fusion, for Test setup 1 67
Figure 28: ROC curve, without fusion, for Test setup 2 68
Figure 29: ROC curve, without fusion, for Test setup 3 69
Figure 30: ROC curve, without fusion, for Test setup 4 70
Figure 31: ROC curve, with fusion, for Test setup 1. Utilizes Simple Sum rule based fusion 71
Figure 32: ROC curve, with fusion, for Test setup 2. Utilizes Simple Product rule based fusion 72
Figure 33: ROC curve, with fusion, for Test setup 3. Utilizes Simple Minimum rule based fusion 73
Figure 34: ROC curve, with fusion, for Test setup 4. Simple Maximum rule based fusion used 74
Figure 35: Comparison of the performance of multimodal systems configured in Test setups 1, 2, 3 and
Performance Analysis of Multimodal Biometric Systems - A n Automated Statistical Approach
Modalities
-
Unimodal-Multimodal •
Matching scores
D o E
-
FAR-
FRR-Glossary of Terms
physiological or psychological biometric traits used in biometric systems to identify individuals. This can also be used to identify any algorithms employed in the identification process.
biometric system utilizing only a single biometric trait or a type of algorithm for purposes of identification.
biometric system utilizing multiple biometric traits or multiple flavors of algorithms to be used for the purposes of identification.
numerical values identifying the similarity in the biometric data retrieved from the individual to be authenticated and the data stored in the biometric database.
Design of Experiments refers to an experimental method used to study factors and their interactions statistically through methodically controlling their values within a system to be studied.
an error measurable in a biometric system identifying the system's rate of accepting an impostor based on the biometric signals provided.
Performance Analysis of Multimodal Biometric Systems - An Automated Statistical Approach |
Chapter 1. Introduction
Authentication for the purpose of securing resources and accurately identifying individuals has evolved
into the field of biometrics. Biometric systems are being deployed within government offices, high
security facilities, major corporations, etc. to deny or allow access to resources. Further, as an
identification tool, biometric systems allow enforcement agencies to identify suspects, for immigration
authorities to authenticate travelers, etc. Within the field of biometrics, this has been made possible by
using human physiological and psychological traits that can be measured through hardware including
sensors and cameras.
Usually, a biometric system utilizes a single trait to identify individuals. Such systems suffer from
performance issues and have paved the way for multimodal biometric systems. Multimodal biometric
systems combine data from various unimodal biometric systems to achieve improved performance in its
authentication abilities. Since the combining of data can occur at various levels and through different
permutations, it is important to understand and evaluate the performance of such systems. A realistic
factor that affects the performance of biometric systems is the influence of noise through various
sources including faulty devices, change in traits, to name a few. This variability further enhances the
need to study the performance of these systems.
Given biometrics is a young field and evaluation of such systems with any systematic approach younger
still, some attempts have been made to analyze performance of multimodal biometric systems
(Biometrics Testing and Statistics, 2006) (P. Jonathon Phillips, 2007). These evaluations, however, are
done under controlled test environment for a particular set of biometric modalities or for specific
applications. In (Gan, 2007), the author has provided a framework to analyze multimodal biometric
systems to measure their performance using the DoE framework, but has had to carry manual
experiments utilizing the MUBI tool (Samoska, 2006), which can be time consuming and cost ineffective.
Much of the performance evaluation is done using existing multimodal biometrics' databases that
include matching scores for unique biometric traits. Evaluations are performed only through
combinations of these modalities limited to the databases. The considered parameters or noise levels
Performance Analysis of Multimodal Biometric Systems - An Automated Statistical Approach |
t o individual modalities. For example, considering a 5% deviation across a multimodal biometric system
as noise representing face modalities and finger modalities may not be a true representative. Noise is
more likely to occur in hardware to detect fingerprints than face images due to its nature. Subjects
directly interact with the fingerprint scanners while face images are taken through cameras without
direct interaction with the subjects.
As evaluation is performed within the scientific community, measurements are usually reported through
numbers. A better evaluation matrix is necessary to enable non-scientific community to analyze
multimodal biometric systems in comparison with each other.
The intent of this thesis paper and the research performed within the premise allows for a study of the
performance evaluation of multimodal biometric systems, especially under the influence of noise.
Various existing applications, that enable users to measure the performance of biometric systems, have
been researched and their functionality enhanced to allow for evaluation of a larger dataset with user
defined modalities. Better reporting matrix have been included that allow users to perform a more
direct comparison of multimodal biometric systems. An automation of existing applications has been
performed to decrease the cost associated with the evaluation process.
The remainder of this paper has been organized into the following sections. Section 2 provides a more
detailed understanding of biometric systems, unimodal and multimodal. It also presents the schemes of
data combination to create multimodal biometric systems. Section 3 discusses the various performance
measures that have been identified to evaluate a multimodal biometric system. In section 4, the
theoretical framework identifying the method of analysis has been presented. Section 5 discusses the
implemented system that supports, in theory, the proposed methodology for evaluation. Section 6
provides test experiment setups, results, and finishes with a discussion of these results. Section 7
Performance Analysis of Multimodal Biometric Systems - An Automated Statistical Approach |
Chapter 2, Overview of Biometric System
In the present world scenario, the need for security ranging from simple applications such as protecting
copyrighted material to sheltering a country has reached a new dimension. The shift from printed media
t o digital information, movement of people due to globalization and increasing crime are just some of
the reasons that have fuelled the need for accurately identifying a person, or validating a person's
identity. The response to such requirements has spawned the use of biometrics, an evolving field of
science and resulting technology that enables identification (and verification of the identity) of
individuals based on physiological and psychological traits. Essentially, biometrics emerged from its
extensive use in the field of law enforcement but is increasingly being employed in other high security
applications, including many civilian applications (A. K. Jain, 2004).
2,1 Biometric Systems
A biometric recognition system encompasses a shift from traditional identification and authorization
mechanisms such as passwords, secret phrases, etc. to the use of features that humans inherently
possess or can develop (J. Ortega-Garcia, 2004). A biometric system uses features in humans that can, to
a degree of certainty, establish a person's identity. Consequently, a biometric system can be likened to a
pattern recognition system. A biometric is an individual biological characteristic that can be a candidate
for identifying a person pending the following requirements (K. Delac, 2004) (A. K. Jain, 2004) (Thieme,
2003):
• Universality: The physiological or psychological trait must be present as a common
characteristic in all human population.
• Distinctiveness: The trait must differ (in the measured value) between people.
• Permanence: The trait (specifically the measured values of the trait) should remain unchanged
over a period of time.
• Collectability: The trait must be measurable quantitatively.
Performance Analysis of Multimodal Biometric Systems - An Automated Statistical Approach
Figure 1: Common biometric traits (A, K, Jain, 2004)
Once the candidate traits for a biometric system have been identified, the system must still consider
other issues in implementation including:
• Performance: This identifies the accuracy and speed of the system in achieving the desired
functionality, the resources required to achieve the accuracy and speed in the identification
process and the operational and environmental factors that affect the accuracy and speed of the
system.
• Acceptability: All biometric systems interface with the human population, who are also the end
users of the system. Therefore, the acceptability of a biometric system determines whether the
biometric characteristics (or the system as a whole) are acceptable to the general public, and to
what extent.
• Circumvention: This measures the ease of being able to bypass the system using fraudulent
methods.
The author in (J. Ortega-Garcia, 2004) has identified and classified some of the commonly used
Performance Analysis of Multimodal Biometric Systems - An Automated Statistical Approach j
in the paper distinguishes features as physiological or behavioral. Discussed below are the biometric
features reported, but not limited to.
2,1,1 Physiological Features
Fingerprints
This is one of the most commonly used features that have been used to identify humans. Prior to the
advent of biometric tools, fingerprints (captured on paper using ink marks) have been used extensively
in forensics for the identification and verification of criminals. Provided the advent of new technologies,
fingerprints are now captured using optical, capacitive or ultrasonic sensors, that measure the ridges,
valleys and islands in a fingerprint.
Pace
Humans are conditioned to recognize each other based on facial features. Consequently, facial features
can be considered an "inherent" modality since it is widely used for recognition amongst humans.
Captured usually as an image, facial features are normally used for identification or verification in a
multimodal biometric system. Commonly used algorithms that support this process include measuring
the distance between the facial features. Another approach employs scalar comparison between parts
of the face using the sample image and the template set. Facial thermographs are also used as a facial
trait.
iris
This type of recognition identifies a subject utilizing the trabecular pattern which is formed based on the
anatomy of the eyes' structure. It has been established that the iris in a human being retains its
structure over time without being affected by the environment. Using the scanned images of the user's
iris and those existing in the template database, the identity of the subject can be established through
an image processing technique.
Palmprin I Recognition
Performance Analysis of Multimodal Biometric Systems - An Automated Statistical Approach |
features identifying the deltas, ridges, islands and ridge ends, or line features including any wrinkles, or
the texture of the skin.
Hand Geometry
Using hand geometry in biometrics involves measuring various parameters of a hand including the size
of the fingers, the spacing between the fingers, and any other structural factors that can contribute to
the uniqueness of a human hand. Comparison between images is employed to authenticate the user.
2,1,2 Behavioral Features
Voice
Speech recognition can be used in a biometric system and can establish the speaker's identity by
processing the speech signal. The anatomical structure of the speaker can be identified using the
amplitude spectrum of the speech patterns. The methodologies used in the process include dynamic
time-warping, neural networks, and hidden Markov models.
Handwriting
Also generalized with the term "signature", handwriting is a trait that can, to a degree of confidence,
identify a subject or verify the identity of a subject. A person's signature is legally accepted as a
verification measure, although it is not scrutinized as per the true meaning of, and the implementation
of biometrics. For true biometric systems, the verification of handwriting is performed by studying its
time parameters such as velocity and acceleration, or its feature parameters. This is referred to as online
signature verification in which case the sample is available for analysis while it is being written by the
subject. Offline signature verification is performed with an existing sample. The measures include the
shape of the letters, the pressure of the letters, their luminescence, etc.
Given on the next page, in Figure 2, is a list of common biometric traits and their performance based on
the properties of universality, distinctiveness, permanence, collectability, performance, acceptability
Performance Analysis of Multimodal Biometric Systems - An Automated Statistical Approach
Biometrics: :• 14
iFace
; Fingerprint
| Hand geometry
: Keystrokes
I Hand veins
I Iris Retina! scan Signature Vaice Facial thermograph Odor DHA
: Gait
; Ear Canal
Universality H | Uniqueness El Permanence SColIeetability fS Performance
i 1 :
|H H
X L :L
H IH
-• • H
L 1 H
L.
it
Lh: JL
-.
- f-L f-L V L r!
.*
L U" H L 1+ '< LX
iH
|L L |L- H |H L ;M El Acceptability 3~« •-- —:~ L ,L H if H L ' h "s3 Circumvention* li1
;.
;H
i :
;H ' :..
|H
H_
„ H-•
•
Figure 2: A comparison of various biometric traits for properties (Jain, 2004) (H^High, M=fvledium, L-Low)
2.1,3 Biometric System Components
A biometric system, which can be used either under the verification mode or under identification mode,
accepts as an input some biometric data from an individual and extracts a feature set that is then
compared with the template set in the system database. A common biometric system consists of the
following modules:
Sensor module: This is the interface that captures the biometric data from an individual during
enrolment (initial registration of a genuine user's biometric information) as well as the
identification step. This module usually consists of the hardware that interfaces with the users
such as cameras, voice recorders, fingerprint scanners, etc.
Feature extraction module: This module processes the captured biometric data to extract the
feature set (set of distinguishing features). The extracted "features" depend on the type of
biometric modality being considered and the algorithm being used. For example, the feature
extraction module may report the length and width of fingers, provided a hand is being used for
Performance Analysis of Multimodal Biometric Systems - An Automated Statistical Approach
• Matcher module: This module compares the feature set against the template set stored in the
system database to generate matching scores. The data in the template set is the information
set captured during the enrolment process. This data is represented according to the chosen
feature extraction algorithm. The biometric signal presented in the identification or verification
process is extracted using similar feature extraction algorithms and compared by the matcher
module. The matching scores generated indicate the probability that the user is either genuine,
or impostor. Normally, a decision module is also available within the matcher module. The
decision module makes the decision on the authentication of the subject based on the matching
scores and a defined threshold value.
• System database module: This consists of the database containing the template sets of all
enrolled individuals. The biometric information gathered during the enrolment process is
verified to ensure quality expectations are met and then recorded in a usable digital form. For
example, the scanned images of fingerprints, through feature extraction module, can be
recorded as distance between ridges and valleys, the number of deltas, forks or ridge endings,
etc. The matcher module uses the information in this database against which it verifies the
identity of the subject.
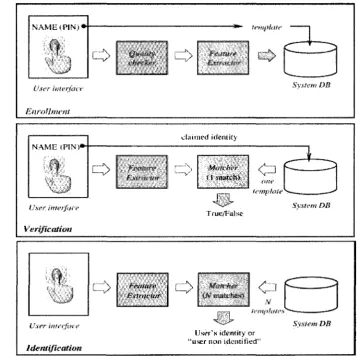
Provided in Figure 3, are all biometric system components as used during the process of enrolment
(initially recording user data that is used to authenticate the user later), during the process of
verification and during the process of identification. The flow of information between the components is
Performance Analysis of Multimodal Biometric Systems - An Automated Statistical Approach
NAMfc (PIN.)*'
Cf
- C "f/ \er fnwrjtti e
Enrollment
a>
s\Extractor
*l
|
cr^r>
System BB
V
NAME; (PIN)""
User intei) n t'
'erificatimt
[ ^
ijtmu em
claimed loetuiiy
*• • - %
i 1 fflMCfc'J
True/False. 'V—1
)
i d
~Z5
S~_ _ — '
System DB
1
£/,sw inH'ifiH'f
detttiftcation
t=f>
, - N • Matcfter • •(.V matches!
1
l >tutih*ti>\
I "a.'
< >
Jser's identity' *r nort i class fi
or
|CZZ^
^*»_. ^r
SysUrnDB
Figure 3: Diagrams identifying system rrtoduies within various application context modes ( . Jain, 2004)
2.1,4 Limitations of Unimodal Systems
Due t o its infancy, and to a degree the limited acceptance of the technology, majority of the biometric
systems in place are unimodal systems, i.e. they rely on a single biometric trait to identify (or verify the
identity) of a person. Such systems have low performance in terms of their ability to identify a person
with confidence measures necessary in security critical applications such as forensics and federal
programs. Some of the issues with biometric systems commonly in use today have been identified in (A.
Performance Analysis of Multimodal Biometric Systems-An Automated Statistical Approach J
• There might be noise present in the data due to factors including defective equipment used t o
collect the biometric signals, alteration in the biometric trait itself owing to physical injuries or
due to health conditions. Noise due to the limitations in the physical environment may also be a
factor. This type of noise includes lighting conditions, humidity, heat, etc.
• Intra-class variations are caused by changes in the subject's interaction with the system during
enrolment and identification phases. For example, the user may improperly scan his/her
fingerprint by placing the finger on the scanner inaccurately, or there might be a difference in
the lighting conditions. Another reason for intra-class variations is the difference in the
equipment itself. During enrolment, an optical state fingerprint sensor might be used and during
the identification process a different solid state sensor might be used.
• Inter-class variations (or lack thereof) indicate the potential commonality in the measured
features amongst the population. These similarities are usually magnified in case of biometric
traits that are anatomically controlled by genetics. For example, facial features and voice are to
a large extent similar in related individuals such as parents and children and amongst twins.
• Non-universality refers to the limitations in the presence of a biometric trait across all human
population. It has been observed that not all (if any) biometric traits are universal. Even
fingerprint, largely considered to be a uniquely identifying feature in humans, is not available in
2% of the population rendering it useless for those.
• Spoof attacks are performed by individuals unlawfully accessing sensitive resources by acting as
masqueraders of authorized users. These attacks are usually carried out by replicating
behavioral traits including voice and handwriting. Physical traits are also replicated, although
not frequently.
2,2 Multimodal Biometric Systems
As the name suggests, multimodal biometric systems combine biometric information from multiple
sources to establish the authenticity of a person. As identified in (A. Ross A. J., 2004), multimodal
biometric systems resolve, to a degree, the issue posed by non-universality. This is done by taking into
account multiple biometric traits that can better identify a person when used in conjunction as opposed
Performance Analysis of Multimodal Biometric Systems - An Automated Statistical Approach
more difficult to replicate the information since any illegitimate use will require the subject to imitate
multiple features. More details have been provided in the following sub-section.
2,2,1 Necessity of Multimodal Biometric Systems
In section 2.1.4, some limitations of biometric systems relying on a single trait or modality have been
identified. Multimodal biometric systems counter these limitations and present an improvement in the
authentication performance. These improvements have been listed below.
• The noise present in the data due to factors such as defective equipment, alteration in the
biometric trait or limitations in the physical environment have a lesser probability of affecting
multiple hardware and multiple traits. Hence, a multimodal biometric system ensures
improved performance.
• Intra-class variations are mitigated provided any degree of difference in user's interaction with
a particular component of a multimodal system is distributed over the entire system during the
authentication process, therefore, lessening its effects. The probability of change in hardware
throughout the system is also less compared to a single modality biometric system.
• Inter-class variations are also mitigated provided the commonality in physical or psychological
traits within individuals is of much lesser probability than a single trait.
• Non-universality is addressed in multimodal biometric systems due to the increased size of the
biometric traits' set. The probability of finding a biometric signal to authenticate a user
increases with an increase in the number of modalities.
• Spoof attacks are also limited in multimodal biometric systems, simply owing to the number of
biometric signals that must be imitated to carry out such an attack.
Multimodal biometric systems, consequently, provide an improved performance over unimodal systems
in their ability to authenticate a user in presence of various limiting factors discussed above. In addition,
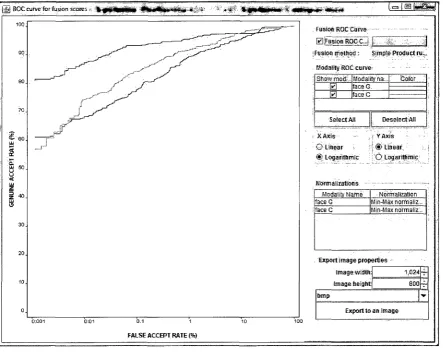
multimodal biometric systems also provide improved security within the systems themselves. Provided
below, in Figure 4, is a sample chart comparing the performance of a multimodal biometric system and
individual biometric systems. As can be observed, the black curve representing the combined
Performance Analysis of Multimodal Biometric Systems-An Automated Statistical Approach
modalities) represented by the other two curves, for any given value of FAR. An understanding of the
genuine acceptance rate (GAR) and the false acceptance rate (FAR) has been covered in a later section.
U=»l-iBi'liigjii
| ^ iOGcurvefor fusion -scores Vt»*WMM» * W * w ~ M * . » .' - " - * . * # ».>W«»i« i < » i — » » ,jB'<M»8#
FALSE ACCEPT RATE (%)
. Fasioti ROC'Ciirve
-0 f'SHlKflL; r ;
•Fusion met&od; Simple Product ru., Modality ROC curve
ShoivmorJ
. r\ '1
Modality na faceG. faceC
"Color
SetectAll OeseteetAII : XAxts ,> VAxis
Qllisear ';• "r®:Linear, •'' ®, Logarithmic : ]'QLogaritfiraie^
N'ormaliiatioBS -'--. - — Modality Name
f3ce G faceC
Normalization Min-Max normaliz... Mln-Max normaliz...
Export image properties ImagawIdOi; Image height:
Export to an image 1.024:
800]
Figure 4: Comparison of multimodal biometrics system and unimodal systems in performance measured in GAR against FAR.
2.2.2 Multimodal Biometric Systems - Schemes
As described in previous sections, a multimodal biometric system is created by combining various
unimodal systems. The information retrieved in these individual systems is combined to create a
Performance Analysis of Multimodal Biometric Systems - An Automated Statistical Approach |
• Multiple sources of a single biometric trait such as index fingers from the left and the right
hands. In such case, the "index finger" provides the single biometric trait while the left and the
right fingers, specifically, provide the biometric signal that is combined.
• Different equipment types to enroll a single biometric trait such as an optical state sensor and a
solid state sensor. In such cases, a single biometric trait (and a single instance of that trait) such
as an index finger is authenticated through multiple sensors. Information from each sensor is
combined and provides an overall matching result.
• Multiple feature extraction or matching algorithms used on the same biometric data to provide
separate results to be combined. Biometric signals from the same trait and same equipment are
processed through more than one feature extraction module or matching module. Information
from these is combined for an overall result.
• Multiple enrolment records for a single biometric trait such as various angles of the face.
• Information from different biometric traits such as face, fingerprints, retinas, etc. This, as a true
multimodal biometric system, utilizes multiple biometric modalities (or traits) and combines
information retrieved from these into a single decision level score to authenticate the user.
2.2.3 C o m b i n i n g I n f o r m a t i o n i n M u l t i m o d a l B i o m e t r i c Systems - ' F u s i o n '
Combining information within multimodal biometric systems is referred to as the process of fusing
information. The information captured from various sources following the schemes mentioned in the
previous section can be fused at any of the following levels (Faundez-Zanuy, 2005):
• Sensor module level: The information from a single biometric trait can be captured through
multiple sensors. In this case, the information is usually in its native format. The combined
information can improve accuracy, ensure completeness of data or add more information to
the vector space. For example, images of a face taken at different angles can be used to
indicate depth in the image.
• Feature extraction module level: At this level multiple features can be extracted from the same
biometric trait (signal), or feature vectors from multiple biometric traits can be fused to
provide a combined feature vector. For example, using a face image, the spatial data can be
Performance Analysis of Multimodal Biometric Systems - An Automated Statistical Approach |
• Opinion level: This essentially combines information at the matcher module in terms of
distance or similarity to result in a single combined confidence level of authenticity achieved
through a chosen normalization technique. For example, matching scores from multiple
biometric systems can be combined, through normalization at a similar scale, to create a single
matching score indicating the authenticity of the subject. This type of fusion is also called
matching level fusion.
• Decision level: Fusion at this level requires a combination of various decisions made through
multiple unimodal biometric systems to achieve a final combined decision to establish the
identity of the subject. Usually, the decision output from a biometric system is in the form of a
probabilistic match between the provided biometric signal and the information stored in the
template database. As an example, an aggregate function can be applied to individual decision
Performance Analysis of Multimodal Biometric Systems - A n Automated Statistical Approach
Chapter 3. Problem Statement
3 . 1 P e r f o r m a n c e E v a l u a t i o n o f M u l t i m o d a l B i o m e t r i c S y s t e m s
Performance in biometric systems, measured in terms of their accuracy, ease of use, speed, and other
measurable is paramount given the increasing use of such systems in high security applications in
government organizations, as well as in solving crimes through forensics. Given the access to
information and the need to secure the same, biometric systems are on the rise in commercial
applications as well, enhancing the requirement for such systems to perform well in varied
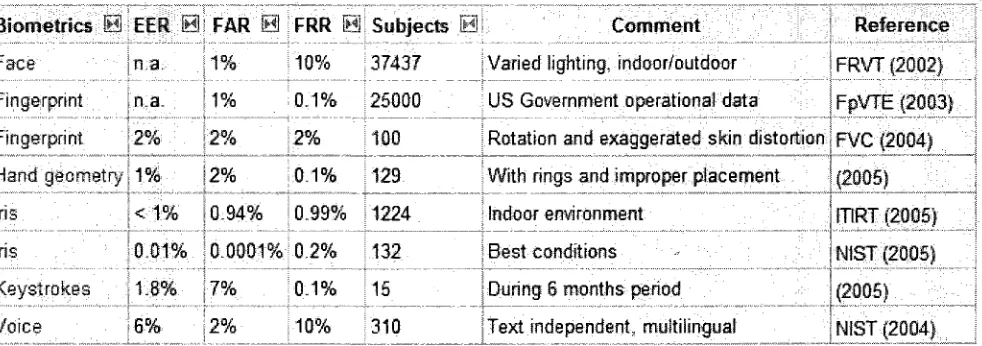
circumstances. A comparison has been provided below in Figure 5. (EER, FAR and FRR are measurable
units for biometric systems explained in the following sections).
i B i o W # i y i S : i:E | | : ; f H j FAR I d JFRR H | Subjects H i
I Face
j Fingerprint
j Fingerprint 2%
(1%.
| 1 %
!:2%
; Hand: gfto met ry 1%
110%
;Q.1%
[2%
1:0.1%
137437
25000
100
1129
Iris
Iris
Keystrokes
Voice
< 1 % 10.94% 0.99% [1224
0.01% 0.0001% 0.2%
1.8% . 7 % 0 . 1 %
16%
10%1132
[ 15
!'310
Comment Reference
Varied lighting, indoor/outdoor , FRVT (2002}
US Government operational data FpVTE (2003}
Rotation and exaggerated skin distortion FVC (2004)
With rings and improper placement (2005}
Indoor environment ] ITIRT (2005}
:
:|NIST(2005)
.'.7.]m .
|NIST|2004)
I Best conditions
During 6 months period
Text independent, multilingual
Figure 5: Performance of various biometric systems using standard measurable fSiometrics, 2008)
Since multimodal biometric systems are more useful in comparison to unimodal systems, the thesis
strives to provide a framework to evaluate such systems in an automated environment, however, under
noise conditions that are unavoidable in commercial settings, following the findings in (Gan, 2007). The
application proposed within this paper performs evaluation of biometric systems automatically t o
Performance Analysis of Multimodal Biometric Systems - An Automated Statistical Approach
According to (A. K. Jain, 2004), the two primary types of errors caused by a biometric verification system
are the false match rate (also called the false accept rate or FAR) and the false nonmatch rate (also
called the false reject rate or FRR). The false match rate is the degree of the system inaccurately
accepting biometric inputs from two individuals to be the same person. The false nonmatch rate is due
to the system rejecting inputs from the same person as being from two different individuals. Since a
biometric system results in a matching score, a threshold is identified in context of its application for
which a genuine subject would need a score higher than the threshold. The false match rate is inversely
related, while the false nonmatch rate is directly related to the system threshold. Figure 6 (a) provides
the probability distribution curves of the genuine and impostor matching scores. Against a chosen
threshold, t, the FMR and FNMR have been displayed. Figure 6 (b) provides a curve for a function of FMR
and FNMR. Provided is a generalization of application types as applied to the curve. As can be observed
in the figure, forensic applications are tolerant to a higher FMR, which allows for a higher pool of
suspects, while applications (or resources) that require a higher level of authentication allow a higher
FNMR.
Genuine distribution
Matching matt
(a)
Bttrenm* Applications
Civilian
Application^ , High Seeafity Applications
Fate No« Match Rate (FNMR)
(b)
Figure 6: (a) Impostor and Genuine scores distributions for threshold t with corresponding FMR and FNMR. jb) Receiver
Performance Analysis of Multimodal Biometric Systems-An Automated Statistical Approach J
The FMR (referred to as FAR in this document from this point forth) and the FNMR (referred to as FRR in
this document from this point forth) are discussed in more detail in the following sub-sections. Also
discussed are additional biometric performance measures that are, however, used in limited scenarios.
3.1.1 FAR (False Accept Rate)
FAR represents the frequency with which a given biometric system identifies an impostor as a genuine
subject. Mathematically, the FAR is the ratio of successful fraudulent attempts and the total number of
fraudulent attempts. This is denoted by,
successful fraudulent attempts made for identity n
FAR (n) = ,
all fraudulent attempts made for identity n
where, n is a unique identity.
The overall FAR of a biometric system can be calculated as an average through the formula,
FAR(A/)=-
S n
= 1F i 4 / ? ( n ) ,
where, N represents all identities being evaluated by the system.
The FAR represents a statistical value, and therefore is dependent on the size N of the identities against
which the biometric system is tested as well as the number of fraudulent attempts made. In an effort to
determine the FAR, a probability distribution curve is usually used that is an approximation of a
histogram representing the frequency of similar matching scores for genuine and impostor users (Figure
6). Mathematically, the distribution curve is represented as,
FAR{t) = /
t
p(s\impostor)ds,
where, t is the threshold on the scale of the matching scores identifying genuine and impostor users. The FAR is the area under the impostor distribution curve with matching score values greater than the threshold.
3.1.2 FRR (False Reject Rate)
The FRR represents the frequency with which a biometric system rejects a genuine user, failing to
Performance Analysis of Multimodal Biometric Systems - A n Automated Statistical Approach
of the number of failed authentication attempts for genuine users and the total number of
authentication attempts made for genuine users. The formula for the FRR is denoted by,
rejected genuine attempts made for identity n
F R R
(") = 7, : T~^—r: : ,
all genuine attempts made for identity n
where n is a unique identity in the system.
The overall FRR of a biometric system can be calculated using the average through the formula,
FRR(N)=^ £ n = i F t f / ? ( n ) ,
where N represents all identities within the biometric system.
Similar to the FAR, FRR represents a statistical value dependent on the size N of the identities against
which the biometric system is tested as well as the number of authentication attempts made. In an
effort to determine the FRR, a probability distribution curve is used that is an approximation of a
histogram representing the frequency of similar matching scores for genuine and impostor users (Figure
6). Mathematically, the distribution curve is represented as,
w = /_ p(s\genuine)ds,
FRR.. . -co
where, t is the threshold on the scale of the matching scores identifying genuine and impostor users.
The FAR is the area under the impostor distribution curve with matching score values greater than the
threshold.
3.1,3 GAR (Genuine Accept Rate)
The GAR represents the frequency by which a biometric system accepts genuine users as authentic. The GAR is related to the FRR through the formula
GAR = 1-FRR
Performance Analysis of Multimodal Biometric Systems - A n Automated Statistical Approach
3,1,4 EER (Equal E r r o r Rate]
The FMR and the FNMR are both performance measures that rely on the chosen threshold values. The
Equal Error Rate, EER, on the other hand is independent of the threshold. In general, the EER is the value
on the ROC curve where the FMR and FNMR are equal. A low value of EER is considered to represent a
biometric system with highly accurate performance. The EER has been claimed to be unreliable and
limited provided any comparison performed between biometric systems using the EER is done within a
small range of values, which may or may not provide a generalized result. Further, for the purpose of
comparing multiple biometric systems, EER has limited usefulness given the curves denoting the
biometric systems may overlap. Given below in Figure 7 is a representative ROC curve identifying the
EER.
FMR
Figure 7: ROC curve indicating the Equal Error Rate (EER), where EER = FNMR = FMR
3,1.5 FT A ( F a i l u r e to A c q u i r e Rate)
The FTA (or FTC as Failure to Capture rate), identifies the frequency of a biometric system's inability to
identify and correctly capture the biometric signal presented to it. The FTA can be considered as a
measure of noise within the biometric system since it usually results in inaccurate biometric data. This
Performance Analysis of Multimodal Biometric Systems - An Automated Statistical Approach |
3,1,6 FIR (False Identification Sate]
The FIR is the frequency of times a biometric system incorrectly identifies a genuine user and attributes the user with an identity not his/her.
FAR and FRR are the identified measurable that are utilized to establish the performance of biometric
systems used by manufacturers. Further, the ROC curve (the FRR is replaced by the GAR and the
biometric system(s) is plotted with GAR and FAR) is also commonly used to compare multiple biometric
systems (Gan, 2007). (P.J. Phillips, 2000) has identified the following evaluation protocols.
• Technology evaluation: This involves testing the prototype algorithms and results in identifying
technological progress and promising approaches in controlled laboratory conditions. The
algorithms applied including those for acquiring biometric signals, retrieving feature sets from
the provided signals and generating matching scores are tested to identify the performance of
the biometric system.
• Scenario evaluation: Scenario evaluation revolves around measuring system performance of a
biometric technology within a class of applications under conditions resembling real world
deployment scenarios. As an example, the evaluation process might consider biometric systems
as applied to providing access to high security buildings.
• Operational evaluation: This tests a particular biometric system within a particular application
scenario. As an example, biometric systems might be tested to evaluate performance of
fingerprint scans at the JFK airport in New York.
Both scenario and operational evaluations of biometric systems are specific to applications and
situations. Consequently, the results from such evaluations cannot be generalized and do not promote
an understanding of the performance of biometric systems as well as a comparison of such systems
without the specificity of the environment under which these are studied. Technological evaluation of
biometric systems (considering various technologies employed within such systems) provides means for
a better analysis.
Within the context of technology evaluation, in (Gan, 2007), the author has established the limitations in
Performance Analysis of Multimodal Biometric Systems-An Automated Statistical Approach |
varied biometric traits, databases, algorithms, normalization methodologies and fusion methods. The
author has promoted factoring noise in performance evaluation since traditional tests provide
situational outcomes that are inconsequential in a generalized context. Factoring noise in the
performance evaluation allows users to conduct more realistic evaluations of biometric systems.
3 , 2 A S t a t i s t i c a l A p p r o a c h
With respect to evaluating performance of multimodal biometric systems, various assessment factors
exist including technological performance, security performance, user acceptance, identification and
verification performance, etc. Of paramount importance and of direct consequential value is a biometric
system's performance in correctly evaluating the data presented to it to identify or verify a subject's
authenticity. In (R. Snelick M. I., 2003), the authors have provided a framework to conduct performance
evaluation of multimodal biometric systems. The authors have pointed the importance of fusion in any
multimodal biometric system (essentially to achieve a multimodal biometric system, a level of fusion of
data is necessary). They have also identified the benefits of performing fusion at the matching scores
level including the ability to use existing matching score databases available in the public domain (or
otherwise) and the ability to conduct tests without affecting existing biometric systems (since the
experiments are conducted on data generated by these systems). The following framework has been
suggested.
• Identify the target set and the query set consisting of signatures known to the biometric system
and the signatures to be compared against the known signatures, respectively.
• Generate a matching score matrix (similarity matrix) for each pair of the target and query sets'
signatures.
• Create gallery sets and probe sets from the target and the query set, respectively. Repeat the
three steps for each biometric modality.
• Format the data from the different modalities into similar unit and ensure the size of the
similarity matrices is the same. An assumption is that all modalities are statistically independent
and can be combined to create virtual subjects (to indicate the information comes from the
same subjects).
Performance Analysis of Multimodal Biometric Systems - An Automated Statistical Approach j
• Fuse the data from the various similarity matrices from each biometric modality to a single
fused similarity matrix.
• Using the fused similarity matrix with (with fused genuine and impostor scores), achieve the
performance measures including the FAR and the FRR. Create the ROC curve using the FAR and
GAR to evaluate the multimodal biometric system being studied.
The above mentioned framework guidelines have been used by the author in (Gan, 2007) to validate
performance of multimodal biometric systems under the influence of noise. The author indicates the
difficulties in establishing a testing system taking into account every noise source due t o the exponential
growth of the noise factors. The use of robust parameter design has consequently been proposed to
identify the values for system parameters to institute a high performance, functional and robust
methodology. Design of Experiments (DoE) has been used within which a Parameter Diagram has been
created outlining the various system parameters including the biometric signals, the noise factors and
any control factors to generate the performance matrices. The author has further used the Gaussian
Noise Model to generate noise factors through deviations based on interval values that are
representative of the general continuous values.
It has been pointed out that using a full factorial experimentation method will be cumbersome due to
the number of different combinations that can be achieved through the controllable and uncontrollable
factors (and provided the lack of support to carry out such tests without an automated framework). The
controllable and uncontrollable factors including the fusion methodologies, the normalization
techniques, the number of modalities considered, the distribution of noise within each of those
modalities considered, etc. result in an exponential growth in the number of possible test cases
(considering also the various levels of operation in each of these parameters). In (R. Krishnan, 2007), the
authors have discussed Orthogonal Array Based Testing Strategy (OATS) and displayed, with examples,
the increased effectiveness and efficiency in using orthogonal arrays to generate test cases. In most
practical implementations, OATS offers extensive coverage of the testing domain with minimal number
of test cases through pair-wise combination of parameters affecting the tests. A library of multiple
orthogonal arrays is available at the website http://www.research.att.com/~nias/oadir/index.html that includes arrays designed for various numbers of factors and levels. Even though orthogonal arrays
Performance Analysis of Multimodal Biometric Systems - An Automated Statistical Approach |
evaluating multimodal biometric systems given the benefits of even marginal improvements in the
performance of such systems. A more flexible approach and selection of test cases (even though limited
through OATS) is necessary for improved evaluations.
To evaluate the performance of the stated multimodal biometric systems considering a combination of
face and fingerprint readings using the NIST BSSR1 database, the author in (Gan, 2007) has generated an
evaluation matrix. The matrix consists of the control factors, discussed in the next paragraph, and
possible combinations of the same. The noise added to considered modalities, valued at various
deviation intervals, are the uncontrollable factors. Combinations of the values of these factors are
achieved by using orthogonal arrays. For example, an L9 Taguchi orthogonal array has been used to
specify the noise variations in the combination of the four modalities.
It has been observed that for performance analysis, partitioning the original dataset into training and
testing datasets, referred to as cross validation within the statistical analysis field, yields more accurate
results. To evaluate biometric systems, the partitioning of the BSSR1 dataset through one of the possible
partitioning schemes such as re-substitution validation, holdout validation or leave one out validation
results in a controlled factor to be considered in experimentation. Values for the normalization scheme
and the fusion method are the other controlled factors.
3,3 Automated Analysis
Evaluating a biometric system to verify its performance based on a defined set of controlled and
uncontrolled factors within the statistical analysis methodology can be time consuming. This complexity
stems from the fact that the number of test cases that can be generated for each of the system
parameters increases exponentially provided the noise factors, the fusion methodologies and the
normalization schemes that are considered. The number of modalities considered is also an influence.
Even though the test cases are reduced through the use of orthogonal arrays, previous use of manual
applications to determine the performance of multimodal biometric systems has been shown to be cost
ineffective. For example, in (Gan, 2007), the author has manually executed 126 experiments using
various fusion methods and normalization schemes, with limited results. The solution proposed in the
past employs tools that allow the user to perform some automated analysis, but still requires manual
Performance Analysis of Multimodal Biometric Systems - An Automated Statistical Approach |
Discussed in this section are the primary tools used to perform the experiments t o analyze the
performance of multimodal biometric systems based on the theoretical framework discussed in the
previous section.
3.3. t NISI BSSR1 Database
In (Gan, 2007), the author has chosen the NIST BSSR1 database as the database of choice for genuine
and impostor matching scores. The BSSR1 database is a true (actual subjects) multimodal database and
it provides the largest dataset available in the public domain. The BSSR1 contains matching scores in
three variations; one set combining data from face and finger fusion, one set combining scores from two
fingers fusion and one from combining two different algorithms. Further, each of these variations
contains matching scores from 517, 6000 and 3000 subjects, respectively. The matching scores have
been captured through cross comparison of all subjects in similarity files. Each file contains one genuine
score and remaining impostor scores. As used in (Gan, 2007), only the data set combining the face and
finger modalities have been considered to evaluate the resulting multimodal biometric system.
3.3.2 BSSR Processor
The BSSR Processor is a Java application that operates on the BSSR1 database. The author (Gan, 2007)
has implemented the functionality to generate comma delimited files for genuine and impostor scores
that are used as input to the MUBI tool. The files are generated, one each for the faces and fingers
modalities. Noise is also added to the scores through the use of Gaussian noise generator module within
the processor.
3.3.3 MUBI (Analysis Tool)
MUBI is a Java application developed at West Virginia University as an analysis tool for biometric
systems by evaluating matching scores through a selection of fusion and normalization techniques. It
allows the user to submit genuine and impostor scores in comma delimited files, one each for multiple
biometric modalities. The user can then choose a normalization scheme and a fusion method to plot the
density curves of genuine and impostor scores. As an output, MUBI also provides the ROC curves for the
modalities of choice. This enables the user to understand the performance of the single multimodal
Performance Analysis of Multimodal Biometric Systems - An Automated Statistical Approach |
3.4 Problem Definition
Even though earlier work has been done in measuring performance of multimodal biometric systems
under the influence of noise factors (Gan, 2007) through experimentation, the existing tools such as the
NIST BSSR1 database, the BSSR Processor and the analysis tool MUBI limit the test cases that can be
generated due to the manual inputs. The experiments performed in the previous work have been
conducted over a single dataset with provided modalities. To carry out meaningful performance
comparisons for multimodal biometric systems over different biometric databases will require
additional experiments with consideration to the levels of noise introduced in the system. From a
usability point of view, it is also difficult to measure performance of various multimodal biometric
systems against one another. Such a usage scenario will require the user to manually identify each
multimodal biometric system individually and use the existing tools repeatedly to evaluate their
performance separately. The results gathered will then have to be manually compared to generate a
performance evaluation report. This process is tedious as well as time consuming. Further, use of the
BSSR1 database limits the cases under study to a specific multimodal biometric system evaluation,
provided it includes matching scores for face and fingers, fingers, and alternate algorithms only. The
chosen intervals to introduce noise in the system also create system boundaries for the analysis
performed.
Due to the shortcomings discussed above and the requirements of performance evaluation of biometric
systems, the technical and commercial viability of the studied framework has its limitations. This thesis
and the resulting application strive to automate the process of generating test cases and input to the
analysis tool. It is the intent to allow users the ability to combine matching scores from various
multimodal databases that are similar in structure to create a larger subject set. The user will be allowed
t o configure the noise intervals and the range of values for each. Depending on the dataset, the
biometric systems will be generated automatically by considering individual modalities and by
generating subsets of the modalities from the provided dataset. The proposed tool will scale the
analytical capabilities of MUBI to generate reports and graphs using the ROC curve as a function of FMR
and FNMR. The reports and graphs comparing the multimodal biometric systems will be created