This article was downloaded by: [North Carolina State University], [Joseph Hightower] On: 19 December 2011, At: 09:52
Publisher: Taylor & Francis
Informa Ltd Registered in England and Wales Registered Number: 1072954 Registered office: Mortimer House, 37-41 Mortimer Street, London W1T 3JH, UK
North American Journal of Fisheries Management
Publication details, including instructions for authors and subscription information: http://www.tandfonline.com/loi/ujfm20Identification of American Shad Spawning Sites and
Habitat Use in the Pee Dee River, North Carolina and
South Carolina
Julianne E. Harris a & Joseph E. Hightower b a
North Carolina Cooperative Fish and Wildlife Research Unit, Department of Biology, North Carolina State University, , 127 David Clark Labs, Campus Box 7617, Raleigh, North Carolina, 27695, USA
b
U.S. Geological Survey, North Carolina Cooperative Fish and Wildlife Research Unit, Department of Biology, North Carolina State University, 127 David Clark Labs, Campus Box 7617, Raleigh, North Carolina, 27695, USA
Available online: 14 Dec 2011
To cite this article: Julianne E. Harris & Joseph E. Hightower (2011): Identification of American Shad Spawning Sites and Habitat Use in the Pee Dee River, North Carolina and South Carolina, North American Journal of Fisheries Management, 31:6, 1019-1033
To link to this article: http://dx.doi.org/10.1080/02755947.2011.633686
PLEASE SCROLL DOWN FOR ARTICLE
Full terms and conditions of use: http://www.tandfonline.com/page/terms-and-conditions
This article may be used for research, teaching, and private study purposes. Any substantial or systematic reproduction, redistribution, reselling, loan, sub-licensing, systematic supply, or distribution in any form to anyone is expressly forbidden.
ISSN: 0275-5947 print / 1548-8675 online DOI: 10.1080/02755947.2011.633686
ARTICLE
Identification of American Shad Spawning Sites and Habitat
Use in the Pee Dee River, North Carolina and South Carolina
Julianne E. Harris*
North Carolina Cooperative Fish and Wildlife Research Unit, Department of Biology, North Carolina State University, 127 David Clark Labs, Campus Box 7617, Raleigh, North Carolina 27695, USA
Joseph E. Hightower
U.S. Geological Survey, North Carolina Cooperative Fish and Wildlife Research Unit,
Department of Biology, North Carolina State University, 127 David Clark Labs, Campus Box 7617, Raleigh, North Carolina 27695, USA
Abstract
We examined spawning site selection and habitat use by American shadAlosa sapidissimain the Pee Dee River, North Carolina and South Carolina, to inform future management in this flow-regulated river. American shad eggs were collected in plankton tows, and the origin (spawning site) of each egg was estimated; relocations of radio-tagged adults on spawning grounds illustrated habitat use and movement in relation to changes in water discharge rates. Most spawning was estimated to occur in the Piedmont physiographic region within a 25-river-kilometer (rkm) section just below the lowermost dam in the system; however, some spawning also occurred downstream in the Coastal Plain. The Piedmont region has a higher gradient and is predicted to have slightly higher current velocities and shallower depths, on average, than the Coastal Plain. The Piedmont region is dominated by large substrates (e.g., boulders and gravel), whereas the Coastal Plain is dominated by sand. Sampling at night (the primary spawning period) resulted in the collection of young eggs (≤1.5 h old) that more precisely identified the spawning sites. In the Piedmont region, most radio-tagged American shad remained in discrete areas (average linear range=3.6 rkm) during the spawning season and generally occupied water velocities between 0.20 and 0.69 m/s, depths between 1.0 and 2.9 m, and substrates dominated by boulder or bedrock and gravel. Tagged adults made only small-scale movements with changes in water discharge rates. Our results demonstrate that the upstream extent of migration and an area of concentrated spawning occur just below the lowermost dam. If upstream areas have similar habitat, facilitating upstream access for American shad could increase the spawning habitat available and increase the population’s size.
The American shadAlosa sapidissimais an ecologically and economically valuable anadromous species with a native range from the St. Lawrence River, Canada, to the St. Johns River, Florida (Limburg et al. 2003). Presently, many American shad stocks are small as a result of overfishing, poor water quality, and habitat loss (Hightower et al. 1996; Cooke and Leach 2003; Limburg et al. 2003). One cause of population decline in some rivers is the presence of dams, which reduce or block migration to historic spawning sites upstream and alter habitat downstream
*Corresponding author: jeharris@ncsu.edu Received March 22, 2011; accepted July 14, 2011
(Pringle et al. 2000; Freeman et al. 2003; Schilt 2007). To in-crease populations of American shad and other migratory fishes, methods to allow access to areas upstream of dams have been implemented or are being considered for numerous regulated rivers (Cooke and Leach 2003; Weaver et al. 2003).
One regulated river for which fish passage is being consid-ered is the Pee Dee River, North Carolina and South Carolina. The Pee Dee River originates in the Appalachian Mountains in North Carolina as the Yadkin River and enters the Atlantic
1019
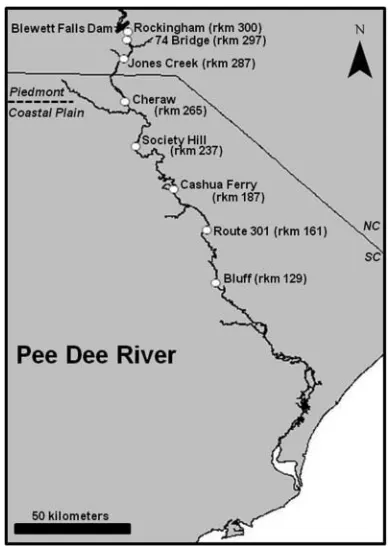
FIGURE 1. Map of the Pee Dee River, North Carolina–South Carolina, in-dicating plankton sampling sites (white circles; rkm=river kilometer) where American shad eggs were collected, Blewett Falls Dam (black bar), and the demarcation of the Piedmont and Coastal Plain physiographic regions (dashed line). The 74 Bridge, Cheraw, Society Hill, Cashua Ferry, Route 301, and Bluff sites were sampled weekly during daytime hours from mid-March to mid-June 2010; daytime and nighttime sampling was also conducted at the Rockingham, Jones Creek, Cheraw, and Society Hill sites during the main part of the spawning season in 2010.
Ocean through Winyah Bay in South Carolina (Progress En-ergy 2003; Kilduff et al. 2007). The river system supports com-mercial and recreational fisheries for American shad (Progress Energy 2003; Kilduff et al. 2007). American shad migrate as far upstream as Blewett Falls Dam, which is the lowermost dam on the Pee Dee River and is located approximately 303 river kilometers (rkm) from the river mouth (Progress Energy 2003; Figure 1). Blewett Falls Dam is a large hydroelectric fa-cility and forms a complete barrier to fish migration. As part of the Federal Energy Regulatory Commission relicensing ap-plication, future transport and volitional passage structures that will allow anadromous fishes, such as American shad, to access habitat upstream are being considered for Blewett Falls Dam. However, little is known about the American shad population in the Pee Dee River, including the spatial and temporal extent of spawning.
The main purpose of this study was to identify spawning site selection and habitat use by American shad in the Pee Dee River. This information will allow managers to better evaluate potential benefits of fish passage and the impacts of different discharge regimes. The benefits of providing access to areas upstream of dams are dependent on (1) the quality and quantity of suitable
spawning habitat both upstream and downstream of the dams, (2) connectivity between the upstream and downstream habitats, (3) migratory behavior, and (4) the population’s size (Harris and Hightower 2011). Our results will improve the understanding of American shad biology and spawning habitat requirements, especially with regard to changes in water discharge rates; these results can be used to guide appropriate management of Amer-ican shad and the Pee Dee River system.
METHODS
We used a combination of plankton sampling and ra-diotelemetry to characterize habitat use by American shad. Plankton sampling was completed in 2010 from mid-March to mid-June to encompass the entire spawning period. Man-ual radiotelemetry was completed to examine habitat use dur-ing the main part of the spawndur-ing season in April and May 2010.
Plankton sampling for American shad eggs.—By following an approach used to collect American shad eggs in previous studies (Bilkovic et al. 2002; Burdick and Hightower 2006; Harris and Hightower 2010), we conducted oblique plankton tows from a stationary boat between rkm 129 and 300 to obtain information about spawning sites throughout much of the Pee Dee River below Blewett Falls Dam (Figure 1). We sampled weekly at six main-channel sites (74 Bridge, Cheraw, Society Hill, Cashua Ferry, Route 301, and Bluff; Figure 1) during day-time (0930–1900 hours Eastern Daylight Time). At each site, we completed two 15-min oblique plankton tows by using a bongo frame with two 0.3-m-diameter plankton nets (tail to mouth ratio=6:1; mesh size=500µm). At each plankton tow site, we recorded depth, temperature (YSI Model 85), dissolved oxygen (YSI Model 85), and current velocity (Swoffer Model 2100 current velocity meter) from one point 0.5 m below the surface. We also determined the main substrate type (silt, sand, gravel, cobble, or boulder/bedrock) at the site either by using a petite Ponar grab (mainly for small substrates) or by tapping the bottom with the depth pole. A standard General Oceanics flowmeter was deployed adjacent to the net to estimate the vol-ume of water filtered during each tow so that volvol-ume could be standardized for all samples. We immediately fixed all samples in a 5–10% solution of buffered formalin. In the laboratory, samples were sorted and American shad eggs were counted and categorized into nine developmental stages (Jones et al. 1978; Shardo 1995; see Harris 2010 for stage descriptions).
Since American shad spawn mainly between dusk and mid-night (Leim 1924; Layzer 1974), we also sampled for eggs at night to obtain information during the diel spawning period. We collected nighttime samples from four main-channel sites (Rockingham, the main channel near Jones Creek [hereafter, “Jones Creek site”], Cheraw, and Society Hill; Figure 1), which were selected based on the locations of radio-tagged adults (see below) and differences in habitat types. Specifically, Rocking-ham and Jones Creek are located in the Piedmont physiographic
region, which is dominated by boulder and bedrock substrates with some silt, sand, and gravel bars; in contrast, Cheraw and So-ciety Hill are located in the Coastal Plain and primarily consist of sandy substrates, although gravel bars are present (Progress Energy 2006; Harris 2010). Similar to daytime sampling, we completed two nighttime plankton tows at each site. The first sample was taken just after dark, and the second was taken im-mediately afterward. Nighttime sampling became later as the season progressed and as the length of daylight increased, but sampling was completed between 2015 and 2150 hours East-ern Daylight Time. Nighttime sampling was conducted weekly at each site (as weather permitted) between late April and late May. Daytime plankton tows were performed within 2 d of each night sample at each location to enable comparison between daytime and nighttime tows in terms of the total number of eggs and the number of young eggs (i.e., staged as being≤1.5 h old) that were collected. The collection of young eggs suggests that recent spawning occurred in close proximity to the plankton tow.
To evaluate the distribution of American shad spawning in the Pee Dee River, we estimated the origin of each egg by using information on the egg’s developmental stage, the site of collection, water temperature, and current velocity. Similar to the methods of Burdick and Hightower (2006), the origin of each American shad egg (ORIGIN) was estimated based on the sampling site (SS; i.e., where the egg was collected), the age of the egg (AGE; i.e., duration for which the egg was in the water column between the time of spawning and the time of collection), and current velocity (VEL; i.e., rate at which the egg traveled in the water column) by the following equation:
ORIGIN (rkm)=(SS,rkm)+[(AGE,h)×(VEL,km/h)].
To accomplish this, the egg’s age must be estimated based on its developmental stage. Developmental stage and the time to hatch for an American shad egg are variable and influenced by water temperature, such that eggs in warmer temperatures develop and hatch more quickly than those at colder tempera-tures (Jones et al. 1978; Shardo 1995; Limburg 1996). Limburg (1996) developed a model to estimate time to hatch based on temperature for American shad eggs. In our study, eggs were col-lected over a variety of temperatures (11.0–25.9◦C), suggesting that time to hatch would also vary (2.3–19.0 d according to the Limburg [1996] model). Shardo (1995) and Jones et al. (1978) described developmental stages (STAGE) by age for eggs that were maintained at 16–17◦C. Because developmental speed will vary with temperature, STAGE is likely to underestimate AGE for eggs spawned at colder temperatures and to overestimate AGE for eggs spawned at warmer temperatures. To obtain a more accurate estimate for AGE, we assigned a correction fac-tor (CF), which was calculated as the ratio of the expected time to hatch for the water temperature at egg collection to the ex-pected time to hatch for a temperature of 16.5◦C based on the
Limburg (1996) model. Thus, STAGE was corrected to more accurately estimate AGE as follows:
AGE(h)=(STAGE,h)×CF.
The origins of all American shad eggs were binned into 5-km reaches between rkm 130 and 303 (rkm 300–303 was the upper reach), and all eggs in each bin were summed to evaluate the magnitude of spawning within each 5-km reach.
To evaluate the predicted spawning distribution and to exam-ine uncertainty in the estimated origins of American shad eggs, we developed a deterministic model and a stochastic model. For the deterministic spawning distribution model, temperature and VEL values were obtained at the plankton sampling site on the date of egg collection. However, there is individual variability in the development time of eggs (Jones et al. 1978; Shardo 1995), and there is environmental variability in temperature and VEL over the length of a river system. Therefore, environmental con-ditions at the site of collection are not necessarily representative of the conditions experienced by the egg during the period since it was spawned. Thus, we also developed a stochastic spawning distribution model that incorporated random variation into the temperature (i.e., to estimate AGE), VEL, and STAGE variables. Temperature varies over seasonal and diel time periods; thus, we regressed temperature against collection date, including data from all plankton samples sitewide and seasonwide, to estimate an expected temperature for each date and the variability around that value. To incorporate error, each egg was assigned a temper-ature value that was drawn randomly from a normal distribution with a mean equal to the expected temperature for the date of egg collection and a variance obtained from the regression model. Velocity varies along the length of the river and in response to changes in river discharge. In our study, VEL was always non-negative; therefore, we incorporated error by randomly drawing a value from a lognormal distribution with a mean equal to the VEL measured at the sample site on the egg collection date and a variance estimated from all plankton samples sitewide and seasonwide. We had no estimates of variability in the number of hours for which an egg remains in a developmental stage; thus, to incorporate variability into STAGE, we drew a random value from a uniform distribution with the approximate range of the developmental stage and assigned that value to STAGE. We used 1,000 replicate simulations with the stochastic model to estimate means and 95% confidence limits for the number of eggs originating in each 5-km reach. Eggs that were estimated to have originated above the downstream-most dam (Blewett Falls Dam at rkm 303) were excluded, as was also done by Burdick and Hightower (2006).
These spawning distribution models should be evaluated with caution for several reasons. We did not include an estimate of egg mortality or the rate at which eggs fall out of the water column and settle into substrates, and these rates are likely to vary with habitat (Massman 1952; Chittenden 1969; Marcy 1972; Layzer 1974). In addition, sampling effort could not be
estimated or standardized for each 5-km reach (i.e., although effort for each sampling site was estimated, sampling effort for each 5-km reach was not constant and did not occur during the same diel time period over the season). Finally, we incorporated only random noise into our stochastic model rather than any systematic biases.
Radiotelemetry of adults.—We used boat electrofishing to collect 37 adult American shad for radio-tagging. We obtained 19 individuals at rkm 301 just upstream of Rockingham (rkm 300) on 8 April 2010, when water temperature was 16.9◦C; 18 others were collected at Jones Creek (rkm 287) on 21 April 2010, when water temperature was 18.3◦C (Figure 1). These sites were selected because previous electrofishing by Progress Energy (2006) and the North Carolina Wildlife Resources Commission (Ryan Heise, personal communication) suggested that enough American shad could be collected for tagging at those sites. In addition, the area below Blewett Falls Dam is presently thought to be the main spawning site for American shad in the Pee Dee River. At collection, each American shad was measured for total length, its sex was determined, and one radio tag coated in glycerin was inserted into the fish’s stomach through the mouth by using a straw. Each American shad was immediately released back into the river at the site of collection.
Radio tags were cylindrical-shaped esophageal implant tags manufactured by Advanced Telemetry Systems. Model F1815 tags (N=20) were 36 mm long and 12 mm wide, weighed 7 g, and had a battery life of 182 d; Model F1825 tags (N=17) were 43 mm long and 12 mm wide, weighed 8 g, and had a battery life of 85 d. Since the two tag models were different sizes and were purchased in different years (Model F1815 tags were made in 2010; Model F1825 tags were made in 2002), we wanted to evaluate whether there were any transmitter performance dif-ferences that would affect our results. We divided the two tag types evenly between the two tagging dates (i.e., on each date, 10 Model F1815 tags and either 8 or 9 Model F1825 tags were deployed). We did not detect any obvious differences in results based on tag model; thus, all tagged fish were evaluated together regardless of tag model.
To identify movement patterns of and habitat use by adult American shad during the spawning period, we manually tracked the tagged fish weekly by boat between Blewett Falls Dam and Cheraw (Figure 1) during April and May 2010. Radio-tagged fish were tracked by use of an Advanced Telemetry Sys-tems Model R2100 receiver and antenna. Most of the tagged fish were detected in that reach during most weeks, so tracking was not completed in additional areas. When a tagged Amer-ican shad was detected, we located and recorded the position at which the transmitter signal was loudest. At each location, we collected data on temperature, dissolved oxygen, current velocity, depth, and substrate type, as was done at plankton tow sites. Although American shad are thought to primarily spawn between sunset and midnight (Leim 1924; Layzer 1974), most of the tracking was completed during the day because
the Pee Dee River between Blewett Falls Dam and Cheraw is difficult to navigate and would be unsafe to traverse at night.
To examine movement patterns on the spawning grounds, we plotted all fish locations by using ArcGIS. We calculated the distance from the downstream-most relocation point to the upstream-most relocation point for each tagged American shad (hereafter, “linear range”). Student’st-tests were used to com-pare the average linear range between adults released at Rock-ingham and those released at Jones Creek and between males and females. Tests were evaluated for significance at anαlevel of 0.05.
To evaluate habitat selection during the spawning period, use of specific habitats by tagged adults was compared with the es-timated availability of those habitats at different discharge rates. As part of the Federal Energy Regulatory Commission relicens-ing project, mean column water velocity, depth, and substrate were recorded from 52 transects in the Pee Dee River below Blewett Falls Dam by Progress Energy (2006). Transects were selected in the lower Piedmont region (below Blewett Falls Dam to Cheraw) and the Coastal Plain region (downstream of Cheraw to Route 301) of the Pee Dee River (Figure 1). Based on these data, Fisk (2010) modeled the predicted amount of habitat (for depth, mean column water velocity, and substrate) in the Pied-mont and Coastal Plain regions by using Riverine Habitat Simu-lation software (RHABSIM [1998]), which is used to implement the instream flow incremental methodology. Discharge rates on the lower Pee Dee River are highly variable and depend on rainfall and hydroelectric power generation schedules. In turn, discharge rates affect water velocity and depth in a region; thus, Fisk (2010) modeled the predicted proportions of different depth and velocity levels in the Piedmont and Coastal Plain regions throughout the flow range of the Blewett Falls hydroelectric fa-cility. Discharge was obtained from the U.S. Geological Survey gaging station at the 74 Bridge (station 02129000; Figures 1, 2). Discharge rates at the date and time of each manual relocation of an American shad were obtained from the same gaging station, and the proportion of each habitat variable (as modeled by Fisk 2010) was used as the estimate of available habitat for that fish detection. We first compared habitat use with habitat availabil-ity by using all fish detections and their associated availabilities. We calculated availability of each habitat variable (depth, ve-locity, and substrate) in both the Piedmont and Coastal Plain regions of the river to examine for possible between-region dif-ferences that might cause American shad to use the Piedmont region more intensely. We also examined use and availability in the Piedmont region at specific ranges of discharge to evaluate whether fish distribution was altered in response to changes in water velocity and depth. Because we could not control dis-charge rates, we divided relocations of tagged American shad and their associated habitat availabilities into different ranges after sampling was completed. Discharge ranges were based on observed breaks in discharge rates during tracking.
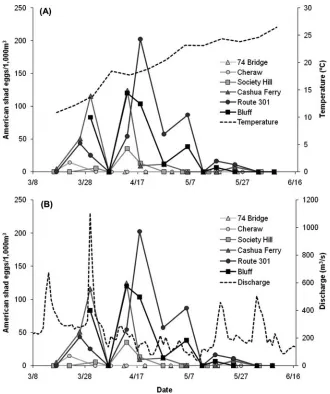
FIGURE 2. Density of American shad eggs (eggs/1,000 m3) from weekly daytime plankton sampling for each date and plankton tow site in the Pee Dee River (see Figure 1) presented in relation to(A)water temperature and(B)water discharge (U.S. Geological Survey gaging station 02129000, Rockingham, North Carolina). Darker hues for symbols and lines indicate sites that are farther downstream. Each density value was calculated from two plankton tows.
RESULTS
Plankton Sampling for American Shad Eggs
American shad eggs were collected from plankton tows in the Pee Dee River from mid-March to late May, when temperatures ranged from 11.0◦C to 25.9◦C. Calculated egg density from the six weekly plankton sampling sites was highly variable but was highest from late March to mid-May (Figure 2), when temper-atures ranged from 13.3◦C to 22.8◦C. Egg density was highest in mid-April at the Route 301 site (Figure 2). Higher daytime densities of eggs were generally observed at the lowermost three sites (Cashua Ferry, Route 301, and Bluff) than at the uppermost three sites (74 Bridge, Cheraw, and Society Hill; Table 1). The dominant substrate type was generally larger at the upstream sites than at the downstream sites (Table 2). Current velocity and depth were generally similar among the plankton tow sites
(Table 2) but cannot be used as measures of habitat availability for the region since the plankton tow sites were not selected ran-domly with respect to habitat. The plankton tow sampling gear requires certain ranges to function properly; thus, sampling was rarely completed at depths below 1.0 m or at current velocities less than 0.1 m/s. Egg ages varied within and between sites, but at five of the six daytime sampling sites the average age was estimated to be at least 20 h (Table 1). Only 4% of eggs (n=8 eggs) were estimated to have been recently spawned (i.e.,
≤1.5 h old).
The total egg density (all ages) and the density of young eggs (≤1.5 h old) were higher during nighttime plankton sampling than during daytime plankton sampling (Table 1). Almost 81% of the American shad eggs collected during nighttime plank-ton sampling were estimated to be young eggs; 100% of eggs from the Rockingham site and 96% of eggs from the Jones
TABLE 1. Average (SE in parentheses) density (eggs/1,000 m3) of all American shad eggs and only young eggs (≤1.5 h old) and the average age (h) of all eggs collected during daytime and nighttime plankton tows in the Pee Dee River (see Figure 1 for sites). Average densities were calculated from all plankton tows completed at the given site between mid-March and late May (the period of egg collections). Asterisk indicates that one egg was collected; therefore, SE is not presented.
Plankton tow site Average density of eggs Average age of eggs (h) Average density of young eggs (≤1.5 h)
Daytime Plankton Sampling
74 Bridge 0.6 (0.6) 45.3 (∗) 0
Cheraw 1.3 (1.3) 48.6 (0.0) 0
Society Hill 5.6 (3.3) 8.5 (3.1) 2.8 (1.9)
Cashua Ferry 29.4 (14.2) 28.3 (1.2) 0.8 (0.8)
Route 301 45.2 (17.9) 20.4 (1.5) 0.6 (0.6)
Bluff 40.4 (16.3) 26.3 (1.5) 0
Nighttime Plankton Sampling
Rockingham 87.5 (46.7) 0.4 (<0.1) 87.5 (46.7)
Jones Creek 192.3 (68.2) 0.8 (0.1) 185.1 (70.6)
Cheraw 4.8 (3.6) 12.9 (4.3) 1.2 (1.2)
Society Hill 137.0 (61.3) 4.5 (0.6) 74.0 (45.1)
Creek site were young eggs, illustrating that fish had recently spawned just upstream of these sites. The highest density of young eggs occurred at the Jones Creek site; however, high den-sities also occurred at Rockingham and at Society Hill (Table 1). No American shad eggs were collected during the concurrent daytime plankton sampling at Rockingham and Jones Creek, thus preventing a direct comparison of egg densities during the two diel periods; however, the total egg density (all ages) and the density of young eggs were greater during nighttime sampling than during daytime sampling at both Cheraw and Society Hill. In general, few American shad eggs were collected at Cheraw regardless of the sampling period, and a mixture of young eggs and older eggs (>1.5 h old) was collected at Society Hill during daytime and nighttime sampling (Table 1).
Ninety-five percent of the 540 American shad eggs used for analysis were estimated by the deterministic model to have been spawned between rkm 145 and Blewett Falls Dam (rkm 303). The remaining 5% of eggs were estimated to have originated above Blewett Falls Dam and were excluded from analysis. The estimated average distance traveled by an American shad egg was 24 km (SE=1.5 km). The largest two peaks in the num-ber of American shad eggs were estimated to originate between rkm 285 and Blewett Falls Dam in the Piedmont, but a smaller peak was also detected between rkm 235 and 245 in the Coastal Plain and limited amounts of spawning in other reaches of the Coastal Plain were indicated (Figure 3). Two reaches with peaks in spawning occurred between the shoals below Jones Creek (hereafter, “Jones Creek shoals”) and Blewett Falls Dam and
TABLE 2. Average (SE in parentheses) temperature, dissolved oxygen (DO), water velocity, and depth and the dominant substrate types (secondary types in parentheses) at Pee Dee River locations where plankton tows were used to collect American shad eggs. Two plankton tows were completed at each location, and the exact sites of the tows were not the same on every date; thus, some sites have more than one substrate type indicated. Current velocity and depth cannot be used to evaluate habitat availability for the area because plankton tow sites were not selected in a completely random manner with respect to habitat. Sites are presented in order from upstream to downstream (see Figure 1).
Plankton tow site Temperature (◦C) DO (mg/L) Velocity (m/s) Depth (m) Substrate
Piedmont Region
Rockingham 20.63 (0.56) 7.84 (0.39) 0.47 (0.04) 2.27 (0.14) Boulder/bedrock (sand and coarse gravel) 74 Bridge 18.92 (0.96) 8.49 (0.41) 0.45 (0.04) 3.48 (0.29) Boulder/bedrock (gravel and cobble) Jones Creek 21.88 (0.51) 7.82 (0.27) 0.36 (0.04) 2.47 (0.12) Boulder/bedrock and gravel
Coastal Plain Region
Cheraw 20.53 (0.77) 8.32 (0.26) 0.51 (0.03) 4.11 (0.29) Sand (gravel) Society Hill 20.45 (0.70) 7.77 (0.27) 0.56 (0.03) 3.36 (0.31) Sand Cashua Ferry 20.02 (0.98) 7.79 (0.36) 0.67 (0.05) 3.88 (0.33) Sand (gravel) Route 301 20.09 (0.95) 7.87 (0.36) 0.59 (0.03) 3.85 (0.27) Sand Bluff 21.47 (0.80) 7.39 (0.37) 0.61 (0.04) 5.17 (0.29) Sand
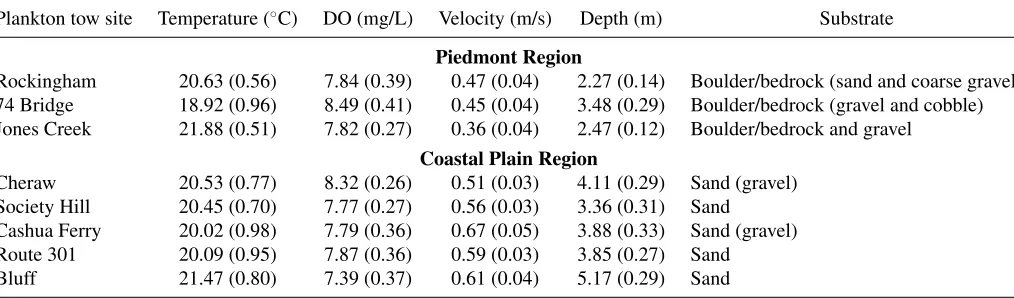
FIGURE 3. Spawning distribution of American shad in the Pee Dee River as indicated by the number of eggs (from plankton samples) estimated to originate from each 5-km reach (river kilometer [RKM] 130–303) based on deterministic and stochastic models. The origin of each egg (N=540 eggs) was estimated based on collection location, egg stage (h), water temperature (◦C), and water velocity (km/h). Stochastic simulations included random variation in stage, water temperature, and water velocity. Error bars represent the 95% confidence intervals from simulation replicates.
another one occured just upstream of Society Hill (Figures 1, 3). These three reaches included three of the four sites where night-time plankton sampling occurred: Rockingham, Jones Creek, and Society Hill—the only sites at which considerable numbers of young eggs were collected (Table 1).
The distribution and peaks of American shad spawning in the Pee Dee River were similarly described by both the deterministic and stochastic models (Figure 3). With the exception of the three defined peaks indicated by nighttime collections of young eggs (Figure 3, see above), the confidence limits for the other reaches generally overlapped and, with the exception of sites below rkm 160, did not include zero, suggesting the existence of spawning sites other than those indicated by the three peaks. However, the locations of additional sites and the magnitude of spawning at such sites are uncertain.
Radiotelemetry of Adults
We collected, radio-tagged, and released 26 male and 11 female American shad. Males averaged 427 mm in total length (SE=6.7), and females averaged 499 mm in total length (SE= 5.5). One male tagged at Jones Creek was only found once (the day after release) and was excluded from analysis. All other tagged fish (N=36) were relocated on two to nine dates between the release date and the end of May, resulting in a total of 223 relocations (Figure 4). Ninety-three percent of the relocations for tagged fish released at Rockingham occurred between Blewett Falls Dam and the shoal above the 74 Bridge (Figures 1, 4). Although tagged fish did enter the tailrace of Blewett Falls Dam, they were only found downstream of the spillway during a period of high flow when water was spilling over the dam (Figure 4). Eighty-nine percent of the relocations
for fish released at Jones Creek occurred between the shoals below the 74 Bridge (hereafter, “74 Bridge shoals”) and the Jones Creek shoals (Figures 1, 4).
Most American shad were relocated in close proximity to the tagging location (i.e., either Rockingham or Jones Creek; Figure 4). The average linear range of tagged adults was 3.6 rkm. American shad that were tagged at Rockingham moved less (average linear range=2.3 rkm) than those tagged at Jones Creek (average linear range=5.1 rkm;t=2.10,P=0.044); however, no differences in movement patterns were observed between males and females (t=0.458,P=0.650). There was very little overlap between the area used by American shad that were tagged at Rockingham and the area used by fish that were tagged at Jones Creek (Figure 4). More specifically, none of the American shad tagged at Jones Creek were relocated above the 74 Bridge shoals, and only two fish tagged at Rockingham were detected in or below those same shoals (one fish migrated downstream just after tagging, and the other fish remained near Rockingham until early May and then migrated downstream; Figures 1, 4); thus, overlap between the two tagging groups was minimal.
Although most American shad moved within the general area of the tagging location for the entire season, nine of the tagged fish (25%; 8 males and 1 female) appeared to make a directed movement downstream in May (Figure 5). Four of these fish were tagged at Rockingham, including one fish that moved down below the 74 Bridge shoals and remained there for a few weeks in May and three fish that were detected only a short distance downstream on the final tracking event (Figure 5). During the final tracking event, two of these three fish were manually detected in a deep area (pool) between the 74 Bridge
FIGURE 4. Manual relocations (N=223) of radio-tagged adult American shad in the Pee Dee River (rkm=river kilometer). Symbol type denotes the individual’s tagging location (dark triangles=Rockingham; white squares= Jones Creek), the location of the Blewett Falls Dam tailrace (black star), and the area below the dam’s spillway (black circle).
and the 74 Bridge shoals, an area that was not inhabited at other times during the season. The other five individuals that made directed downstream movements were tagged at Jones Creek (Figure 5). Four of the five fish were last found between a site just upstream of the North Carolina–South Carolina border and a site just upstream of Cheraw, while the other fish was found only a short distance downstream from its previous location (Figure 5). Of the 36 tagged American shad, 30 fish were relocated between Blewett Falls Dam and Cheraw during the last week of sampling in late May (15 fish tagged at Rockingham in early April; 15 fish tagged at Jones Creek in mid-April); therefore, tagged fish were manually detected in this area of the Pee Dee River for up to 47 d (Figure 5).
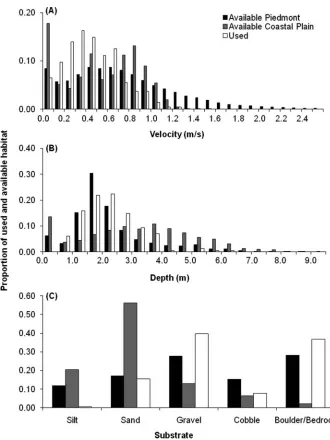
Most manual detections of tagged American shad were at water velocities between 0.10 and 0.69 m/s; manual detections peaked at the 0.30–0.39-m/s bin (Figure 6A). The average wa-ter velocity at manual relocations (average =0.44 m/s) was lower than the average predicted for both the Piedmont region
(average=0.73 m/s) and the Coastal Plain region (average= 0.55 m/s) of the Pee Dee River based on RHABSIM (Fisk 2010) for the discharge rates experienced by tagged American shad. Tagged fish were relocated in water velocities between 0.01 and 1.15 m/s but appeared to generally avoid available areas with water velocities greater than 1.0 m/s. Water velocities greater than 1.0 m/s were predicted to be more prevalent in the Piedmont region than in the Coastal Plain region (Figure 6A).
Tagged American shad were often relocated in areas with depths between 1.0 and 2.9 m, and most of the manual detections were made in areas with depths between 1.5 and 2.4 m (Figure 6B). The average depth at manual relocations was 2.2 m, which was the same as the average depth predicted for the Piedmont region (average=2.2 m) but lower than the average predicted for the Coastal Plain region (average=3.2 m) based on RHAB-SIM for discharge rates that occurred during manual tracking of tagged fish. The general distribution of depths occupied by American shad was similar to the distribution of depths avail-able in the Piedmont region. Depth in the Coastal Plain was predicted to be more variable than that in the Piedmont region, and the depth distribution included areas that were deeper than those predicted for the Piedmont region (Figure 6B).
Tagged American shad were most often relocated on either gravel or boulder/bedrock substrates and appeared to avoid ar-eas that were dominated by silt substrate (Figure 6C). The Piedmont region of the Pee Dee River was predicted to have somewhat similar proportions of all substrate classes and to have boulder–bedrock and gravel as the dominant substrates, whereas the Coastal Plain was predicted to contain predomi-nately sand substrate (Figure 6C).
Tagged American shad were manually detected at higher water velocities when discharge rates were higher (Figure 7). At low discharge rates (36.8–82.1 m3/s), water velocity use peaked in the 0.20–0.29-m/s bin. However, as discharge rates increased and as higher water velocities were predicted to be more prevalent in the Piedmont region, peak usage shifted to-ward higher velocities: the 0.40–0.49-m/s bin at discharge rates of 113.3–158.6 m3/s and the 0.60–0.69-m/s bin at discharge rates of 266.2–369.4 m3/s (Figure 7). Regardless of discharge rate and the predicted prevalence of water velocity levels, American shad appeared to generally avoid water velocities greater than 1.0 m/s (Figure 7). Similar results were observed for the distribution of American shad in relation to predicted depth levels at different discharge rates, but the results were less clear (Figure 8). Both availability and use of deeper habitats appeared to increase with rising discharge rates; however, American shad were generally relocated throughout the range of depths predicted to be avail-able, and the peaks were difficult to differentiate (Figure 8).
DISCUSSION
Our results demonstrate that American shad spawning in the Pee Dee River is concentrated in the Piedmont physiographic region, especially around Jones Creek. The highest abundances
FIGURE 5. Dates and sites (river kilometer [RKM]) of the manual relocations of adult American shad that were tagged at the Rockingham site (black lines and symbols; tagging date=8 April 2010) and Jones Creek site (gray lines and symbols; tagging date=21 April 2010) on the Pee Dee River. Tracking was completed weekly until the last week in May. Asterisks denote individuals that were perceived to make a downstream migration late in the season.
of young eggs (≤1.5 h old) were collected from that site during nighttime sampling, indicating that spawning had occurred very recently just upstream. Furthermore, the highest abundances of American shad eggs collected from various sampling sites were staged to have originated from that general area of the river. Relocations of radio-tagged adult American shad indi-cate that much of the area between the Jones Creek shoals and Blewett Falls Dam was used for spawning. Because we tagged American shad on the proposed main spawning grounds (i.e., at Rockingham), we were unable to fully evaluate the spawn-ing migration or the use of different areas of the river. How-ever, we did obtain information about movement patterns and small-scale habitat use by American shad while they inhab-ited a main spawning area. Results from tracking suggest that some specific areas were used more heavily than others, which may be a function of habitat differences within the Piedmont physiographic region and the habitat preferences of American shad.
Similar to observations of American shad spawning splashes (Layzer 1974; Ross et al. 1993; Beasley and Hightower 2000), American shad on spawning grounds in the Pee Dee River were most often observed in water velocities between 0.20 and 0.69 m/s. In comparison with available velocities, American shad selected for lower velocities (0.10–0.69 m/s) and avoided ve-locities greater than 1.0 m/s. American shad generally used the range of depths available in the Piedmont region, although they were mainly found in areas with depths between 1.0 and 2.9 m and selected against depths above 3.5 m. In other studies, tagged American shad and spawning splashes have been observed in
areas with slightly shallower waters, often between 1 and 2 m in depth (Ross et al. 1993; Hightower and Sparks 2003; Beasley and Hightower 2000). Differences between studies may be due to differences between river systems or to differences in the diel timing of sampling. We tracked fish during the day, but Amer-ican shad may move into different microhabitats for evening spawning events. Chittenden (1976) observed that American shad occupied more varied microhabitat and formed schools during the daytime, whereas at night the fish occupied shal-lower water (depths as low as 0.15 m), formed smaller groups, and produced splashes that were probably spawning splashes. Similarly, Layzer (1974) noted that some American shad moved into shallow water (depth=0.3–1.0 m) at night to spawn but that spawning behavior also occurred in deeper waters. General areas where tagged individuals were relocated in our study were used for spawning; however, the specific microhabitats used by the fish during daytime tracking could reflect resting habitat requirements.
American shad behavior and distribution were somewhat af-fected by flow rates. We observed individuals just downstream of the Blewett Falls Dam spillway but only when water was spilling and producing measurable flow in the area; to remain within certain ranges of velocity and depth, the fish altered their distributions slightly with changes in discharge rate. Small-scale movement patterns in response to flow changes from dams have been observed in other studies of regulated systems (Barry and Kynard 1986). However, tagged American shad remained in the same general areas regardless of water discharge rate, and as a result they were observed at higher water velocities and depths
FIGURE 6. Proportional usage and availability of habitat variables during all discharge levels experienced by tagged adult American shad:(A)water velocity, (B)depth, and(C)substrate type. Proportions of used velocity and depth were from manual relocations of tagged fish in the Piedmont region. Proportions of available habitat were calculated from the total amounts predicted by an RHABSIM model (Fisk 2010) based on discharge rates that occurred during manual tracking of tagged American shad.
when discharge rates were higher and when those habitat types were predicted to be more prevalent. We only sampled during one spawning season, so annual differences in behavior and mi-gration as a result of flow rate, velocity, and depth could not be evaluated; however, studies of other rivers indicate that the main spawning sites are apparently similar over multiple years (Layzer 1974; Hightower and Sparks 2003; Olney et al. 2006). American shad probably select a spawning site based on macro-habitat features (i.e., at a scale of meters to kilometers) but then alter their distribution at that site to remain in appropriate mi-crohabitats (point values for depth and velocity) when flow rates change.
The RHABSIM modeling by Fisk (2010) was valuable in that it allowed us to predict habitat availability (depth and ve-locity) at the discharge rates experienced by each tagged fish at the time of each manual relocation. This modeling made it pos-sible to evaluate changes in habitat use as a result of changes in flow rate, which is important in regulated systems like the Pee Dee River, where flows can change dramatically over a short period. Combining habitat modeling with movement patterns of tagged fish can produce a finer-scale understanding of habitat selectivity and fish behavior. With an understanding of habitat requirements, this modeling process can also be used to exam-ine potential effects of different flow rates on the amount of
FIGURE 7. Proportional usage and availability of velocities at four discharge ranges:(A)36.8–82.1 m3/s,(B)113.3–158.6 m3/s,(C)181.2–243.5 m3/s, and(D) 266.2–369.4 m3/s. Proportions used by American shad were from manual relocations of tagged adults in the Piedmont region. Proportions available were calculated from total amounts predicted for the Piedmont region by an RHABSIM model (Fisk 2010) based on discharge rates that occurred during manual tracking of tagged American shad.
habitat available to a species (Fisk 2010). Our results suggest that (1) regardless of habitat availability, American shad gener-ally remain within the same ranges of depth and water velocity; but (2) peak levels of use can change with changes in avail-ability. Similar to the work done by Fisk (2010), modeling the amount of available habitat for American shad at different flow rates has the potential to aid in the management of regulated river systems.
American shad may select the Piedmont region specifically for spawning because of the region’s larger and more diverse substrates. Although tagged American shad selected for certain depths and velocities, the occupied levels of these habitat vari-ables were common in both the Coastal Plain and Piedmont regions of the Pee Dee River. In fact, water velocities in the Coastal Plain were predicted by RHABSIM to be lower on av-erage than those in the Piedmont region and generally more
FIGURE 8. Proportional usage and availability of depths at four discharge ranges:(A)36.8–82.1 m3/s,(B)113.3–158.6 m3/s,(C)181.2–243.5 m3/s, and(D) 266.2–369.4 m3/s. Proportions used by American shad were from manual relocations of tagged adults in the Piedmont region. Proportions available were calculated from total amounts predicted for the Piedmont region by an RHABSIM model (Fisk 2010) based on discharge rates that occurred during manual tracking of tagged American shad.
closely resembled the velocities selected by tagged American shad, although depths in the Coastal Plain were also greater. However, the Piedmont is an area of higher gradient change, and the available substrate types are more diverse and generally larger in size than those in the Coastal Plain. More specifi-cally, main-channel habitat in the Piedmont region is dominated by irregular boulder and bedrock, and silt, sand, and gravel bars are often located near the sides of the channel. In
con-trast, most areas of the Coastal Plain are dominated by sand, although there are some areas where silt is prevalent and other areas (e.g., gravel bars) that possess larger substrates (Progress Energy 2006; Harris 2010). Other authors have observed that American shad spawning sites occur in higher-gradient areas with larger and more diverse substrates (especially areas domi-nated by gravel) when available (Beasley and Hightower 2000; Hightower and Sparks 2003; Bailey et al. 2004). Gravel bars
in the Pee Dee River are probably important spawning habitats for American shad and for other fish species (Progress Energy 2006; Fisk 2010).
Although most of the spawning by American shad occurred in the Piedmont region, eggs also originated from the Coastal Plain region. Plankton samples of young eggs and older eggs indicated that there was at least one spawning area just upstream of Society Hill. In contrast, both daytime and nighttime sam-ples suggested that spawning did not occur near Cheraw, the area of demarcation between the Piedmont and Coastal Plain regions in the Pee Dee River. Our plankton and tracking data indicate that there are multiple discrete spawning areas, which are presumably based on habitat. The observation of multiple discrete spawning sites within a river has been made for other American shad populations (Layzer 1974; Aunins and Olney 2009). Our daytime sampling only extended as far downstream as Bluff (rkm 129) and our nighttime sampling only occurred as far downstream as Society Hill (rkm 237), so additional spawn-ing sites potentially exist. Analysis of plankton samples did not yield estimates that were precise enough to identify the specific microhabitats used in the Coastal Plain. Multiple gravel bars and areas with larger substrates do exist in the Coastal Plain between Cashua Ferry and Society Hill (Progress Energy 2006; Harris 2010). For example, a gravel–cobble bar just upstream of Cashua Ferry is used for spawning by shortnose sturgeon Acipenser brevirostrum(Progress Energy 2006) and could potentially be used by spawning American shad as well. Alternatively, Amer-ican shad could be spawning on sand, as has been observed in rivers dominated by smaller substrate types (Williams et al. 1975; Bilkovic et al. 2002). Tagging and tracking of adults far-ther downstream in the Pee Dee River and collecting additional nighttime plankton samples at downstream sites would help to identify behavior, habitat use, and spawning in the Coastal Plain. Our results indicate that more accurate information about spawning site selection and spawning habitat is obtained by staging and estimating the origin of individual eggs than by characterizing habitat at collection sites. Most of the American shad spawning occurs between dusk and midnight (Leim 1924; Layzer 1974), so daytime sampling typically collects eggs that were spawned the previous night. Our collection of older eggs (>1.5 h old; some of which were>36 h old) in plankton samples indicates that some eggs travel in the water column for over a day. Marcy (1972) estimated that 91% of collected American shad eggs were younger than 14 h and had traveled 1.6–6.4 km from a spawning site. Because habitat characteristics at an egg collection site may be quite different from characteristics at a spawning location, a better understanding of spawning site and habitat selection can be obtained by estimating the origin of the eggs and examining the habitat in those spawning areas.
Because eggs collected at night are typically much younger than those collected during the day, plankton sampling at night can provide more precise information about spawning sites than daytime sampling. Random error in temperature and water ve-locity estimates will have a larger effect on the estimated origin
of an older egg than a younger egg. Our simulation results suggest that these random errors may obscure details in the spa-tial pattern of spawning but would be unlikely to mask primary spawning sites when young eggs are collected. Young eggs have also traveled only a short distance, which may reduce the effect of eggs settling out before reaching the sampling location. Chit-tenden (1969) observed that many stripped American shad eggs settled out in larger substrates about 1.5–1.8 m from the release site. Similarly, Layzer (1974) suggested that shallow areas with gravel or rubble substrates could increase egg retention on the bottom, whereas habitats with high or variable flows, deep wa-ters, or sandy substrates could increase the time for which the eggs remain in the water column.
The best survey approach for estimating the distribution of American shad spawning in a river system would be to conduct nighttime sampling at many evenly spaced sites. This type of sampling would not be possible in the Pee Dee River because of limited access and safety issues related to nighttime travel on a river that is difficult to navigate. The combination of daytime and nighttime sampling used here, along with the estimation of sites from which the eggs originated, may be a reasonable com-promise in such systems. One problem with daytime sampling is that eggs are missed because of the delay between spawning and sampling. For example, spawning just below Blewett Falls Dam was rarely detected by daytime sampling because we sam-pled after the eggs that were spawned during the previous night had moved downstream. We speculate that few of those eggs reached Cheraw because they fell out of the water column in the highly diverse habitat.
Movement patterns of adults also yield important information about the Pee Dee River population of American shad. As has been observed in other studies of regulated rivers (Hightower and Sparks 2003; Bailey et al. 2004), American shad migrated up to and spawned just below the downstream-most dam in the Pee Dee River system. Other American shad, however, occu-pied sites farther downstream throughout the spawning season, providing further evidence that multiple spawning sites exist in the Pee Dee River. Aunins and Olney (2009) observed three distinct areas of use in the James River, Virginia, and some of the tagged American shad did not migrate as far upstream as others. Similar to other studies, most American shad in the Pee Dee River remained in a discrete area for at least 20 d after they arrived on the spawning grounds (Beasley and Hightower 2000; Hightower and Sparks 2003; Olney et al. 2006; Aunins and Olney 2009). Movement between spawning areas has been detected in some studies (Olney et al. 2006; Aunins and Olney 2009) but was not observed here, possibly because fish were tagged on upstream spawning grounds instead of downstream habitats. American shad that were tagged at Rockingham had significantly smaller linear ranges than those that were tagged downstream at Jones Creek. Individuals that were tagged at Jones Creek moved both upstream and downstream, whereas fish that were tagged at Rockingham could only move a short distance upstream before reaching Blewett Falls Dam; thus,
the dam potentially restricted the upstream movement of some American shad. Although “fallback” was not noticeable dur-ing our study, collection and taggdur-ing procedures can result in altered behavior of American shad just after tagging (Beasley and Hightower 2000; Hightower and Sparks 2003; Bailey et al. 2004; Olney et al. 2006). We could not obtain the total duration for which individuals remained on the spawning grounds as we did not know how long the fish were there before tagging or how long they remained there after tracking ceased. Tagging of American shad farther downstream and installing fixed receivers to detect tagged fish at a variety of sites would help to eluci-date the percentages of American shad that spawn in different areas of the river and the total duration spent on the spawning grounds.
Our study presents important information on an unstudied population of American shad, thus improving our understanding of riverine habitat selection and potentially aiding in manage-ment. We used a combined approach of plankton sampling to collect American shad eggs and manual tracking to identify the locations of radio-tagged adults. These two methods are com-plementary and allow for a more complete evaluation of riverine habitat use, since plankton sampling in combination with egg staging is an effective method for identifying spawning sites over a large area and manual tracking provides small-scale in-formation on microhabitat use by adults. Although spawning was detected in the Coastal Plain, most spawning occurred in the high-gradient area below the terminal hydroelectric dam in the system; thus, Blewett Falls Dam is the upstream extent of migration and spawning by American shad in the Pee Dee River. It is possible that if given access, some American shad would migrate farther upstream and use additional habitat for spawn-ing. Research on the suitability of habitat upstream of Blewett Falls Dam and studies examining movement and spawning of tagged individuals there would reveal its potential as spawning habitat for American shad.
ACKNOWLEDGMENTS
We thank Jason Brown, Prescott Brownell, Patrick Cooney, John Crutchfield, Lindsey Garner, Ryan Heise, Brena Jones, Fritz Rohde, and Mike Swing for help with study design and fieldwork. We are grateful to Michael Fisk for contributing his expertise on the Pee Dee River, for helping with field research, and for reviewing an earlier draft of this document. We also thank Jay Holder for his comments on an earlier draft. This study was funded by the National Marine Fisheries Service (National Oceanic and Atmospheric Administration). The Co-operative Fish and Wildlife Research Unit is jointly supported by North Carolina State University, North Carolina Wildlife Resources Commission, U.S. Geological Survey, U.S. Fish and Wildlife Service, and Wildlife Management Institute. Any use of trade, product, or firm names is for descriptive purposes only and does not imply endorsement by the U.S. Government.
REFERENCES
Aunins, A., and J. E. Olney. 2009. Migration and spawning of American shad in the James River, Virginia. Transactions of the American Fisheries Society 138:1392–1404.
Bailey, M. M., J. J. Isely, and W. C. Bridges Jr. 2004. Movement and population size of American shad near a low-head lock and dam. Transactions of the American Fisheries Society 133:300–308.
Barry, T., and B. Kynard. 1986. Attraction of adult American shad to fish lifts at Holyoke Dam, Connecticut River. North American Journal of Fisheries Management 6:233–241.
Beasley, C. A., and J. E. Hightower. 2000. Effects of a low-head dam on the distribution and characteristics of spawning habitat used by striped bass and American shad. Transactions of the American Fisheries Society 129:1316–1330.
Bilkovic, D. M., C. H. Hershner, and J. E. Olney. 2002. Macroscale assessment of American shad spawning and nursery habitat in the Mattaponi and Pa-munkey rivers, Virginia. North American Journal of Fisheries Management 22:1176–7792.
Burdick, S. M., and J. E. Hightower. 2006. Distribution of spawning activity by anadromous fishes in an Atlantic slope drainage after removal of a low-head dam. Transactions of the American Fisheries Society 135:1290–1300. Chittenden, M. E. 1969. Life history and ecology of the American shad,Alosa
sapidissima, in the Delaware River. Doctoral dissertation. Rutgers University, New Brunswick, New Jersey.
Chittenden, M. E. 1976. Present and historical spawning grounds and nurseries of American shad,Alosa sapidissima, in the Delaware River. U.S. National Marine Fisheries Service Fishery Bulletin 74:343–352.
Cooke, D. W., and S. D. Leach. 2003. Beneficial effects of increased river flow and upstream fish passage on anadromous alosine stocks. Pages 331–338inK. E. Limburg and J. R. Waldman, editors. Biodiversity, status, and conservation of the world’s shads. American Fisheries Society, Symposium 35, Bethesda, Maryland.
Fisk, J. M. II. 2010. Reproductive ecology and habitat use of the robust redhorse in the Pee Dee River, North Carolina and South Carolina. Master’s thesis. North Carolina State University, Raleigh.
Freeman, M. C., C. M. Pringle, E. A. Greathouse, and B. J. Freeman. 2003. Ecosystem-level consequences of migratory faunal depletion caused by dams. Pages 255–266inK. E. Limburg and J. R. Waldman, editors. Biodiversity, status, and conservation of the world’s shads. American Fisheries Society, Symposium 35, Bethesda, Maryland.
Harris, J. E. 2010. Identification of American shad spawning sites and spawning habitat use in the Pee Dee River, North Carolina and South Carolina. U.S. National Marine Fisheries Service, Report NCCFWRU 2010-006, Raleigh, North Carolina.
Harris, J. E., and J. E. Hightower. 2010. Evaluation of methods for identifying spawning sites and habitat selection for alosines. North American Journal of Fisheries Management 30:386–399.
Harris, J. E., and J. E. Hightower. 2011. Movement patterns of American shad transported upstream of dams on the Roanoke River, North Carolina and Virginia. North American Journal of Fisheries Management 31:240–256. Hightower, J. E., and K. L. Sparks. 2003. Migration and spawning habitat of
American shad in the Roanoke River, North Carolina. Pages 193–199inK. E. Limburg and J. R. Waldman, editors. Biodiversity, status, and conservation of the world’s shads. American Fisheries Society, Symposium 35, Bethesda, Maryland.
Hightower, J. E., A. M. Wicker, and K. M. Endres. 1996. Historical trends in abundance of American shad and river herring in Albemarle Sound, North Carolina. North American Journal of Fisheries Management 16:257–271. Jones, P. W., F. D. Martin, and J. D. Hardy Jr. 1978. Development of fishes of the
mid-Atlantic bight, volume 1. Chesapeake Biological Laboratory, University of Maryland, Solomons.
Kilduff, P., W. C. Post, J. W. McCord, S. D. Leach, D. W. Cooke, and A. Kahnle. 2007. Status of American shad stocks in South Carolina river. Pages 383–453inAmerican Shad Stock Assessment, Stock Assessment Report
Number 07-01 (Supplement), VIII, Section 14. Atlantic States Marine Fish-eries Commission, National Oceanic and Atmospheric Administration Award Number NA05NMF4741025, Arlington, Virginia.
Layzer, J. B. 1974. Spawning sites and behavior of American shad,Alosa sapidissima(Wilson), in the Connecticut River between Holyoke and Turn-ers falls, Massachusetts, 1972. Master’s thesis. UnivTurn-ersity of Massachusetts, Amherst.
Leim, A. H. 1924. The life history of the shad,Alosa sapidissima(Wilson), with special reference to the factors limiting its abundance. Contributions to Canadian Biology and Fisheries 2:161–284.
Limburg, K. E. 1996. Growth and migration of 0-year American shad (Alosa sapidissima) in the Hudson River estuary: otolith microstructural analysis. Canadian Journal of Fisheries and Aquatic Sciences 53:220– 238.
Limburg, K. E., K. A. Hattala, and A. Kahnle. 2003. American shad in its native range. Pages 125–140inK. E. Limburg and J. R. Waldman, editors. Bio-diversity, status, and conservation of the world’s shads. American Fisheries Society, Symposium 35, Bethesda, Maryland.
Marcy, B. C. Jr. 1972. Spawning of the American shad, Alosa sa-pidissima in the lower Connecticut River. Chesapeake Science 13:116– 119.
Massman, W. H. 1952. Characteristics of spawning areas of shad,Alosa sa-pidissima(Wilson) in some Virginia streams. Transactions of the American Fisheries Society 81:78–93.
Olney, J. E., R. J. Latour, B. E. Watkins, and D. G. Clarke. 2006. Migratory behavior of American shad in the York River, Virginia, with implications for estimating in-river exploitation from tag recovery data. Transactions of the American Fisheries Society 135:889–896.
Pringle, C. M., M. C. Freeman, and B. J. Freeman. 2000. Regional effects of hydrologic alterations on riverine macrobiota in the new world: tropical-temperate comparisons. BioScience 50:807–823.
Progress Energy. 2003. Yadkin-Pee Dee River project, initial consultation docu-ment. Federal Energy Regulatory Commission, Number 2206, Raleigh, North Carolina.
Progress Energy. 2006. Yadkin-Pee Dee River project, application for license. Federal Energy Regulatory Commission, Number 2206, Raleigh, North Car-olina.
RHABSIM (Riverine Habitat Simulation). 1998. Riverine habitat simulation software, version 2.0. Thomas R. Payne and Associates, Arcata, California. Ross, R. M., R. M. Bennet, and T. W. H. Backman. 1993. Habitat use by
spawning adult, egg, and larval American shad in the Delaware River. Rivers 4:227–238.
Schilt, C. R. 2007. Developing fish passage and protection at hydropower dams. Applied Animal Behaviour Science 104:295–325.
Shardo, J. D. 1995. Comparative embryology of teleostean fishes. I. Devel-opment and staging of American shad,Alosa sapidissima(Wilson, 1811). Journal of Morphology 225:125–167.
Weaver, L. A., M. T. Fisher, B. T. Bosher, M. L. Claud, and L. J. Koth. 2003. Boshers Dam vertical slot fishway: a useful tool to evaluate American shad recovery efforts in the upper James River. Pages 339–347inK. E. Limburg and J. R. Waldman, editors. Biodiversity, status, and conservation of the world’s shads. American Fisheries Society, Symposium 35, Bethesda, Maryland. Williams, R. O., W. F. Grey, and J. A. Huff. 1975. Anadromous fish studies
in the St. Johns River. National Oceanic and Atmospheric Administration, National Marine Fisheries Service, Completion Report for Project AFCS-5, St. Petersburg, Florida.
![FIGURE 3.Spawning distribution of American shad in the Pee Dee River as indicated by the number of eggs (from plankton samples) estimated to originatefrom each 5-km reach (river kilometer [RKM] 130–303) based on deterministic and stochastic models](https://thumb-us.123doks.com/thumbv2/123dok_us/1496004.1183183/8.612.126.487.65.274/distribution-american-indicated-estimated-originatefrom-kilometer-deterministic-stochastic.webp)

![FIGURE 5.Dates and sites (river kilometer [RKM]) of the manual relocations of adult American shad that were tagged at the Rockingham site (black lines andsymbols; tagging date = 8 April 2010) and Jones Creek site (gray lines and symbols; tagging date = 21](https://thumb-us.123doks.com/thumbv2/123dok_us/1496004.1183183/10.612.129.486.71.309/figure-kilometer-relocations-american-rockingham-andsymbols-symbols-tagging.webp)