INVESTIGATION
High-Resolution Speci
fi
city from DNA Sequencing
Highlights Alternative Modes of Lac
Repressor Binding
Zheng Zuo and Gary D. Stormo1
Department of Genetics and Center for Genome Sciences and Systems Biology, Washington University School of Medicine, St. Louis, Missouri 63108-8510 ORCID ID: 0000-0001-6896-1850 (G.S.)
ABSTRACTKnowing the specificity of transcription factors is critical to understanding regulatory networks in cells. The lac repressor– operator system has been studied for many years, but not with high-throughput methods capable of determining specificity compre-hensively. Details of its binding interaction and its selection of an asymmetric binding site have been controversial. We employed a new method to accurately determine relative binding affinities to thousands of sequences simultaneously, requiring only sequencing of bound and unbound fractions. An analysis of 2560 different DNA sequence variants, including both base changes and variations in operator length, provides a detailed view of lac repressor sequence specificity. Wefind that the protein can bind with nearly equal affinities to operators of three different lengths, but the sequence preference changes depending on the length, demonstrating alternative modes of interaction between the protein and DNA. The wild-type operator has an odd length, causing the two monomers to bind in alternative modes, making the asymmetric operator the preferred binding site. We tested two other members of the LacI/ GalR protein family andfind that neither can bind with high affinity to sites with alternative lengths or shows evidence of alternative binding modes. A further comparison with known and predicted motifs suggests that the lac repressor may be unique in this ability and that this may contribute to its selection.
T
HE lactose regulatory system established the paradigm ofatrans-acting factor binding to a cis-acting element to regulate the expression of the adjacent gene in response to an environmental signal (Jacob and Monod 1961). Many aspects of the lac repressor protein have been studied ex-tensively (reviewed in Lewis 2005). Our primary interest is in the DNA binding specificity of the lac repressor.
Measure-ments of affinity changes due to operator sequence
varia-tion, by base replacement, by the use of base analogs, or by changing the length of the operator, have been performed
almost since the operator sequence was first determined
(Goeddel et al. 1978; Sadler et al.1983; Betz et al.1986;
Sartoriuset al.1989; Lehminget al.1990; Sasmor and Betz
1990; Frank et al. 1997; Spronk et al. 1999; Falcon and
Matthews 2001; Kalodimos et al.2002, 2004b; Daber and
Lewis 2009). But those analyses all measured binding affi n-ity to only a few sequences.
The lac repressor has not, to our knowledge, been an-alyzed by current high-throughput methods that can
de-termine specificity over thousands, or even millions, of
sequences in parallel (Stormo and Zhao 2010), such as
protein-binding microarrays (PBM) (Bergeret al.2006;
Gor-danet al.2013), SELEX-seq [or HT-SELEX (Zhaoet al.2009; Zykovichet al.2009; Jolmaet al.2010; Wonget al.2011)],
bacterial one-hybrid (B1H) (Meng et al.2005; Noyeset al.
2008; Christensen et al. 2011), and mechanically induced
trapping of molecular interactions (MITOMI) (Maerkl and Quake 2007). While those methods offer an expansive over-view of binding specificity, the accuracies of the resulting models are highly variable. This can be due to low-quality data, but even with highly reproducible experiments specifi c-ity determination requires complex computational modeling
(Stormo 2013; Weirauchet al.2013; Orenstein and Shamir
Copyright © 2014 by the Genetics Society of America doi: 10.1534/genetics.114.170100
Manuscript received August 21, 2014; accepted for publication September 6, 2014; published Early Online September 9, 2014.
Supporting information is available online athttp://www.genetics.org/lookup/suppl/ doi:10.1534/genetics.114.170100/-/DC1.
Sequence data from this article have been deposited with the NCBI GEO database under accession no. GSE61223.
2014) and the results can vary considerably, depending on the method used and the protein being analyzed, including their ability to predict in vivobinding site locations (see Weirauch
et al.2013 for a comparison of many different approaches to the analysis of PBM data for many different transcription factors).
Here we introduce a new high-throughput method, Spec-seq, that directly measures specificity by sequencing. It has several advantages over existing methods for quantifying large collections (thousands) of binding site energies in one experiment. Using lac repressor as an example, we show that this method has excellent reproducibility, giving energy
measurements generally consistent within0.1 kT (k is the
Boltzmann constant and T is temperature in degrees kelvin; at 0 degrees C, 1 kT = 0.54 kcal/mol). While not measuring in parallel as many different sequences as some of the higher-throughput methods, we obtain high accuracies be-cause we measure exactly what is necessary, the relative affinity to a large collection of sequences, without any math-ematicalfitting procedures or approximations required. It is similar to MITOMI in the number of different sites that can be analyzed in parallel, but it is much simpler to perform, requiring only a means to separate bound and unbound sequences, which are then sequenced using high-throughput, short-read sequencing machines.
When applied to the lac repressor we obtain, in a single experiment, data covering a large fraction of all the previous studies, plus thousands of additional variants, allowing us to compile a much more comprehensive profile of its specificity.
We confirm that the lac repressor can bind to sites of
different lengths but that the preferred sequence, and the mode of binding, depends on the length. We also applied Spec-seq to two other members of the LacI/GalR protein family, PurR and YcjW, to obtain extensive models of their specificity and test the generality of the lac repressor’s ability to bind to operators of variable length. Wefind that the lac repressor is apparently unique in its ability to bind with high affinity to sites of different lengths and with different modes of binding.
In addition to generating extensive data sets of the specificity of particular proteins, the high-throughput meth-ods allow for assessments of the accuracies of simple models, such as position weight matrices (PWMs). The ear-liest theoretical analyses of binding specificity assumed that each position contributed independently (additively) to binding affinity and that each variation from the preferred sequence had the same energetic cost (Von Hippel 1979; von Hippel and Berg 1986). As data accumulated showing that variations at different positions had different effects on binding, PWM models were developed to accommodate
position-specific costs (reviewed in Stormo 2000; Stormo
2013), but those models still assume additivity. Quantitative analyses subsequently found that, while additivity is often violated (e.g., Stormo et al. 1986; Frank et al. 1997; Man
and Stormo 2001; Bulyk et al. 2002; Maerkl and Quake
2007; Zhao et al. 2012; Weirauch et al. 2013), it is often
a surprisingly good approximation (Sarai and Takeda 1989;
Takeda et al. 1989; Benos et al. 2002; Zhao et al. 2012;
Weirauchet al.2013), indicating that the average effect of each variant, which is captured in the PWM, is similar in most contexts.
Deviations from additivity are often rather modest,,0.5 kT between observed and predicted binding energies, so the
data from high-throughput experiments may not be suffi
-ciently accurate to distinguish between models. Spec-seq provides quite accurate relative binding energies, usually
within0.1 kT, allowing us to make reliable determinations
of nonadditive contributions. Recent analyses of high-through-put data sets have explicitly considered higher-order models to account for nonadditive contributions (Slattery et al. 2011; Zhaoet al.2012; Weirauchet al.2013; Orenstein and Shamir 2014) and they are beginning to populate motif repositories such as JASPAR (Mathelier and Wasserman 2013; Mathelier
et al.2014).
A separate issue is whether proteins can bind DNA in multiple modes, binding in two (or more) distinct ways, so that the specificity cannot be captured with a single PWM or even a higher-order model. A classic example is SREBP1, a basic helix-loop-helix (bHLH) protein that can bind either in a standard antiparallel mode to an E-box motif or in an alternative parallel mode to a quite distinct motif (Kimet al.
1995; Parragaet al.1998). One recent article suggested
mul-tiple modes of binding are quite common (Badiset al.2009)
but further analyses of the same and similar data sets sug-gested that good PWMs can be found for most proteins and that multiple modes of binding are relatively rare (Zhao and Stormo 2011; Weirauchet al.2013). Structural studies of the lac repressor bound to the wild-type operator have yielded conflicting results. X-ray crystallography shows the two mono-mers binding in nearly identical conformation whereas NMR studies show the right monomer binding in an extended con-formation (Bell and Lewis 2001; Kalodimoset al.2002, 2004b; Lewis 2005). From our quantitative data it is clear that the lac repressor binds in alternative modes that depend on the length of the binding site and that the asymmetry of the wild-type operator is not merely tolerated, but is actually the preferred sequence for sites with an odd length.
Materials and Methods
Theory for high-throughput determination of relative affinities
The binding of a protein,P, for a particular DNA sequence,
Si, is represented by the reaction diagram PþSikon
koff PSi:
KAðSiÞ ¼
kon
koff ¼
½PSi ½P½Si;
(1)
where inside the brackets, [. . .] refers to concentrations. If multiple different DNA sequences compete for the same pool of proteins, their relative affinities (the ratios of theirKA) can be determined by measuring the concentrations of each sequence in the bound and unbound fractions without mea-suring the free protein concentration, which is usually the most difficult quantity to measure accurately:
KAðS1Þ:KAðS2Þ:::::KAðSnÞ ¼½PS1 ½S1 :
½PS2
½S2 :::::
½PSn ½Sn :
(2) Current sequencing technology allows us to determine those concentration ratios for thousands of possible binding sites in parallel and therefore to determine the relative binding
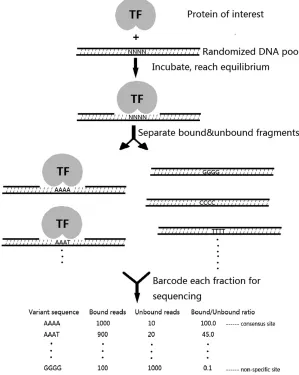
affinity, or equivalently the differences in binding free
energy, for the entire collection of sequences in one experiment, producing a detailed specificity profile for the protein of interest. To be explicit, Equation 2 states that the ratios of concentrations in the bound and unbound fractions are equivalent to the ratios of binding constants, but we do not need to determine absolute concentrations, only their ratios that can be obtained directly from sequencing, as diagrammed in Figure 1. After separating the bound and unbound fractions the DNA from each fraction is barcoded and sequenced on an Illumina MiSeq from which we obtain
a certain number of counts for each sequence, Nb in the
bound fraction and Nu in the unbound fraction. Provided
we have enough counts in each fraction, we can accurately estimate the ratios of the concentrations from those counts, which for the basis of the Spec-seq method are
½PSi ½PSj
NbðSiÞ NbðSjÞ;
½Si ½Sj
NuðSiÞ NuðSjÞ: Therefore
KAðSiÞ
KAðSjÞ¼ ½PSi ½PSj
½Sj ½Si
NbðSiÞ NbðSjÞ
NuðSjÞ NuðSiÞ:
(3)
From a clean separation into bound and unbound fractions, the accuracy of the relative affinities is limited only by the accuracy of the count ratios. By obtaining hundreds to thousands of counts of each sequence in each fraction we
derive very highly reproducible relative affinity values.
The raw counts and ratios for each sequence in each
experiment described below are available in Supporting
Information, Table S1. The natural logarithms of those ratios are the relative (differences in) free energies of
binding in units of kT (T = 273°K in these experiments).
Setting the relative free energy of the preferred site to 0, all of the relative free energies are provided in Table S2.
An expanded description of the theoretical justification
for Spec-seq and a comparison with standard methods for determining association constants is provided in File S1.
Library design and preparation
Using known, or predicted, consensus binding sites of
transcription factors, we randomize specific positions,
using degenerate oligonucleotides. To ensure the shifted fractions of DNA binding sites are visible under the fl uores-cent imager, no more than five positions in each library are randomized.
To make double-stranded DNA (dsDNA) libraries, 100 pmole single-strand degenerate template oligos were mixed with an equal amount of FAM-labeled reverse complement primer (PE2). In the presence of Taq Polymerase, brief 10-sec denaturing followed by 10 min of 55°annealing/extension is
sufficient to make dsDNA libraries. Because any unextended
single-stranded DNA (ssDNA) could contaminate the unbound
band, the reaction mix was digested by 1 ml NEB Exo I
exo-nuclease (New England Biolabs, Beverly, MA) for 30 min. All
final DNA products were purified by QIAGEN (Valencia, CA)
PCR purification columns. Sequences of all designed oligos and primers are provided inFile S1.
Protein expression and purification
We have used two methods for obtaining the proteins used
in Spec-seq. In one, Escherichia coli strain BL21(DE3) was
induced by IPTG for 2 hr to express the His-tagged protein of interest from a plasmid with an upstream T7 promoter. TALON His-Tag resin (Clontech) was then employed to pu-rify the C-terminal tagged protein of interest.
Alternatively, in vitro protein expression can be used.
Twenty-five microliters NEB PURExpress system containing
100 ng PCR product of linear DNA construct encoding the protein with an upstream T7 promoter was run for 2 hr at
37°. Since all the existing protein components in the NEB
system carry a His tag, it is possible to reverse purify the
synthesized protein without any specific tag and further
concentrate it by an Amicon (Danvers, MA) centrifugalfilter. After reverse purification, protein concentration was esti-mated by Protein A280 (NanoDrop) and showed consistent
values as expected from NEB PURExpress specification
(100 ng/ml).
Bound and unbound DNA separation for sequencing
All binding reactions were done in 13NEBuffer 4 (50 mM
potassium acetate, 20 mM Tris-acetate, 10 mM magnesium acetate, 1 mM DTT, pH 7.9) supplemented with 5% glyc-erol, and the purified protein of interest (LacI, PurR, and YcjW) was sequentially titrated into a 15-ml binding reaction system by twofold increase per lane, starting at50 ng. For
LacI this is 80 nM of monomer, well above the KD for
tetramerization of 5 nM (Royer et al.1990), so we expect
binding to tetramers and we observe only one bound band.
For the PurR protein guanine was included at 20 mM. At
state of protein–DNA interaction. All EMSA experiments
were run in 6% 0.53TBE PAGE gels at 120 V for 30 min
in the cold room. The DNA reaction mix was added to a run-ning gel to hasten entry of the DNA into the gel matrix.
59-FAM-labeled DNA fragments can be visualized by a
Bio-Rad (Hercules, CA) Imager with a 520-nm bandpass filter
(Figure S1). Shifted and unshifted bands were cut, including all of the visible bands and somewhat above and below them; extracted; and purified separately, using acrylamide gel ex-traction buffer and QIAGEN PCR columns. Each fraction of
DNA was barcoded and amplified, respectively, by
indexed-Illumina primers (PE1-Genetics1/2, PE2.0). To minimize pos-sible PCR bias, we recommend no more than 10 cycles of am-plification (although in independent tests we found very minimal PCR bias).
For typical randomized DNA libraries with diversity up to 2000, a standard 1x75 Miseq run is sufficient to produce 15 million reads covering all possible variants with sufficient counts to get reliable ratios. Each read is sorted according to its barcode and binding site content. All sequences with variations in the conserved regions arefiltered out. For each unique var-iant in the library, the ratio between bound reads and unbound
reads is calculated and designated as relative binding affinity, compared to the preferred sequence, as described above. All sequence data are available from the NCBI Gene Expression Omnibus (GEO) database under accession no. GSE61223.
Given the relative affinity/binding energy values of all variants, linear regression can produce an energy matrix [as
a PWM (Stormo et al. 1986)], which can be visualized in
logo form. Often variants with more than two mismatches will saturate to the nonspecific plateau level, so we use those variants with no more than two mismatches to the consen-sus site for regression analysis. We can then assess thefit of that PWM to the entire distribution as well as to just those sequences used to obtain the PWM.
Results
Relative affinities of lac operator variants
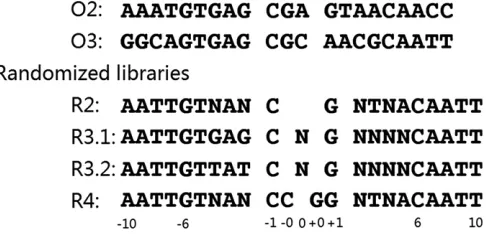
Figure 2 shows the sequence of the lac operator,O1, which
overlaps the promoter for thelacZYAoperon and controls its
expression, as well as the other two accessory operatorsO2
and O3. All three operator sequences are approximately
a dimer of dimers) repressor. We focus on the central 11 bp
ofO1that contains the asymmetric positions
T G A G C G G A T A A:
We divide the sequence into a central 3-bp“spacer”and two
flanking 4-bp regions that we refer to asLfor the left half-site
(TGAG) and Rfor the right half-site (ATAA). The underlined
bases are asymmetric about the central G, which must be asymmetric. Figure 2 also shows the libraries of randomized sequences included in this study with spacer lengths from 2 to 4 bp (R2 to R4). To facilitate the comparison of different
sequences, we number those 11 positions from25 to +5 with
0 being the center of the 3-bp spacer (Figure 2). Operators with 2-bp spacers omit the 0 position, while operators with 4-bp spacers contain two 0 positions (referred to as 20 and +0). The R2 library deletes the central G to create a symmetric 2-bp spacer and randomizes the other underlined bases (24, 22, +2, +4) to include all 256 possible binding site sequences at those variable positions. The R4 library inserts a C before the central G to make a symmetric 4-bp spacer and also randomizes the other underlined bases to include all 256 possible binding sites at those variable positions. The R3.1 and R3.2 libraries maintain the 3-bp spacer length of the wild-type operator but randomize the central base and also all 4 bases of one of the half-sites,Rin R3.1 andLin R3.2. These libraries each contain 1024 different binding site sequences. These four randomized libraries were combined in a single binding reac-tion with the lac repressor. This allows us to determine relative binding affinities (and free energies) for all of the 2560 var-iants, both within each library and between libraries.
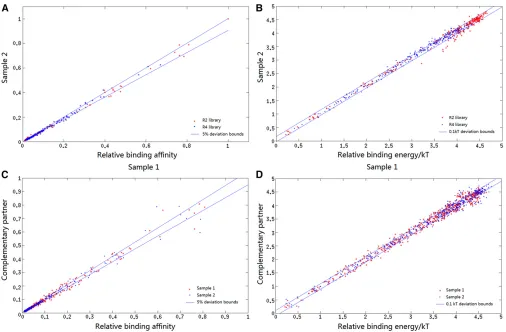
Figure 3A demonstrates the reproducibility of the method, where the relative ratios of all sequences in the R2 and R4 libraries are shown for two different binding reactions with twofold differences in repressor concentration; the pointsfit a straight line withr2= 0.996 and nearly all of the replicate
ratios are within 5% of the mean. Figure 3B shows the same data transformed to show binding free energy differences compared to the best binding sequence (with free energy defined as 0), demonstrating that most replicates are within
0.1 kT of each other, although there is a bit more variance among the low-affinity (high-energy) sites.
An alternative way to estimate our measurement re-producibility is to compare those ratio differences between complementary variants. For example, if the four random positions of an R2 sequence are AAAA, then the sequence TTTT contains the same binding site in the opposite orientation. For each of the R2 and R4 libraries there are 120 pairs of complementary sequences, after excluding 16 self-complementary sites. The ratios for each identical pair for each library and in both experimental conditions (from Figure 3A) are plotted in Figure 3C and their free energies in Figure 3D. Again nearly all of the ratios are within 5% and energy differences are mostly within 0.1 kT, but with some-what higher variance for the low-affinity sites. The entire list of all site counts in both the bound and unbound fractions,
and their ratios, from each experiment is provided inTable
S1. We define the relative free energy of the highest-affinity site to be 0, and the differences in free energy for all of the remaining 2559 binding sites are included inTable S2, orga-nized by library. The total range of binding free energy is5.4 kT between the highest- and lowest-affinity sites. It should be noted that this is substantially less than the difference in bind-ing free energy between a high-affinity operator and complete nonspecific binding of the lac repressor because all of our randomized sites contain many matches to the preferred bind-ing site. Every site contains the preferred outer positions210 to26 and +6 to +10, and every site contains at least 16 of the preferred bases in each library and at most five mismatches. These data give us a comprehensive view of the contributions to specificity from the central portion of the binding sites, the region that is asymmetric in the wild-typeO1operator.
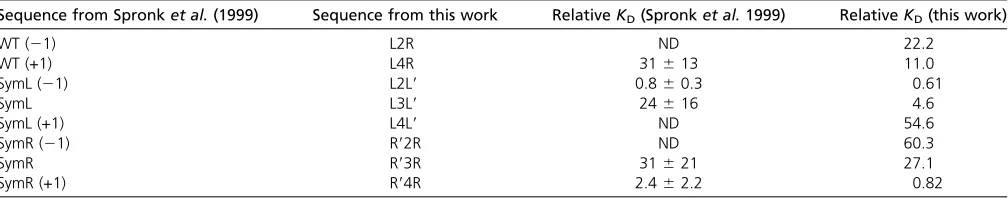
Figure 3 demonstrates the precision of Spec-seq, showing the highly reproducible values obtained from independent experiments with different conditions. To assess the accu-racy of Spec-seq we compare its results to published values of the specificity of the lac repressor. Spronket al. (1999) measured binding affinities to nine binding sites that overlap our set, including variants of both sequence and spacing. They used a standard approach of measuring the fraction of DNA bound, in an EMSA gel, at different protein con-centrations andfitting the results to a binding curve, as in
Equation 1. Table 1 shows their calculated relative KD’s
(the reciprocal ofKA) compared to theO1operator and the
results obtained from Spec-seq. For three sequences they
were unable to determine the binding affinity because they
failed to reach saturation in the binding curves; those three
sequences are among the four lowest-affinity sequences in
on and off ratesin vivoreport the relative affinity (ratios of
on/off rates) betweenO1and the 2-bp symmetry operator
that is nearly identical to our measured value (0.61vs.0.51)
(Hammaret al. 2014). Taken together these results indicate
that Spec-seq can provide highly precise and accurate measure-ments of relative affinity for thousands of sequences in parallel.
Lac repressor binding models
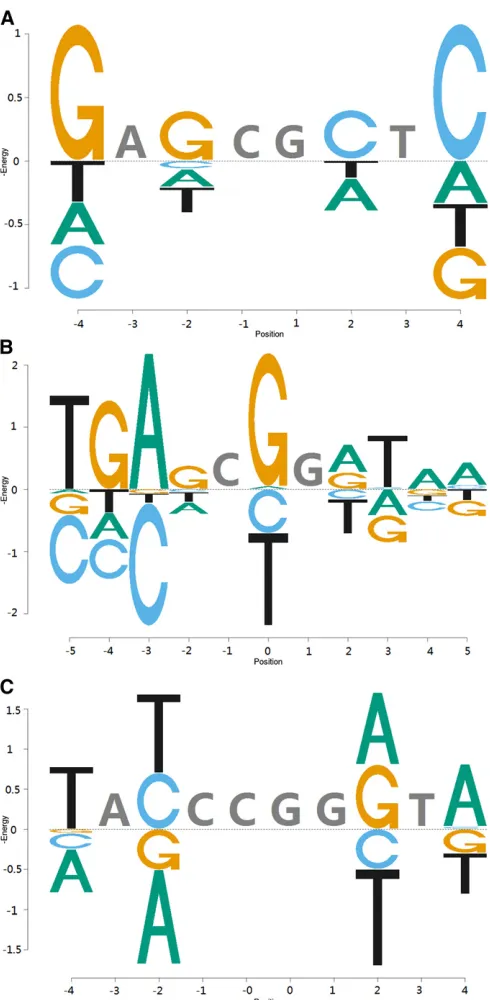
Figure 4 shows energy logos (Foatet al. 2006; Zhaoet al.
2012) for each class (2-, 3-, and 4-bp spacers) of random-ized library where the energy values are from the single-base variants from the preferred binding site sequence
(energy matrices are inFigure S2). For the 2-bp CG spacer
the preferred binding site is symmetric, with both half-sites the same asL(we refer to this binding site asL2L9, whereL9
indicates the complement of L). This site was previously
shown to have higher affinity thanO1(Sadleret al.1983)
and is, in fact, the highest-affinity binding site in the entire collection. Changes from the preferred base to any of the other bases cost0.5 kT at the inner positions (22, +2) and 1.4 kT at the outer positions (24, +4). The lowest-affinity
sites in the 2-bp library have 5.1 kT higher free energy
than the preferred site.
The preferred binding site for the 4-bp CCGG spacer library is also symmetric, but now both half-sites are the same asR(the site isR94R). That site has a free energy0.3 kT above that ofL2L9. For this operator changing the T/A at
positions 22/+2 to C/G costs only 0.2 kT, whereas
changes to G/C cost 1.4 kT and those to A/T cost 2.1
kT. Changes at the outer positions,24/+4, all cost between 0.8 and 1.3 kT. The lowest-affinity sites have energies 4.5 kT higher than that ofR94Rfor this library. The distinct differ-ences in preferred binding sites between the 2- and 4-bp libraries demonstrates that the protein binds in alternative modes, depending on the distance between the half-sites. The binding energies are nearly the same and both preferred sites are symmetric but the base preferences differ such that operators with a 2-bp spacer prefer two copies of theL half-site and those with a 4-bp spacer prefer two copies of theR half-site.
The preferred binding site for the 3-bp spacer libraries is
the same asymmetric site as that of the wild-type O1
Figure 3 Consistency of relative affinity and energy measurements. (A) Bound/unbound ratios, normalized to highest value, for the R2 and R4 libraries from two independent experiments with different protein concentrations. The horizontal axis is the value from thefirst experiment and the vertical axis is the value from the second experiment. Lines indicate deviations of 5% from the perfect match in the two experiments (r2.0.99). (B) The negative
natural logarithms of the data in A. The lines represent differences of 0.1 kT. (C) From both experiments from A, the normalized bound/unbound ratio of each sequence with its complement is shown. Self-complementary sequences are excluded (r2.0.99). (D) The negative natural logarithms of the data
operator, L3R, consistent with the results from the 2- and 4-bp libraries. The center is defined by the CG at positions
21/0, where the lac repressor hinge helix interacts with
the minor groove (Kalodimos et al. 2004a; Lewis 2005),
and the preferred site is asymmetric with each half-site pre-ferring the sequence that corresponds to its distance from the center. The binding energy to this preferred site is0.5 kT higher than toL2L9. Changing the central G to any other base greatly reduces the affinity. Changing the G to A costs
2.1 kT, to C costs 2.9 kT, and to T costs 3.6 kT.
Changes to L at positions 22 and 24 are very similar to
those observed in the L2L9operator. This library also
con-tains changes to positions23 and25 that are somewhat
more costly than to positions22 and24, consistent with
them being more conserved among the three wild-type oper-ators (Figure 2). Changes toRat positions 2 and 4 are also similar to those observed inR94R, although most of the costs
are somewhat diminished. Changes to R at position 3 are
more costly than to the other positions. The total range of energies between the highest- and lowest-affinity sites forL variants is 4.8 kT, whereas forRvariants the range is only 3.9 kT. In general variations inRare less costly than those in L, consistent withL’s greater conservation and the fact that
most of the O1 mutations obtained in genetic screens for
inactive operators altered positions in theLhalf-site (Gilbert
et al.1975; Betzet al.1986).
Figure 5 shows the 10 possible combinations ofLandR
with each of the three spacings and lists the measured rel-ative binding free energy to each one (9 of these, all but R93L9, were analyzed by Spronket al.1999 and are listed in
Table 1). The configuration L2L9 has the lowest energy
(highest affinity) of all of the operators tested, which we define to be 0 relative free energy. The next-lowest energy combination is R94Rwith a relative free energy of 0.3 kT.
The wild-type operator O1, L3R, is the next lowest with
a relative free energy of 0.5 kT. The other 7 operators all have considerably larger free energies, between 1.9 and 4.6 kT, demonstrating that the preference for theLorRhalf-site depends on the distance from the CG in the spacer.
Figure 6 plots the relative free energies for all of the variants to L and R for each library compared to the pre-dicted energy, assuming additive contributions of the single variants. The symbol used for each point indicates the num-ber of variant positions it contains compared to the preferred
sequence for that library. For libraries R2 and R4 (Figure 6, A and B), sites with two variants are further distinguished as to whether the variants are on the same, or opposite, half-sites. Several features of the plots are immediately obvious. One is that for each library there is a plateau in binding energy such that adding more variants no longer increases the binding energy and many different sequences have es-sentially the same energy. For the R2 and R3.2 libraries that
each vary the Lhalf-site (Figure 6, A and C), that plateau
occurs at5 kT. For the R4 library (Figure 6B) the plateau is
at 4.5 kT, which is only 4 kT above the preferred
se-quence,R94R, for that library. The difference in these energy wells indicates the more favorable contacts made between the repressor and theLhalf-site compared to theRhalf-site. The R3.1 library (Figure 6D) shows a wide dispersal of en-ergies between 2 and 4 kT for a large variety of sequences. The difference between the R4 and R3.1 libraries, which both vary theR half-site, is due to the additional positions that are varied in the R3.1 library (3 and 5). If one considers only variations at positions 2 and 4, which are varied in R4, then the two plots are much more similar. The R3.1 plot indicates that the protein can accommodate many different sequences so that the total energy cost is in the range of 2–4 kT, often much less than the sum of the individual variants. The Figure 6 plots allow us to assess the additivity ap-proximation, which assumes that binding energy contribu-tions from individual base variants can be summed to obtain the energy of the multivariant binding sites. If the protein binds to its sites in a perfectly additive fashion, then all the variants would fall on the diagonal straight lines of Figure 6. We expect additivity to be violated at the high-energy pla-teau, but it is often observed that additivity is a reasonably good approximation at lower energies (Sarai and Takeda
1989; Takeda et al. 1989; Benos et al. 2002; Zhao and
Stormo 2011; Stormo 2013; Weirauchet al.2013).
Surpris-ingly, for library R2 all of the multivariant sites (with two minor exceptions among high-energy sites) have higher measured binding energy than predicted from the single
variants, often .1 kT higher than predicted. One might
expect that the sum of individual energies would set an upper bound on the combined energy and that the protein may compensate in some way for the multiple variants to have a somewhat lower energy than the sum. This is ob-served in the bHLH proteins (Maerkl and Quake 2007) Table 1 RelativeKDcomparison to published values
Sequence from Spronket al.(1999) Sequence from this work RelativeKD(Spronket al.1999) RelativeKD(this work)
WT (21) L2R ND 22.2
WT (+1) L4R 31613 11.0
SymL (21) L2L9 0.860.3 0.61
SymL L3L9 24616 4.6
SymL (+1) L4L9 ND 54.6
SymR (21) R92R ND 60.3
SymR R93R 31621 27.1
SymR (+1) R94R 2.462.2 0.82
where essentially all of the multivariant sites had lower energy than predicted from additivity. In the R3.2 library nearly all of the sites with two or more variants have greatly increased energy, at least 3 kT, but there are ones that are both above and below the predicted energy because of the large effects of some of the single variants. Library R4 is
similar with both over- and underpredicted energies, but many more of the multivariants have reasonably low energy. As described above, the R3.1 library has a wide dispersal of binding energies over the entire range of variants, including both under- and overpredictions. This suggests the protein can make favorable contacts with many different sequences when all four positions ofR are varied.
The Figure 6 plots use the single-variant energies to pre-dict the binding energies of all the multivariant sequences. One can also use linear regression tofind the bestfit to all of the data or at least to all of the data below the nonspecific
binding energy plateau (Stormo et al. 1986; Stormo and
Zhao 2007; Zhao et al. 2009). Applying linear regression
to these data sets obtains energy models (as PWMs) that
fit the data reasonably well. For example, using all sequen-ces in the R2 library with two or fewer variants to the
pre-ferred sequence, one gets an energy PWM that fits the
training data with an r2 = 0.96 and nearly all of the
pre-dictions are within 0.5 kT of the measured values (Figure
S3). The fit to the entire data set, including the plateau
region, has an r2 = 0.73 (Figure S3). Similar results can
be obtained for the other libraries (Figure S3), indicating that the additivity assumption, while clearly an approxima-tion, can often provide reasonably good estimates of the true binding energies, as has been reported previously for many different transcription factors (Benoset al.2002; Zhaoet al.
2009; Zhao and Stormo 2011; Weirauchet al.2013). In fact,
if the accuracy of our measurements were limited to 0.5
kT, which is a range typical of many high-throughput tech-niques, the predictions obtained from linear regression
would fit the data nearly as well as possible given its
in-herent variance. However, because we can measure energies
to within0.1 kT, we can easily see deviations from
ad-ditivity even after applying regression to obtain optimal PWMs.
Specificity of other LacI/GalR proteins
The LacI/GalR family of transcription factors has many
known and predicted binding site motifs (Novichkov et al.
2013), nearly all of them symmetric with a CG central pair. However, since many of those motifs are predicted based on comparative analyses that often assume symmetry, it is plau-sible that more members of the LacI/GalR family might also have flexible binding specificities that allow for variable length spacers and asymmetric binding sites. Methods that assume symmetric binding motifs can give misleading results, just as methods that assume asymmetry can if the sites are truly symmetric (Motlhabi and Stormo 2011). Hav-ing quantitative bindHav-ing affinity data is the best way to re-solve the issue of symmetry.
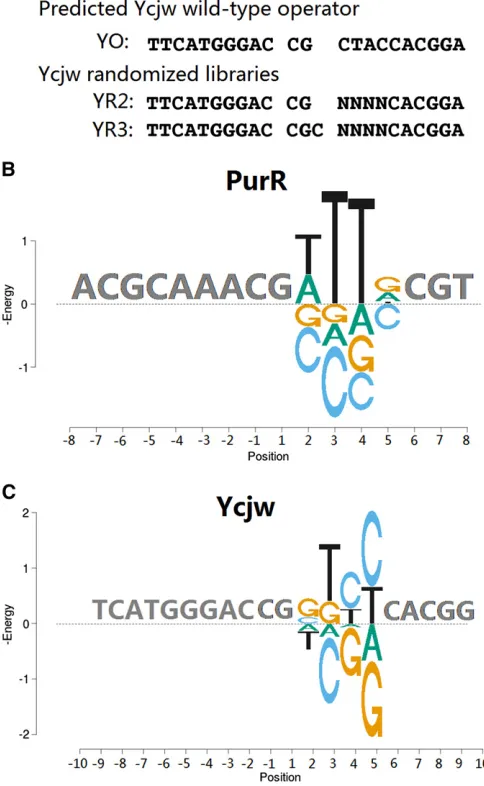
Based on the known and predicted motifs for PurR and YcjW we synthesized libraries that vary four positions of one
half-site to determine the specificity more accurately and
that also contain both 2- and 3-bp spacer regions (Figure 7A). Note that the predicted consensus site for YcjW has a 2-bp spacer but is asymmetric, differing at positions +/22 Figure 4 Energy Logos. (A) R2 library. (B) R3.2 (left half) and R3.1 (right
and +/24 in the two half-sites, similar to the lac operator
O1. Figure 7B shows the energy logo of PurR, which is
con-sistent with the known motif with a 2-bp spacer. The energy values at position +2 are in the same order as in previous measurements, but somewhat lower in magnitude (Glasfeld
et al.1999). But the previous measurements were made on symmetric double mutants so our smaller observed energies could be due to superadditivity of double mutants, as ob-served for the lac repressor. All randomized PurR sites with the 3-bp spacers had much lower affinity, indicating that it does not have the flexibility of the lac repressor to bind to extended sites (all data available inTable S3). The
highest-affinity site in the 3-bp spacer library,
ACGCAAA-CGG-TTGCCGT (variable positions underlined), has an energy of 1.0 kT but is best explained as a G substitution at position +2 with a 2-bp spacer. Most of the highest-affinity sites from this library are best explained by substitutions to the 2-bp spacer. The highest-affinity site that is best explained as a 3-bp spacer, ACGCAAA-CGG-TTTGCGT, has an energy of 3.3 kT, indicating a large cost to binding in an extended conformation and no alternative sequence preference. The preferred site for YcjW is also symmetric (Figure 7C), con-trary to the predicted consensus. But this protein is quite
nonspecific with .50 different sequences binding within 1
kT of the optimal site (all data available inTable S3). Again most of the highest-affinity sites in the 3-bp library can best be explained by variations to a 2-bp spacer site, and the highest-affinity site that is best explained with a 3-bp spacer,
TTCATGGGAC-CGC-GTCCCACGGA, has an energy of 1.2
kT, also indicating a substantial cost to binding in an
ex-tended conformation. The flexibility to bind to operators
with variable length spacers, and with alternative motifs depending on the spacer length, is not a general character-istic of the LacI/GalR family and may even be unique to the
lac repressor protein itself. In fact, previous experiments found that most variants of the lac repressor that bind to
L2L9 with high affinity lose high-affinity binding to O1
(Daber and Lewis 2009). PWMs based on regression analy-sis of the PurR and YcjW data are provided inFigure S4.
Discussion
Lac repressor specificity
The NMR structure of the lac repressor bound to the O1
operator shows the asymmetric arrangement of the protein with each half-site (Kalodimoset al.2002). The hinge helix from each monomer sits in the minor groove where Leu56 inserts between the CG dinucleotide at operator positions
21/0. The monomer interacting with the Rhalf-site is
ex-tended and rotated, compared to the monomer interacting with the Lhalf-site, because it must reach across positions
0 and +1 tofit into the major groove where the recognition
helix of the protein interacts with positions +2 to +10. Figure 5 shows our model of the interaction of the protein
with 10 different combinations ofLandRoperator
sequen-ces with each of three different spacers, CG, CGG, and CCGG. A protein monomer can be in either a compressed or an extended conformation, which is determined by the spacer length. For the CG spacer, both monomers are in the compressed state, for the CCGG spacer both are in the ex-tended state, and for the CGG spacer there is one of each.
The color of the oval in each operator configuration
respectively, and also replacing the sequences with the
pre-ferred sites for each state, L3R and R94R, costs a small
amount of free energy, between 0.2 and 0.5 kT for each
substitution; there is some context effect because replacing just one half-site is more costly than replacing both. But it is much more costly to have a mismatch between the confor-mation of the monomer and that of the binding site
se-quence. The extended state interacting with theLhalf-site
sequence (shown as red, thin ovals inL3L9,L4L9, andL4R)
costs 2.46 0.5 kT (again context matters to a small
ex-tent). The compressed state interacting with theRhalf-site
sequence (red thick ovals in L2R, R92R, and R93R) costs
3.7 kT, except that two such substitutions (in R92R) hit
the low-affinity plateau of 4.6 kT. There is one large excep-tion to this model, the site R93L9, which should have both types of conflicts but instead has a cost of 3.4 kT. We think this is best explained with the hinge helices sitting over the GG at positions 0/+1 instead of over the CG at positions 21/0 (note the red hinge helix). This site is equivalent to
the O1 operator with the central G changed to C whose
energy was measured in both R3 libraries (Figure 4B).
Our model ofL3R(theO1operator) is equivalent to the
model based on the NMR structure (Kalodimos et al.
2004b), and our measurements of binding energy differ-ences are consistent with the subset of previously published
measurements (Spronket al.1999). But in addition to
com-paring those 10 variations of L, R, and spacing, we have
measured energy differences over a collection of 2560 bind-ing sites. We determined that among the 2048 variants with a 3-bp spacer that we examined, the natural operator has
the highest affinity. Furthermore we can address questions
This implies that the two monomers communicate across the dimer interface so that variations in the complex on one side of the operator influence the complex on the other side.
The underprediction of energies for multivariant sites is most pronounced in the R2 library but is also seen in the R3.2 library, which also varies theL half-site. It is less obvious because all of the double variants include at least one of the highly specific positions, from23 to25, and most of them include combinations of those positions. This puts most of
the multivariant sites into the nonspecific plateau range
where additivity breaks down in general. For libraries R4
and R3.1, which vary the Rhalf-site, there is a mixture of
over- and underpredicted sites. The overpredictions are likely due to the protein adapting to multiple variants, mak-ing alternative contacts, so that the total free energy
in-crease is less than the sum. The protein appears not to fit
as tightly into theRhalf-site so that individual variants and combinations of variants are not as deleterious to binding as to theLhalf-site. The tightness of theLinteraction may be partly due to the extra contact between the hinge helix and
the HTH domain (Q54–N25) in the compressed
conforma-tion (Kalodimoset al.2004b). Nonetheless, the total
differ-ence in binding energy between L2L9, L3R, and R94R is
rather modest, suggesting that although theR half-site has
fewer favorable contacts, it maintains a higher entropy than theLhalf-site interaction.
Selection for an asymmetric binding site
Our current work shows that among 3-bp spacer sites the
asymmetric wild-type operator,O1, has optimal binding
af-finity. Although an alternative operator with a 2-bp spacer
has a somewhat higher affinity, all of the known lac
oper-ators from many different species maintain the same asym-metric site (Novichkovet al.2013). No other members of the LacI/GalR family are known to bind asymmetric motifs, and even most variants of the lac repressor that bind with high affinity to theL2L9site do not bind with high affinity toO1
(Daber and Lewis 2009). It appears that both the lac re-pressor protein and the asymmetric binding site have been selected because they offer some advantage to the cell. It is possible that the asymmetric site has a kinetic advantage
for binding, although that was not seen in in vivo
single-molecule studies where facilitated diffusion was observed but on rates were, if anything, slightly faster for the symmet-ric operatorL2L9(Hammaret al.2012, 2014). It is possible that the asymmetric site facilitates looping of the DNA and some simulation studies have suggested that could be the case (Cola-santiet al.2013), but other studies have not observed facilitated looping withO1 (Boedickeret al.2013). A third possibility is that the asymmetric binding site influences the accessibility of the inducer to its binding site and facilitates induction. The recognition helix in the extended conformation loses a contact with the hinge helix compared to the compressed conformation (Kalodimos et al. 2004b) and the allosteric effect of inducer binding is transmitted through the hinge helix to destabilize binding and has a diminished effect on theL2L9operator (Fal-con and Matthews 2001). In fact, theL2L9operator, while in-creasing repressionin vivo, also has reduced levels of expression under inducing conditions (Daber and Lewis 2009). Daber and Lewis also make another interesting point about the lac repres-sor binding with high affinity to an asymmetric site. While allowing the repressor to bind to sites with multiple spacings decreases its specificity compared to a protein that is restricted to a single spacing class, the specificity of the operator for dif-ferent proteins is increased. Most bacterial transcription factors bind as dimers and prefer symmetric binding sites and so are Figure 7 Analysis of PurR and YcjW. (A) Consensus sequences and
unlikely to bind with high affinity toO1, even if they have a preference for either theLor theRhalf-sites. The unique (as far as we know) capability of the lac repressor to bind
with very high (near maximum) affinity to an asymmetric
site means that it has little competition from other
repress-ors in binding toO1. That feature, combined with the very
high induction capacity, can explain the selective advan-tage of the unusual lac regulatory system.
A number of further experiments are suggested by our results. We have not varied the outer segments of the
operator sequence, positions210 to26 and +6 to +10 or
positions21 and +1. Those are all known to contribute to
the specificity of the lac repressor but are outside the asym-metric region ofO1that was the focus of this work. It would also be interesting to examine the specificity profile of some of the mutant lac repressors that have been obtained in various studies (Sartoriuset al.1989; Lehminget al.1990;
Markiewicz et al.1994; Daber and Lewis 2009; Milket al.
2010). Since a single lane of an EMSA gel is sufficient to
determine the relative affinities of thousands of variant
binding sites, many different proteins could be assayed in parallel and more thorough assessments of recognition mod-els could be obtained. Furthermore it would be informative to study some of the proteins in more detail for biophysical properties of the interactions, such as how specificity is af-fected by ionic strength, temperature, or pH (Mossing and
Record 1985; Franket al.1997), all of which can be
accom-plished efficiently using Spec-seq. Assessing the
contribu-tions of enthalpy and entropy to binding to the L and R
half-sites independently would also be interesting because our results suggest the two conformations of the protein have a different mix of contributions.
Spec-seq is rapid and accurate for determining specificity
The method of determining specificity by sequencing,
Spec-seq, is similar to some previously published methods but has
some distinct advantages. We first employed analysis of
bound and unbound fractions in the study of the Mnt repressor protein, using restriction enzymes (Stormo and
Yoshioka 1991; Stormoet al.1993), which limited the
num-ber of positions that could be studied. We then used DNA sequencing performed on pooled DNA, not single sequences, so the signal was analog with limited range and higher un-certainty than we can now obtain (Fields and Stormo 1994; Fieldset al.1997). Furthermore, since we did not determine sequences of individual binding sites, but rather pooled col-lections, the analysis was forced to assume independent contributions at each position. While that method allowed us to obtain a reasonable PWM approximation of binding (Fieldset al.1997; Stormo and Fields 1998), it did not allow for the measurement of nonindependent effects. We then
developed a method that used fluorescently tagged DNA
binding sites, QuMFRA, so that the ratio of the bound and unboundfluorescent signals is proportional to relative
bind-ing affinities (Man and Stormo 2001; Manet al.2004; Liu
and Stormo 2005a,b). This allows for the determination of relative affinity without assumptions of additivity, but only a few different sequences can be compared at a time. With four differentfluorescent tags we were limited to comparing four different sequences in a single reaction. Spec-seq over-comes both types of limitations. It generates digital signals, the number of counts for each sequence in both fractions from which probabilities of each sequence in the bound and unbound fractions are obtained. This increases the range of signals and decreases the uncertainty compared to the initial sequencing method. And like QuMFRA it does not require the independence assumption and lets us assess the good-ness of that approximation rigorously. By allowing for the
simultaneous determination of relative affinity for
thou-sands of sequences in a single reaction, and not requiring assumptions about independence, Spec-seq gives us a rapid
and accurate method to determine quantitative specificity
for any DNA-binding protein of interest. If one requires knowing absolute binding affinities, that needs to be deter-mined only for one sequence along with the relative affi ni-ties for the all of the rest. The same approach could be used
to determine the specificity of RNA-binding proteins with
the complication that secondary structure as well as se-quence has to be considered in the modeling.
We chose to separate bound and unbound fractions using a standard EMSA followed by cutting out the bands for sequencing, but any method of separating the two fractions could be used. One could use simplefilter binding, although background effects may be larger. One could also use an antibody to the protein, or to a tag attached to the protein, to pull out the bound fraction. One advantage of using EMSA is that there may be multiple shifted bands if the protein can bind in multiple copies or if one assays the binding of two or more proteins to the DNA library. For example, one could assay the binding of two proteins, A and B, by generating libraries that have variable binding sites for each and also have variable spacings between them. If the EMSA gel has four bands, one for each protein bound alone as well as the unbound and doubly bound DNA (e.g., Nget al.
2012), one could obtain the specificity profile for each protein as well as the cooperativity as a function of the spacer DNA all in one experiment. While limited to a few thousand variants in any one reaction, by performing sets of reactions with different components varied, one can expect to get a very thorough view of the binding of the protein complexes to DNA.
Several high-throughput methods have been developed in the last decade for determining protein–DNA interaction
specificity (reviewed in Stormo and Zhao 2010). Compared
to those methods Spec-seq has one significant disadvantage, but several valuable advantages. The disadvantage is that the number of sequences that can be assayed in a single experiment is in the thousands (but see alternative below),
whereas PBM and related methods (Bergeret al.2006; Warren
et al.2006; Nutiuet al.2011), SELEX-seq (Zhaoet al.2009;
2011), and B1H (Meng et al. 2005; Christensen et al.
2011; Gupta et al.2014) can assay millions, or more, of
sequences simultaneously. But those methods do not mea-sure binding affinity directly, but rather something related to it such as binding site counts in SELEX-seq and B1H or
fluorescence intensity in PBM. Estimating binding affi
ni-ties requiresfitting those measurements to some model. A
variety of methods have been developed, but the best usually involve a biophysical model of the binding inter-action and how that relates to the measured quantities.
For example, the method of“binding energy estimates by
maximum likelihood” (BEEML) (Zhao et al. 2009) uses
SELEX-seq data for both the selected binding sites and the input (or prior) DNA and estimates the binding ener-gies for individual sequences from the following biophys-ical model,
PðSijBÞ
PðSijIÞ} 1 1þeEi2m;
where P(Si|B) is the probability of sequence Si in the
bound fraction andP(Si|I) is that in the input DNA (which
could be from any round of SELEX).Eiis the energy value
wanted and m is the chemical potential that is related to
the protein concentration. Similar approaches are typically used for PBM and B1H data as well, although details vary, depending on the experimental approach (Stormo 2013).
Ei is always modeled as some function of the sequence,
such as a PWM, although more complex models, including k-mer and shape contributions to binding energy, can also be used (Slatteryet al. 2011; Zhaoet al.2012; Gordanet al.
2013; Mathelier and Wasserman 2013; Stormo 2013; Weirauch
et al.2013; Orenstein and Shamir 2014). Determination of relative binding energies, compared to a reference
se-quence with binding free energy defined as 0, can be
obtaining byfitting to
PðSijBÞ
PðSrefBÞ
PðSrefIÞ
PðSijIÞ ¼
1þe2m
1þeEi2m:
Note that the protein concentration does not cancel out and estimates of all parameters, including the chemical potential and the parameters of the energy function, require nonlinear regression methods. In contrast, with Spec-seq the relative binding energies are obtained from the ratios of each sequence in the bound and unbound fractions from
PðSijBÞ
PðSrefBÞ
PðSrefUÞ
PðSijUÞ ¼
e2Ei;
whereP(Si|U)is the probability of sequenceSiin the
un-bound fraction (see expanded theory description in File
S1). No energy model, such as a PWM, is needed nor is
any regression required. We measure exactly what we
want, relative binding affinities (and energies by taking
the logarithm). Of course we can use the measured
bind-ing energies to assess how well various models fit the
data, as we described in Results. Spec-seq can provide
accurate results and does not require any complex math-ematical modeling or any assumptions about the recogni-tion process.
Given a consensus sequence one can generate what-ever variations one wants to test, often covering the vast majority of likely binding sites within a reasonable range
of relative affinities. For example, for a 10-long binding
site there are only 3676 sequences with no more than three mismatches to the consensus, a number that could be assayed in a single Spec-seq run. If one starts with no information about the specificity of the protein, one could
do two stages: first, a general method such as PBM,
SELEX-seq, or B1H, to get a consensus sequence followed by, second, accurate quantitation of relative affinities with Spec-seq. Alternatively one could perform a standard SELEX procedure, with a very diverse library, but sequence both the bound and unbound fractions. If the number of sequences is large, not all of them will be counted in both fractions, and for the missing ones one could obtain only an
estimate (upper or lower bound) on the relative affinity.
But for every sequence that occurs in both fractions with sufficient counts, relative affinities are obtained and this could easily include all of the most relevant (highest affinities) binding sites.
The results of Spec-seq are most similar to those of the MITOMI method, as is the number of sequences that can be assayed in parallel (Maerkl and Quake 2007). In the
first description of the method Maerkl and Quake (2007)
assayed four bHLH transcription factors, each to 464 dif-ferent binding sites. The method requires construction of
a microfluidic device with multiple chambers and control
elements, the synthesis of the entire set of individual sites to be analyzed, and then the synthesis of proteins within
the chambers, usingin vitrotranscription/translation
pro-tocols. In contrast, Spec-seq could obtain equivalent data
(as relative affinities) for many more sequences from one
lane of an EMSA gel for each protein. If absolute affinities are required, that needs to be determined for only one sequence. Parallel analyses of many different proteins can be obtained by simply running additional lanes in the EMSA gels and submitting each for sequencing with the appropriate barcodes to separate the data from indi-vidual experiments.
Acknowledgments
Literature Cited
Badis, G., M. F. Berger, A. A. Philippakis, S. Talukder, A. R. Gehrke
et al., 2009 Diversity and complexity in DNA recognition by transcription factors. Science 324: 1720–1723.
Bell, C. E., and M. Lewis, 2001 Crystallographic analysis of Lac
repressor bound to natural operator O1. J. Mol. Biol. 312: 921– 926.
Benos, P. V., M. L. Bulyk, and G. D. Stormo, 2002 Additivity in
protein-DNA interactions: How good an approximation is it? Nucleic Acids Res. 30: 4442–4451.
Berger, M. F., A. A. Philippakis, A. M. Qureshi, F. S. He, P. W. Estep, 3rdet al., 2006 Compact, universal DNA microarrays to com-prehensively determine transcription-factor binding site specif-icities. Nat. Biotechnol. 24: 1429–1435.
Betz, J. L., H. M. Sasmor, F. Buck, M. Y. Insley, and M. H. Caruthers,
1986 Base substitution mutants of the lac operator: in vivo
and in vitro affinities for lac repressor. Gene 50: 123–132. Boedicker, J. Q., H. G. Garcia, and R. Phillips, 2013 Theoretical
and experimental dissection of DNA loop-mediated repression. Phys. Rev. Lett. 110: 018101.
Bulyk, M. L., P. L. Johnson, and G. M. Church, 2002 Nucleotides
of transcription factor binding sites exert interdependent effects on the binding affinities of transcription factors. Nucleic Acids Res. 30: 1255–1261.
Christensen, R. G., A. Gupta, Z. Zuo, L. A. Schriefer, S. A. Wolfe
et al., 2011 A modified bacterial one-hybrid system yields im-proved quantitative models of transcription factor specificity. Nucleic Acids Res. 39: e83.
Colasanti, A. V., M. A. Grosner, P. J. Perez, N. Clauvelin, X. J. Lu
et al., 2013 Weak operator binding enhances simulated lac
repressor-mediated DNA looping. Biopolymers 99: 1070–1081.
Daber, R., and M. Lewis, 2009 Towards evolving a better
repres-sor. Protein Eng. Des. Sel. 22: 673–683.
Falcon, C. M., and K. S. Matthews, 2001 Engineered disulfide
linking the hinge regions within lactose repressor dimer in-creases operator affinity, decreases sequence selectivity, and al-ters allostery. Biochemistry 40: 15650–15659.
Fields, D. S., and G. D. Stormo, 1994 Quantitative DNA
sequenc-ing to determine the relative protein-DNA bindsequenc-ing constants to
multiple DNA sequences. Anal. Biochem. 219: 230–239.
Fields, D. S., Y. He, A. Y. Al-Uzri, and G. D. Stormo, 1997 Quantitative specificity of the Mnt repressor. J. Mol. Biol. 271: 178–194. Foat, B. C., A. V. Morozov, and H. J. Bussemaker, 2006 Statistical
mechanical modeling of genome-wide transcription factor
occu-pancy data by MatrixREDUCE. Bioinformatics 22: e141–e149.
Frank, D. E., R. M. Saecker, J. P. Bond, M. W. Capp, O. V. Tsodikov
et al., 1997 Thermodynamics of the interactions of lac repres-sor with variants of the symmetric lac operator: effects of con-verting a consensus site to a non-specific site. J. Mol. Biol. 267: 1186–1206.
Gilbert, W., J. Gralla, J. Majors, and A. Maxam, 1975 Lactose op-erator sequences and the action of lac repressors, pp. 193–210 in
Protein-Ligand Interactions, edited by B. Sund. De Gruyter, Berlin/ New York.
Glasfeld, A., A. N. Koehler, M. A. Schumacher, and R. G. Brennan, 1999 The role of lysine 55 in determining the specificity of the purine repressor for its operators through minor groove inter-actions. J. Mol. Biol. 291: 347–361.
Goeddel, D. V., D. G. Yansura, and M. H. Caruthers, 1978 How lac
repressor recognizes lac operator. Proc. Natl. Acad. Sci. USA 75: 3578–3582.
Gordan, R., N. Shen, I. Dror, T. Zhou, J. Horton et al.,
2013 Genomic regionsflanking E-box binding sites influence
DNA binding specificity of bHLH transcription factors through DNA shape. Cell Rep. 3: 1093–1104.
Gupta, A., R. G. Christensen, H. A. Bell, M. Goodwin, R. Y. Patel
et al., 2014 An improved predictive recognition model for Cys (2)-His(2) zinc finger proteins. Nucleic Acids Res. 42: 4800– 4812.
Hammar, P., P. Leroy, A. Mahmutovic, E. G. Marklund, O. G. Berg
et al., 2012 The lac repressor displays facilitated diffusion in living cells. Science 336: 1595–1598.
Hammar, P., M. Wallden, D. Fange, F. Persson, O. Baltekinet al.,
2014 Direct measurement of transcription factor dissociation
excludes a simple operator occupancy model for gene regula-tion. Nat. Genet. 46: 405–408.
Jacob, F., and J. Monod, 1961 Genetic regulatory mechanisms in
the synthesis of proteins. J. Mol. Biol. 3: 318–356.
Jolma, A., T. Kivioja, J. Toivonen, L. Cheng, G. Wei et al.,
2010 Multiplexed massively parallel SELEX for
characteriza-tion of human transcripcharacteriza-tion factor binding specificities. Genome Res. 20: 861–873.
Jolma, A., J. Yan, T. Whitington, J. Toivonen, K. R. Nitta et al., 2013 DNA-binding specificities of human transcription factors. Cell 152: 327–339.
Kalodimos, C. G., A. M. Bonvin, R. K. Salinas, R. Wechselberger, R. Boelenset al., 2002 Plasticity in protein-DNA recognition: lac repressor interacts with its natural operator 01 through alterna-tive conformations of its DNA-binding domain. EMBO J. 21: 2866–2876.
Kalodimos, C. G., N. Biris, A. M. Bonvin, M. M. Levandoski, M. Guennuegueset al., 2004a Structure andflexibility adaptation in nonspecific and specific protein-DNA complexes. Science 305: 386–389.
Kalodimos, C. G., R. Boelens, and R. Kaptein, 2004b Toward an
integrated model of protein-DNA recognition as inferred from NMR studies on the Lac repressor system. Chem. Rev. 104: 3567–3586.
Kim, J. B., G. D. Spotts, Y. D. Halvorsen, H. M. Shih, T. Ellenberger
et al., 1995 Dual DNA binding specificity of ADD1/SREBP1 controlled by a single amino acid in the basic helix-loop-helix domain. Mol. Cell. Biol. 15: 2582–2588.
Lehming, N., J. Sartorius, B. Kisters-Woike, B. von Wilcken-Bergmann, and B. Muller-Hill, 1990 Mutant lac repressors with new specif-icities hint at rules for protein–DNA recognition. EMBO J. 9: 615–621.
Lewis, M., 2005 The lac repressor. C. R. Biol. 328: 521–548.
Liu, J., and G. D. Stormo, 2005a Combining SELEX with
quanti-tative assays to rapidly obtain accurate models of protein-DNA interactions. Nucleic Acids Res. 33: e141.
Liu, J., and G. D. Stormo, 2005b Quantitative analysis of EGR
proteins binding to DNA: assessing additivity in both the bind-ing site and the protein. BMC Bioinformatics 6: 176.
Maerkl, S. J., and S. R. Quake, 2007 A systems approach to
mea-suring the binding energy landscapes of transcription factors. Science 315: 233–237.
Man, T. K., and G. D. Stormo, 2001 Non-independence of Mnt
repressor-operator interaction determined by a new quantitative multiplefluorescence relative affinity (QuMFRA) assay. Nucleic Acids Res. 29: 2471–2478.
Man, T. K., J. S. Yang, and G. D. Stormo, 2004 Quantitative
mod-eling of DNA-protein interactions: effects of amino acid substi-tutions on binding specificity of the Mnt repressor. Nucleic Acids Res. 32: 4026–4032.
Markiewicz, P., L. G. Kleina, C. Cruz, S. Ehret, and J. H. Miller,
1994 Genetic studies of the lac repressor. XIV. Analysis of
4000 altered Escherichia coli lac repressors reveals essential and non-essential residues, as well as“spacers”which do not require a specific sequence. J. Mol. Biol. 240: 421–433.
Mathelier, A., and W. W. Wasserman, 2013 The next generation
Mathelier, A., X. Zhao, A. W. Zhang, F. Parcy, R. Worsley-Hunt
et al., 2014 JASPAR 2014: an extensively expanded and up-dated open-access database of transcription factor binding pro-files. Nucleic Acids Res. 42: D142–D147.
Meng, X., M. H. Brodsky, and S. A. Wolfe, 2005 A bacterial
one-hybrid system for determining the DNA-binding specificity of
transcription factors. Nat. Biotechnol. 23: 988–994.
Milk, L., R. Daber, and M. Lewis, 2010 Functional rules for lac
repressor-operator associations and implications for protein-DNA interactions. Protein Sci. 19: 1162–1172.
Mossing, M. C., and M. T. Record, Jr.., 1985 Thermodynamic
origins of specificity in the lac repressor-operator interaction. Adaptability in the recognition of mutant operator sites. J. Mol. Biol. 186: 295–305.
Motlhabi, L. M., and G. D. Stormo, 2011 Assessing the effects of
symmetry on motif discovery and modeling. PLoS ONE 6: e24908.
Ng, C. K., N. X. Li, S. Chee, S. Prabhakar, P. R. Kolatkar et al.,
2012 Deciphering the Sox-Oct partner code by quantitative
cooperativity measurements. Nucleic Acids Res. 40: 4933–4941. Novichkov, P. S., A. E. Kazakov, D. A. Ravcheev, S. A. Leyn, G. Y. Kovaleva et al., 2013 RegPrecise 3.0–a resource for genome-scale exploration of transcriptional regulation in bacteria. BMC Genomics 14: 745.
Noyes, M. B., R. G. Christensen, A. Wakabayashi, G. D. Stormo, M. H. Brodskyet al., 2008 Analysis of homeodomain specifi c-ities allows the family-wide prediction of preferred recognition sites. Cell 133: 1277–1289.
Nutiu, R., R. C. Friedman, S. Luo, I. Khrebtukova, D. Silva et al.,
2011 Direct measurement of DNA affinity landscapes on
a high-throughput sequencing instrument. Nat. Biotechnol. 29: 659–664.
Orenstein, Y., and R. Shamir, 2014 A comparative analysis of
transcription factor binding models learned from PBM, HT-SELEX and ChIP data. Nucleic Acids Res. 42: e63.
Parraga, A., L. Bellsolell, A. R. Ferre-D’Amare, and S. K. Burley, 1998 Co-crystal structure of sterol regulatory element binding protein 1a at 2.3 A resolution. Structure 6: 661–672.
Royer, C. A., A. E. Chakerian, and K. S. Matthews,
1990 Macromolecular binding equilibria in the lac repressor
system: studies using high-pressure fluorescence spectroscopy. Biochemistry 29: 4959–4966.
Sadler, J. R., H. Sasmor, and J. L. Betz, 1983 A perfectly symmet-ric lac operator binds the lac repressor very tightly. Proc. Natl. Acad. Sci. USA 80: 6785–6789.
Sarai, A., and Y. Takeda, 1989 Lambda repressor recognizes the
approximately 2-fold symmetric half-operator sequences asym-metrically. Proc. Natl. Acad. Sci. USA 86: 6513–6517.
Sartorius, J., N. Lehming, B. Kisters, B. von Wilcken-Bergmann, and B. Muller-Hill, 1989 lac repressor mutants with double or tri-ple exchanges in the recognition helix bind specifically to lac
operator variants with multiple exchanges. EMBO J. 8: 1265–
1270.
Sasmor, H. M., and J. L. Betz, 1990 Symmetric lac operator
de-rivatives: effects of half-operator sequence and spacing on re-pressor affinity. Gene 89: 1–6.
Slattery, M., T. Riley, P. Liu, N. Abe, P. Gomez-Alcala et al.,
2011 Cofactor binding evokes latent differences in DNA
bind-ing specificity between Hox proteins. Cell 147: 1270–1282.
Spronk, C. A., G. E. Folkers, A. M. Noordman, R. Wechselberger, N.
van den Brink et al., 1999 Hinge-helix formation and DNA
bending in various lac repressor-operator complexes. EMBO J. 18: 6472–6480.
Stormo, G. D., 2000 DNA binding sites: representation and
dis-covery. Bioinformatics 16: 16–23.
Stormo, G. D., 2013 Modeling the specificity of proteDNA
in-teractions. Quant. Biol. 1: 115–130.
Stormo, G. D., and D. S. Fields, 1998 Specificity, free energy and information content in protein-DNA interactions. Trends Bio-chem. Sci. 23: 109–113.
Stormo, G. D., and M. Yoshioka, 1991 Specificity of the Mnt pro-tein determined by binding to randomized operators. Proc. Natl. Acad. Sci. USA 88: 5699–5703.
Stormo, G. D., and Y. Zhao, 2007 Putting numbers on the
net-work connections. BioEssays 29: 717–721.
Stormo, G. D., and Y. Zhao, 2010 Determining the specificity of
protein-DNA interactions. Nat. Rev. Genet. 11: 751–760.
Stormo, G. D., T. D. Schneider, and L. Gold, 1986 Quantitative
analysis of the relationship between nucleotide sequence and functional activity. Nucleic Acids Res. 14: 6661–6679.
Stormo, G. D., S. Strobl, M. Yoshioka, and J. S. Lee, 1993 Specificity of the Mnt protein. Independent effects of mutations at different positions in the operator. J. Mol. Biol. 229: 821–826.
Takeda, Y., A. Sarai, and V. M. Rivera, 1989 Analysis of the
sequence-specific interactions between Cro repressor and opera-tor DNA by systematic base substitution experiments. Proc. Natl. Acad. Sci. USA 86: 439–443.
Von Hippel, P. H., 1979 On the molecular bases of the specificity of interaction of transcriptional proteins with genome DNA, pp. 279–347 in Biological Regulation and Development, edited by R. F. Goldberger. Plenum, New York.
von Hippel, P. H., and O. G. Berg, 1986 On the specificity of DNA-protein interactions. Proc. Natl. Acad. Sci. USA 83: 1608–1612. Warren, C. L., N. C. Kratochvil, K. E. Hauschild, S. Foister, M. L. Brezinskiet al., 2006 Defining the sequence-recognition pro-file of DNA-binding molecules. Proc. Natl. Acad. Sci. USA 103: 867–872.
Weirauch, M. T., A. Cote, R. Norel, M. Annala, Y. Zhao et al.,
2013 Evaluation of methods for modeling transcription factor
sequence specificity. Nat. Biotechnol. 31: 126–134.
Wong, D., A. Teixeira, S. Oikonomopoulos, P. Humburg, I. N. Lone
et al., 2011 Extensive characterization of NF-kappaB binding uncovers non-canonical motifs and advances the interpretation of genetic functional traits. Genome Biol. 12: R70.
Zhao, Y., and G. D. Stormo, 2011 Quantitative analysis
demon-strates most transcription factors require only simple models of specificity. Nat. Biotechnol. 29: 480–483.
Zhao, Y., D. Granas, and G. D. Stormo, 2009 Inferring binding
energies from selected binding sites. PLoS Comput. Biol. 5: e1000590.
Zhao, Y., S. Ruan, M. Pandey, and G. D. Stormo, 2012 Improved
models for transcription factor binding site identification using nonindependent interactions. Genetics 191: 781–790.
Zykovich, A., I. Korf, and D. J. Segal, 2009 Bind-n-Seq:
high-throughput analysis of in vitro protein-DNA interactions using massively parallel sequencing. Nucleic Acids Res. 37: e151.
GENETICS
Supporting Information http://www.genetics.org/lookup/suppl/doi:10.1534/genetics.114.170100/-/DC1
High-Resolution Speci
fi
city from DNA Sequencing
Highlights Alternative Modes of Lac
Repressor Binding
Zheng Zuo and Gary D. Stormo