ISSN(Online): 2319-8753 ISSN (Print): 2347-6710
I
nternational
J
ournal of
I
nnovative
R
esearch in
S
cience,
E
ngineering and
T
echnology
(A High Impact Factor, Monthly, Peer Reviewed Journal) Visit: www.ijirset.com
Vol. 8, Issue 5, May 2019
A Novel Approach for Automatic
Classification of Breast cancer Using Features
Extracted from Mammogram
M.Chitra Devi1, B.Sobiya2
Associate Professor, Sakthi College of Arts and Science for Women, Tamil Nadu, India1
Research Scholar, Department of Computer Science, Sakthi College of Arts and Science for Women,
Tamil Nadu, India2
ABSTRACT : During their life, among 8% of women are diagnosed with Breast cancer (BC), after lung cancer, BC is the second popular cause of death in both developed and undeveloped worlds. BC is characterized by the mutation of genes, constant pain, changes in the size, color(redness), skin texture of breasts. As per clinical expert detecting this cancer in its first stage helps in saving lives. For detecting breast cancer mostly machine learning techniques are used. In this paper we proposed Classification of breast cancer leads pathologists to find a systematic and objective prognostic, generally the most frequent classification is binary (benign cancer/malign cancer). Today, Machine Learning (ML) techniques are being broadly used in the breast cancer classification problem. They provide high classification accuracy and effective diagnostic capabilities. In this paper, we present new different classifiers: k-nearest neighbor (KNN) for breast cancer classification. We propose a comparison between the two new implementations and evaluate their accuracy using cross validation. Results show that KNN gives the highest accuracy (97.51%).
KEYWORDS: Breast cancer, Machine Learning, k-Nearest Neighbor, Cross Validation.
I. INTRODUCTION
The breast lesion act as the one of the significant problems now a day, the first line diagnosable solution by detecting all lesions of the breast early to help and improving prognosis of cancer and other health problem related to breast [1-3]. More than one diagnostic modalities are used for breast cancer screening like computed tomography, resonance magnetic imaging and ultrasound. All of these modalities don’t enough to detect all lesions of the breast in spite of their characteristics such as high sensitivity of soft tissue detection. This shortening of detecting lead to support the final diagnosis decision by other further examinations like biopsy and unfortunately that may increase the anxiety of the patients [4-7]. The digital mammography is superior in detecting breast lesions than other diagnostic modalities. American cancer society recommended that MRI breast investigation should be mandatory for women with previous history of ovarian cancer or positive family history. Nowadays, a new method introduces to detect the beast lesions. This method is called digital mammography. Because its ability to link with image processing software [8-11]. Digital radiography acts as the useful modalities in lesions detection of the breast because its sensitivity and precision that may increase when used by well expert and trained radiologist. Many studies showed that 10-30% lesion of the breast were missing during routine screening [12].
ISSN(Online): 2319-8753 ISSN (Print): 2347-6710
I
nternational
J
ournal of
I
nnovative
R
esearch in
S
cience,
E
ngineering and
T
echnology
(A High Impact Factor, Monthly, Peer Reviewed Journal) Visit: www.ijirset.com
Vol. 8, Issue 5, May 2019
take a decision of diagnostic breast lesions [16,17]. There are many types of techniques used for mammography images detection such as edge-based transform, smoothing, noise removal and extraction techniques. Those methods help the physician in breast cancer diagnosis and monitor the treatment process [18,19].
The four stages in breast cancer are discussed in short. The stage 0, is described as non-invasive stage. It does not gives the classification of cancer and non-cancer breast cells. The stage I is described as the cancer cells based on the measurement of tumor cells is up to 2cm and the absence of lymph nodes. The stage 2 is categorized as 2A and 2B. The stage 2A is of the absence of tumor cells in the breast but the presence of cancer cells in the auxiliary lymph nodes. If the tumor cells is <=2cm, it is spread to the auxiliary lymph nodes and if it is >2cm and <5cm, it is not spread to auxiliary lymph nodes. The stage 2B is detected if the tumor cell is >2cm and <5cm, it is spread to the auxiliary nodes and if it is >5, it is not spread to the auxiliary lymph nodes. The stage 3 is explained as 3A, 3B, and 3C. The stage 3A is absence of tumor cells and the cancer cells in the lymph nodes, if the tumor is <=5cm and spread to lymph nodes, if the tumor is >5cm and spread to lymph nodes. The stage 3B is tumor is of any size and spread to the wall of the breast, cancer cells spread to the lymph nodes and identification of inflammatory cancer cells. The stage 3C occurs when no sign of cancer but tumor with varied size in the chest, cancer cells in the lymph node or cancer cells in the lymph nodes near breast bone. The stage 4 is spread to the other parts of the body like lungs, liver, bone, or brain. The breast cancer is not able to be find when it is inside the breast and the Metastatic is considered which is at the lymph nodes or wall of the breast [12].
Breast cancer is an uncontrolled growth of breast cells which occur as a result of mutations, or abnormal changes, in the genes responsible for regulating the growth of cells. The genes in each cells’ nucleus, acts as the “control room” of each cell. Normally, the cells in our bodies replace themselves through an orderly process of cell growth and hence the healthy new cells replaced by the old dead ones. But, often mutations can “turn on” certain genes and “turn off” others in a cell. Those changed cell gain the ability to keep dividing without any control or order, producing more cells forming a tumor. The masses in the breast cells are classified into benign and malignant. Malignant is the cancerous cell whereas benign is the non-cancerous cell.
In the proposed work, the mammography is used to implement. In general, the mammography is defined as the specific type of imaging which uses a low-dose x-ray system to analyze the disorder or disease in the breast cancer. It is used to detect the disease at the earliest stage. Imaging with x-rays involves exposing a part of the body to a small dose of ionizing radiation to produce the image. The mammography techniques which are used in most of the applications
are digital mammography and computer-aided detection. Digital mammogram is an imaging technique used for
diagnosing breast cancer [13]. Instead of x-ray film, the solid-state detectors are used which converts x-rays into signals. The signals are processed to get the result of breast detection as images. This process is digitized. CAD is also similar to digital mammography. It requires special software to identify the density, mass, or calcification which indicated the presence of cancer cells. The results of mammography may be sometimes false negative or false positive. The false negative is the case when the mammogram appears normally in breast cancer and the false positive is when there is changes in the size of tissues. It is processed through biopsy or ultra-sound to identify cancer [10]. In our proposed work, digital mammography is preferred.
The research paper is sectioned as follows. The section II presents the review related to the proposed work, section III is to explain the methodologies of proposed work, section IV detailed the results of proposed work and section V concludes the entire paper.
II. LITERATURE SURVEY
1. Automatic lumen segmentation in CT and PC-MR images of abdominal aortic aneurysm.
ISSN(Online): 2319-8753 ISSN (Print): 2347-6710
I
nternational
J
ournal of
I
nnovative
R
esearch in
S
cience,
E
ngineering and
T
echnology
(A High Impact Factor, Monthly, Peer Reviewed Journal) Visit: www.ijirset.com
Vol. 8, Issue 5, May 2019
Active Shape Model (ASM) and it is proposed by Cootes and Taylor. ASM is based on the landmark shaped module, linear models of gray value and the iteration optimization. In this paper, multiple-resolution is used to enhance the
segmentation speed and robustness. Though the paper has high quality method, the disadvantage is complexity in
parameter and the computational time.
2. Shape-dependent canny edge detector
Edge detection is the name for a set of mathematical methods which aim at identifying points in a digital image at which the image brightness changes sharply or, more formally, has discontinuities. The points at which image brightness changes sharply are typically organized into a set of curved line segments termed edges. The same problem of finding discontinuities in 1D signals is known as step detection and the problem of finding signal discontinuities over time is known as change detection. Edge detection is a fundamental tool in image processing, machine vision and computer vision, particularly in the areas of feature detection and feature extraction.
A typical edge might for instance be the border between a block of red color and a block of yellow. In contrast a line (as can be extracted by a ridge detector) can be a small number of pixels of a different color on an otherwise unchanging background. For a line, there may therefore usually be one edge on each side of the line. Although certain literature has considered the detection of ideal step edges, the edges obtained from natural images are usually not at all ideal step edges. Instead they are normally affected by one or several of the following effects:
Focal blur caused by a finite depth-of-field and finite point spread function.
Penumbral blur caused by shadows created by light sources of non-zero radius.
shading at a smooth object
The advantage of this paper is canny edge detector and the disadvantage is that it does not support edge losses.
3. Automation of differential blood count
A technique for automating the differential count of blood is presented. The proposed system takes as input, color images of stained peripheral blood smears and identifies the class of each of the White Blood Cells (WBC), in order to determine the count of cells in each class. The process involves segmentation, feature extraction and classification. WBC segmentation is a two-step process carried out on the HSV-equivalent of the image, using K-Means clustering followed by EM-algorithm. Features extracted from the segmented cytoplasm and nucleus, are motivated by the visual cues of shape, color and texture. Various classifiers have been explored on different combinations of feature sets. The results presented here are based on trials conducted with normal cells.
The objective of segmentation is to extract the WBC’s from the background cells as well as to distinguish between the cytoplasm and the nucleus. We first locate the nuclei of the cells using K-Means clustering following which a rectangular region that encompasses the entire cell is cropped. Subsequent processing is carried out on these sub-images each of which is assumed to contain only one WBC. K-Means clustering followed by EM-algorithm are used to get the final segmentation. The advantage of this method is that improvement in quality, detection of fast blood cell.
4. Watershed segmentation of cervical images using multi scale morphological gradient and HSI color space This method converts the input RGB image into HSI image which contains three components hue, saturation and intensity. The saturation component is thresholded to obtain the binary image and each pixel in the binary image is multiplied with hue component to obtain the product image. The intensity image is complemented, thresholded and merged with the product image and smoothened. The local minima are reduced using extended minima function and the multiscale gradient of this resultant gray scale image is segmented using watershed algorithm based on Hill Climbing technique. Experimental results add to the computational efficiency of the algorithm, its shape maintaining, edge preserving and scale-calibrating features. The performance is also superior to most other segmentation techniques.
ISSN(Online): 2319-8753 ISSN (Print): 2347-6710
I
nternational
J
ournal of
I
nnovative
R
esearch in
S
cience,
E
ngineering and
T
echnology
(A High Impact Factor, Monthly, Peer Reviewed Journal) Visit: www.ijirset.com
Vol. 8, Issue 5, May 2019
the objects. The proposed algorithm though prevents over segmentation, it preserves the sub features of the objects required for diagnosis. The segmentation results as are produced by the proposed algorithm. The merit of this method is segmentation process with high rate and the demerit is that it could not be applied to color images.
III. METHODOLOGY AND MATERIALS
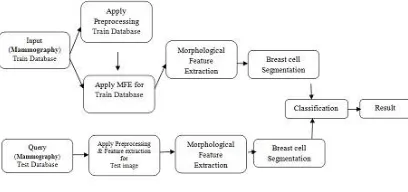
The primary goal of the proposed work is to make the identification of acute leukemia from blood microscope images as automatic. It is considered as primary, due to the difficulty in identification of segmentation of nucleus than the segmentation of the entire cell. In the proposed work, a microscopic blood image size of 184×138 is used. The peripheral blood smear images are used to implement the proposed work and it is collected from two places. The automation of proposed work is handled with color correlation, segmentation of the nucleated cells, and effective validation and classification. The k-means approach is used for segmentation and classification. The entire process of proposed work is represented in the below image 1.
Figure 1 – Architecture of proposed system
The proposed system is categorized as five modules and they are 1) Input Blood Cell Image 2) Calculation of Cell Features in the Input Image 3) Cell Features Segmented were Classified Using K-Means 4) Selection of the Classified Features and 5) Classification. Each modules are discussed in detail.
1. Preprocessing
The purpose of image preprocessing is to eliminate unwanted noise present in the original input image and improve the quality of fine details present in it [2, 3]. This will make it informal for further processing of image in order to achieve the defined aim. The image preprocessing includes image enhancement, removal of noise and breast part extraction. Smoothing image pixel using averaging filter, Otsu technique to separate background from breast region, morphological operations, sharpening have been used for preprocessing on digital mammographic images.
2. Calculate Cell Features in the Input Image
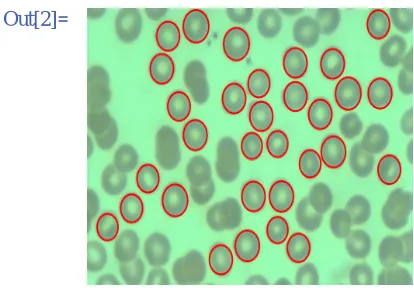
It is the second process. In this the features which are relevant to the work are extracted from the large data samples. It is the base of the classification process. So, the feature has to be extracted carefully. The research work has been handled to process the extraction of features efficiently.
Use analysis techniques on a segmented image to mark the location and size of complete and non overlapping cells in a microscopic image is presented in the below image 2.
ISSN(Online): 2319-8753 ISSN (Print): 2347-6710
I
nternational
J
ournal of
I
nnovative
R
esearch in
S
cience,
E
ngineering and
T
echnology
(A High Impact Factor, Monthly, Peer Reviewed Journal) Visit: www.ijirset.com
Vol. 8, Issue 5, May 2019
In[2]:=
Out[2]=
Figure 2 – Calculation of Cell Features
3 Morphological Feature Extraction is a collection of non-linear operations related to the shape or morphology of features in an image. Morphological operations rely only on the relative ordering of pixel values, not on their numerical values, and therefore are especially suited to the processing of binary images. Morphological operations can also be applied to greyscale images such that their light transfer functions are unknown and therefore their absolute pixel values are of no or minor interest.
Morphological techniques probe an image with a small shape or template called a structuring element. The structuring element is positioned at all possible locations in the image and it is compared with the corresponding neighbourhood of pixels. Some operations test whether the element "fits" within the neighbourhood, while others test whether it "hits" or intersects the neighbourhood:
Probing of an image with a structuring element
(white and grey pixels have zero and non-zero values, respectively).
A morphological operation on a binary image creates a new binary image in which the pixel has a non-zero value only if the test is successful at that location in the input image.
The structuring element is a small binary image, i.e. a small matrix of pixels, each with a value of zero or one:
ISSN(Online): 2319-8753 ISSN (Print): 2347-6710
I
nternational
J
ournal of
I
nnovative
R
esearch in
S
cience,
E
ngineering and
T
echnology
(A High Impact Factor, Monthly, Peer Reviewed Journal) Visit: www.ijirset.com
Vol. 8, Issue 5, May 2019
The pattern of ones and zeros specifies the shape of the structuring element.
An origin of the structuring element is usually one of its pixels, although generally the origin can be outside
the structuring element.
Examples of simple structuring elements.
A common practice is to have odd dimensions of the structuring matrix and the origin defined as the centre of the matrix. Stucturing elements play in moprphological image processing the same role as convolution kernels in linear image filtering.
When a structuring element is placed in a binary image, each of its pixels is associated with the corresponding pixel of the neighbourhood under the structuring element. The structuring element is said to fitthe image if, for each of its pixels set to 1, the corresponding image pixel is also 1. Similarly, a structuring element is said to hit, or intersect, an image if, at least for one of its pixels set to 1 the corresponding image pixel is also 1.
Fitting and hitting of a binary image with structuring elements s1 and s2.
Zero-valued pixels of the structuring element are ignored, i.e. indicate points where the corresponding image value is irrelevant.
4. CLASSIFIED FEATURES
The data samples are categorized by considering the kinds of image features using classification approach. The classification approach is processed as training phase and testing phase. Based on the typical image characteristics, training class is created. The testing phase is used for the feature-space partitions.
The description of training classes is an extremely important component of the classification process. In supervised
classification, statistical processes (i.e.based on an a priori knowledge of probability distribution functions)
or distribution-free processes can be used to extract class descriptors. Unsupervised classification relies
on clustering algorithms to automatically segment the training data into prototype classes. While creating the training
ISSN(Online): 2319-8753 ISSN (Print): 2347-6710
I
nternational
J
ournal of
I
nnovative
R
esearch in
S
cience,
E
ngineering and
T
echnology
(A High Impact Factor, Monthly, Peer Reviewed Journal) Visit: www.ijirset.com
Vol. 8, Issue 5, May 2019
Figure 3 – Classification of Features
A convenient way of building a parametric description of this sort is via a feature vector , where n is
the number of attributes which describe each image feature and training class. This representation allows us to consider
each image feature as occupying a point, and each training class as occupying a sub-space (i.e. a representative point
surrounded by some spread, or deviation), within the n-dimensional classification space. Viewed as such, the
classification problem is that of determining to which sub-space class each feature vector belongs.
5. CLASSIFICATION
This classification result gives the details about breast cancer and non cancer. To get the spitted part from the k means segmentation result. Above the result which is used to find the cancer and non cancer cells from this module.
After extracting the pertinent feature, the final stage is to classify the attained data and assign it to a particular class. For this purpose, classifiers like Support Vector Machine, Decision tree, KNN are used.
IV. RESULTS & DISCUSSION
In the existing methods, the problems which are identified are listed as follows. 1) The deformation parameters are not permitted to do direct derivation. 2) The accuracy rate is poor. 3) Segmentation process is more difficult to understand. 4) Occurrence of image and pattern recognition issues. To overcome these issues, in the proposed work, LBP method is implemented. LBP method is the combination of linear discriminant and principal component analysis.
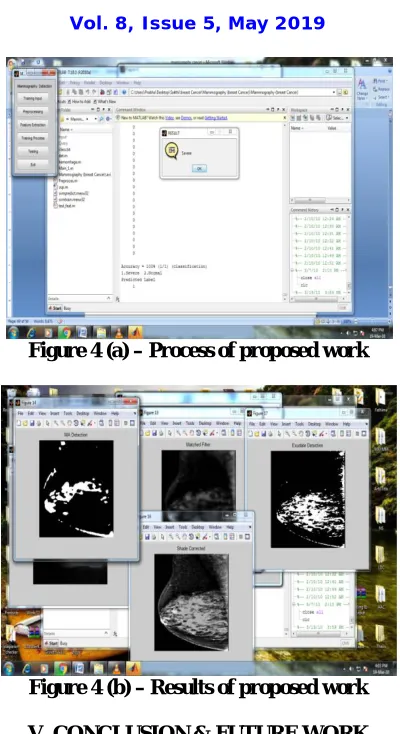
This paper focuses upon the detection of a tumor in the breast from mammogram images. By utilizing various image processing techniques such as segmentation, Binarization, thinning, triangulation and EDT, the demarcation of the tumor in the mammogram is obtained. The following results shows the output received after each step in the algorithm. For our proposed work 10 normal images and 20 tumor affected images are taken as input images and their features are extracted and the classification results are shown below.
This paper presents techniques that are required to achieve an automatic classification system to diagnosis the presence of the Breast cancer from Mammography.
ISSN(Online): 2319-8753 ISSN (Print): 2347-6710
I
nternational
J
ournal of
I
nnovative
R
esearch in
S
cience,
E
ngineering and
T
echnology
(A High Impact Factor, Monthly, Peer Reviewed Journal) Visit: www.ijirset.com
Vol. 8, Issue 5, May 2019
Figure 4 (a) – Process of proposed work
Figure 4 (b) – Results of proposed work
V. CONCLUSION & FUTURE WORK
In this paper, the various steps involved in automatic tumor detection were implemented. The proposed approach in this paper with images processed and classification proved via its performance such as Sensitivity is 100%, Specificity is 100% and its accuracy in classification is 99.66%. Our system gives the better performance when compared existing method, so it is very helpful to the medical people in detecting tumor in breast. Also these proposed algorithms can help rural people to find out the tumor occurrence in mammogram image in case of emergency situations. The purpose of this algorithm is to provide a useful advice to the end user, not to give a final decision concerning presence of cancerous changes in an image. Our system has potential of improving physician diagnostic performance.
FUTURE PERSPECTIVES
Future we are in corporating the above algorithm for genetic algorithm that mimics the evolution method within the nature could be a heuristic search technique to get the optimum answer in an exceeding immense solution. This work will incorporate on extraction of the clinical utility of mammogram image.
REFERENCES
ISSN(Online): 2319-8753 ISSN (Print): 2347-6710
I
nternational
J
ournal of
I
nnovative
R
esearch in
S
cience,
E
ngineering and
T
echnology
(A High Impact Factor, Monthly, Peer Reviewed Journal) Visit: www.ijirset.com
Vol. 8, Issue 5, May 2019
[3] S. Serbouti, A. Duhamel, H. Harms, U. Gunzer, J. Mary, and R. Beuscart, “Image segmentation and classification methods to detect leukemias,” in Proc. Int. Conf. IEEE Eng. Med. Biol. Soc., 1991, pp. 260–261.
[4] D. Foran, D. Comaniciu, P. Meer, and L. A. Goodell, “Computer-assisted discrimination among malignant lymphomas and leukemia using im-munophenotyping, intelligent image repositories, and telemicroscopy,” IEEE Trans. Inf. Technol. Biomed., vol. 4, no. 4, pp. 265–273, Dec. 2000. [5] K. S. Kim, P. K. Kim, J. J. Song, and Y. C. Park, “Analyzing blood cell image do distinguish its abnormalities,” inProc. ACM Int. Conf. Multim., 2002, pp. 395–397.
[6] G. Ongun, U. Halici, K. Leblebicioglu, V. Atalay, M. Beksac, and S. Beksac, “Feature extraction and classification of blood cells for an automated differential blood count system,” inProc. IJCNN, 2001, vol. 4, pp. 2461–2466.
[7] S. Mohapatra and D. Patra, “Automated leukemia detection using haus-dorff dimension in blood microscopic images,” inProc. Int. Conf. Emerg. Trends Robot Commun. Technol., 2010, pp. 64–68.
[8] S. Mohapatra, S. Samanta, D. Patra, and S. Satpathi, “Fuzzy based blood image segmentation for automated leukemia detection,” inProc. ICDeCom, 2011, pp. 1–5.
[9] S. Mohapatra, D. Patra, and S. Satpathi, “Image analysis of blood mi-croscopic images for acute leukemia detection,” inProc. IECR, 2010, pp. 215–219.