DOI: 10.1051/forest:2006073
Original article
Genetic variation and genotype by environment interactions
of juvenile wood chemical properties in
Pinus taeda
L.
Robert S
a, Bailian L
a*, Fikret I
a, John K
b, H.-M. C
caDepartment of Forestry and Environmental Resources, North Carolina State University, College of Natural Resources,
Raleigh, NC 27695-8002, USA
bForest Sciences Centre, University of British Columbia, Vancouver, BC, V6T 1Z4, Canada
cDepartment of Wood and Paper Science, North Carolina State University, Raleigh, NC 27695-8005, USA
(Received 31 October 2005; accepted 13 February 2006)
Abstract –Genetic variation and genotype by environment interaction (G×E) were studied in several juvenile wood traits of 11 year-old loblolly pine trees (Pinus taedaL.). Wafer thin (200µm) samples from juvenile (ring 3) and transition (ring 8) wood of 12 mm increment cores were analyzed. Transition wood had higherα-cellulose content (46.1%), longer fiber (1.98 mm), and higher coarseness (0.34), but lower lignin (29.7%) than juvenile wood (cellulose 40.9%, fiber length 1.4 mm, coarseness 0.28 and lignin 30.3%). General combining ability variance for the traits explained 2% to 10% of the total variance, whereas the specific combining ability variance was negligible, except forα-cellulose content in transition wood (2%). Specific combining ability by site interaction variance explained from 5% (fiber length) to 37% (lignin) of the total variance. Weak individual-tree heritabilities were found for all the traits, except coarseness, which was moderately high in both juvenile (0.39) and transition wood (0.30). Full-sib and half-sib family heritabilities of traits ranged 0.29 to 0.72. Genetic correlations of wood quality traits with volume and stem straightness were weak, while favorable genetic correlations of lignin with cellulose, coarseness and fiber length were observed. Implications on forest tree improvement programs were discussed.
heritability/genetic correlation/α-cellulose/coarseness/lignin
Résumé – Variabilité génétique et stabilité génotype-environnement pour les propriétés chimiques du bois à un stade juvénile chezPinus taeda L. La variabilité génétique et la stabilité génotype-environnement (G×E) ont été étudiées pour plusieurs caractéristiques du bois juvénile de pins taeda (Pinus taedaL.) âgés de 11 ans. De petits échantillons de bois de 2 mm d’épaisseur ont été extraits de carottes de sondage (12 mm), dans le bois juvénile (cerne 3) et dans la zone de transition (cerne 8). Le bois de transition a une teneur enα-cellulose plus élevée, des fibres plus longues (1,98 mm) et une grosseur de grain plus élevée (0,34) mais une teneur en lignine (29,7 %) plus faible que le bois juvénile (teneur en cellulose : 40,9 %, longueur des fibres : 1,4 mm, grosseur du grain : 0,28 et teneur en lignine : 30,3 %). La variance des aptitudes générales à la combinaison (AGC) explique entre 2 et 10 % de la variance totale, tandis que la variance des aptitudes spécifiques à la combinaison (ASC) est négligeable, excepté pour la teneur en
α-cellulose dans la zone de transition (2 %). La variance de du terme d’interaction SCA-site explique de 5 % (longueur de fibres) à 37 % (teneur en lignine) de la variance totale. Les héritabilités au sens strict sont faibles pour tous les caractères sauf pour la grosseur du grain. Pour ce caractère, elle est modérément élevée dans le bois juvénile (0,39) et dans la zone de transition (0,30). Les héritabilités au niveau moyennes de familles de pleins-frères et de demi-frères varient de 0,29 à 0,72 pour ces caractères. Les corrélations génétiques entre propriétés du bois d’une part et le volume et la rectitude du tronc d’autre part sont faibles ; elles sont favorables entre teneur en lignine et teneur en cellulose, grosseur du grain et longueur de fibre. Les implications pour l’amélioration génétique de l’essence sont ensuite discutées.
héritabilité/corrélation génétique/α-cellulose/fibre/grosseur du grain/lignine
1. INTRODUCTION
Genetic improvement and intensive silviculture of loblolly pine (Pinus taedaL.) have increased forest plantation produc-tivity significantly in the southern United States [6]. With im-proved growth, rotation ages have been reduced to about 20 to 25 years compared with 40 to 50 years in natural stands. Consequently, the percent of juvenile wood from plantations has increased [11] mainly because of faster growth and early harvesting. Juvenile wood typically has less desirable wood properties than mature wood, e.g., lower wood density, shorter
* Corresponding author: [email protected]
tracheid length, and higher lignin content. These wood prop-erties are associated with low pulp yield and high pulping costs [8, 12, 14]. However, if there is large genetic variation in these juvenile wood properties in loblolly pine, it may be possible to improve the juvenile wood for solid and chemical wood products through a recurrent breeding program.
Sykes et al. [14] reported large genetic variation in certain wood properties in loblolly pine. Considerable genetic vari-ation inα-cellulose content, average fiber length, and lignin content have also been reported in juvenile wood for loblolly pine and for several other tree species [1, 8, 12, 13, 18]. How-ever, there is little information on how genotypes interact with different environments for these same wood properties. It is
can be planted in different environments. Such information would benefit tree improvement programs of loblolly pine and the pulp and paper industry by allowing the selection and planting of suitable trees on suitable sites. If G×E is deemed to be negligible, then selected genotypes could be used for plantations to produce uniform wood under different environ-mental conditions. This would increase yield, improve product properties, and lower pulping costs [19].
The propose of this study was to determine the level of ge-netic variation of key juvenile wood properties in loblolly pine on four test sites and examine G×E interaction. Specific objec-tives were (1) to compare genetic variation inα-cellulose con-tent, fiber length, coarseness, and lignin content on four field test sites, (2) examine G×E interaction of the same traits, and (3) study relationships between growth, stem quality, wood density with these additional wood traits.
2. MATERIALS AND METHODS
2.1. Materials and data collection
Fourteen full-sib families generated by a 6-parent half-diallel mat-ing design were tested on four sites in South Carolina, in the south-eastern USA. Sites 1 and 2 were established on a relatively fertile soil in 1989. Sites 3 and 4 were established one year later on sandy soils with lower fertility. The average rainfall and temperatures do not vary between sites because of their close proximities and landscape. A randomized complete block design with six blocks was used in the field. Each full-sib family was laid out in 6-tree row-plots in each block. Wood core samples were collected from every healthy (disease free, dominant or co-dominant) tree in the row-plot when the trees were 11-year-old. Bark to bark 12 mm increment cores were taken from each tree at breast height (about 1.30 m above ground) using generator-powered drills. Wood cores having visible limbs, curves, resin pockets, or compression wood were avoided. The samples were placed in sealed plastic storage bags and stored in coolers to retain moisture during the material collection. At the time of wood incre-ment collection height, diameter or stem straightness were not mea-sured but sixth-year values of these traits were available.
In the laboratory, the bark and cambium were removed from the wood cores, and the cores were split at the pith into two radii. Non-volatile extractives greater than 95% were removed from increment cores by four successive two-day acetone extractions [17]. The incre-ment cores were then soaked in water overnight before ring wood samples were taken. Within-core samples were taken from ring 3 and ring 8 from the pith to study chemical properties of juvenile wood (ring 3) and transition wood (ring 8), respectively. Thin wafers (200µm) from earlywood and latewood of ring 3 and ring 8 were taken using a microtome. At least 300 mg of each sample were taken from the earlywood and latewood of each ring. Each sample was oven-dried for 12 h [14]. Chemical analysis ofα-cellulose and lignin content, fiber length and coarseness was done using microanalytical techniques developed by Yokoyama et al. [17], which allows the rapid characterization of fiber components and morphology of loblolly pine
2.2. Statistical analyses
Juvenile wood and transition wood were compared for micro wood traits using the paired t-tests. A general linear mixed model was fitted to data to estimate variance components for combined sites.
y=Xβ+Zγ+ε (1)
where,yis the vector of individual observations, βis the vector of fixed-effects parameters (overall mean, site, and blocks within site),
γis the vector of random-effects parameters including general com-bining ability (GCA) for female and male, specific comcom-bining ability (SCA), GCA by site interaction, SCA by site interaction, and plot-to-plot error. Theεis an unknown random error vector;XandZare known design matrices for fixed and random effects, respectively. The variance of theYvector isV=V(Y)=ZGZT+R[7]. The random fac-tors (γ) and the errors (ε) are assumed to have normal distributions. Thus, the random effects are assumed to have 0 mean andGdiagonal variance-covariance matrix. Similarly, the errors assumed to have 0 mean andRvariance-covariance matrix (R =σ2I
n). The diallel ge-netic analyses were carried out using a general linear mixed model and implementing with the SAS Mixed procedure [16]. Using vari-ance components from the mixed model, individual-tree (h2
i), half-sib family (h2
hs), and full-sib family (h
2
f s) heritabilities were estimated for the wood properties as follows:
h2
i =
4σ2 g
2σ2
g+σ2s+2σ2gl+σ
2
sl+σ
2
plot+σ2e
(2) h2 hs= σ2 g pσ2
g+σ2s+ pσ2
gl t + σ2 sl t + σ2 plot tb + σ2 e tbn 1 (p−1)
(3)
h2f s=
2σ2 g
2σ2 g+σ2s+
2σ2
gl t + σ2 sl t + σ2 plot tb + σ2 e tbn (4)
where,σ2
gis the GCA variance,σ2s is the SCA variance,σ
2 gl andσ
2
sl are the GCA by site and SCA by site interactions,σ2
plotis the plot variance,σ2
eis the residual variance,tis the number of sites (t=4), bis the number of blocks within sites (b = 6),pis the number of parents (p=6) andnis the harmonic mean number of trees within plot (n=2.83). Standard errors of heritabilities were estimated by the Delta Method [9]. Individual-tree breeding values were estimated by adding parental general combining ability estimates to the estimated within-family value (Aw). Within-family value (Aw) for each tree is obtained from solving the mixed model equation asy−Xβ−Zγand adjusting by approximate within-family heritability (2σ2
g/σ2e). Product-moment correlations were estimated among the wood properties, stem straightness, and growth traits. Approximate genetic correlations among traits were calculated using individual-tree breed-ing values of the wood properties. Hypothesis test (H0:rp =0,H0:
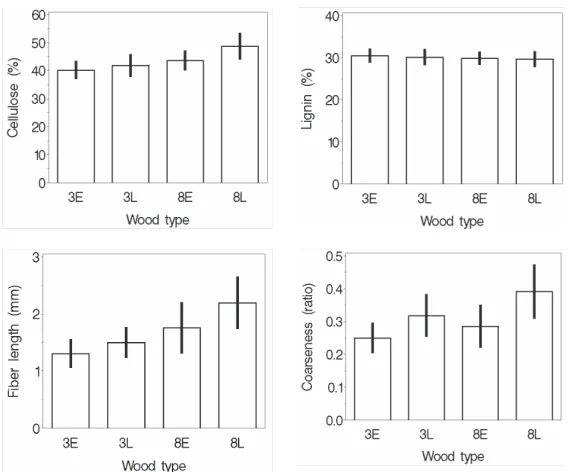
Figure 1.α-cellulose (%), lignin (%), fiber length (mm) and coarseness means for ring 3 and ring 8 from the pith. E and L stands for earlywood and latewood within each ring, respectively. The thick horizontal bars in the middle of the boxes are the standard deviations.
Table I.Comparisons of juvenile (ring 3) and transition (ring 8) wood forα-cellulose (ACY), lignin (LIG), fiber length (FLW) and coarseness (COA) of loblolly pine across four sites.
Variable Ring 3 (mean±SE) Ring 8 (mean±SE) 1DF tValue 1P>|t|
ACY (%) 40.9±0.09 46.1±0.12 3347 –35.7 <0.0001
LIG (%) 30.3±0.04 29.7±0.04 3702 9.4 <0.0001
FLW (mm) 1.40±0.006 1.98±0.012 2715 –42.5 <0.0001
COA (ratio) 0.28±0.0015 0.34±0.0022 3091 –20.6 <0.0001
1DF is the degrees of freedom for the pairedttest,P>|t|is the probability oftstatistic.
in equation (1). Type B correlation (rB_gca) for a trait was estimated using the additive genetic variance and genotype by environment in-teraction variance as follows:
rB_gca= σ2
g
σ2 g+σ2gl
. (5)
A correlation coefficient close to 1.0 indicates no interaction, whereas small coefficients indicate significant rank changes among the geno-types from one location to another.
3. RESULTS
Sites were significantly different for α-cellulose content (P>0.001) and coarseness (P<0.01) but not for lignin
con-tent (P=0.888) and fiber length (P<0.582). Faster growing
sites 1 and 2 had smaller coarseness than the slower grow-ing sites 3 and 4. There was inconsistency between the rate of sites’ growth and α-cellulose content (data were not pre-sented). The fastest growing site 2 located at the river bed had significantly smaller cellulose content (41.4%) compared to the slower growing site 4 (46.4%).
3.1. Comparison of wood types
Alpha cellulose content (%), fiber length (mm), and coarse-ness based on across sites increased from the earlywood to latewood within a ring (Fig. 1). In contrast, lignin content (%) did not change. Transition wood (ring 8) had significantly (P >0.0001) greater percentage ofα-cellulose, longer fiber,
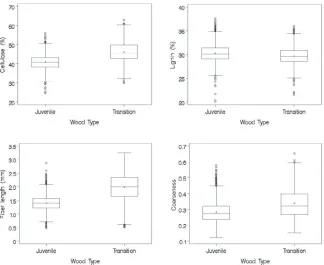
greater coarseness, and less lignin than juvenile wood (ring 3) (Tab. I). Transition wood had about 5.2% more α-cellulose than juvenile wood. The difference between two wood types for lignin content was less than 1% but still significant. Tran-sition wood had about 0.58 mm longer fibers than juvenile wood. We observed two distinct variation patterns for the ju-venile and transition wood (Fig. 2). Variation inα-cellulose, coarseness, and fiber length was greater in transition wood than in juvenile wood. In contrast, variation in lignin content was similar for the two wood types.
3.2. Genetic parameters
Figure 2.Variation inα-cellulose (%), lignin (%), fiber length (mm) and coarseness for the juvenile (ring 3) and transition wood (ring 8) across four sites. The thick horizontal bars in the middle of the boxes are the median; lower and upper edges of the boxes are quartiles. The circles are extreme values.
genetic effects (σ2
g) explained 3% (lignin and fiber length) to 10% (coarseness) of the total phenotypic variance for the ju-venile wood. Non-additive genetic effects were zero for all the traits for juvenile wood. Surprisingly, very high percentage of phenotypic variance for the traits was explained by specific combining ability by site interaction effects, except for fiber length. Whereas, general combining ability by site interaction variances for the traits were negligible or zero.
The range of additive effects for micro wood traits in the transition wood was 2% to 7%. Additive genetic effects in tran-sition wood were smaller forα-cellulose and coarseness, but were higher for lignin and fiber length compared to the ju-venile wood. Non-additive genetic effects for cellulose (2%) were as high as the additive genetic effects in the transition wood. Non-additive genetic effects for lignin and coarseness in transition wood were zero or negligible. Similar to juve-nile wood, we also observed high non-additive genetic by site interaction variances for all four micro wood traits for the tran-sition wood.
Heritabilities for juvenile and transition wood are presented in Table II. Coarseness was the most heritable trait among the four studied wood traits. Weak individual–tree heritabilities were found forα-cellulose, lignin and fiber length for the ju-venile wood.α-cellulose had lower individual-tree and family mean heritabilities for transition wood than for juvenile wood. In contrast, heritabilities of lignin were higher in the transition wood than in juvenile wood. Fiber length and coarseness had similar heritability for both wood types. All the heritability es-timates were associated with high standard errors.
3.3. Genotype by environment interaction
General combining ability by site interaction variance (σ2 gl) was zero for the α-cellulose and coarseness for the juvenile wood (Tab. II). For lignin content, the σ2
gl explained 3% of the total phenotypic variance while it was negligible for fiber length (1%). Transition wood had considerable σ2
gl variance for lignin (5%) and coarseness (6%) but was zero for α-cellulose and fiber length. Specific combining ability by site interaction variance (σ2
sl) was very high for all traits in both juvenile and transition wood. The σ2
sl explained 5% (fiber length) to 37% (lignin) of the total phenotypic variance at ju-venile wood. The range of the specific combining ability by site interaction variance for the transition wood was from 10% (fiber length) to 32% (lignin).
Table II.Variance components (Estimate) explained by each random effect, the percentage over the total variance, individual-tree (h2
i), full-sib family (h2
f s) and half-sib family (h
2
hs) means heritabilities (±standard error) for micro wood traits of juvenile wood and transition wood of loblolly pine from combined sites analysis.
(a) Juvenile wood (ring 3)
Estimate α−Cellulose % Lignin % Fiber length % Coarseness %
σ2
g 0.29 4 0.08 3 0.0016 3 0.00021 10
σ2
s 0 0 0 0 0 0 0 0
σ2
gl 0 0 0.08 3 0.0006 1 0 0
σ2
sl 1.80 23 1.01 37 0.0026 5 0.00068 31
σ2
plot 1.30 17 0.12 4 0.0079 15 0.00025 11
σ2
e 4.41 57 1.44 53 0.0398 76 0.00103 47
h2
i 0.15±0.14 0.12±0.17 0.12±0.10 0.39±0.28
h2
f s 0.50±0.25 0.35±0.33 0.63±0.22 0.68±0.19
h2
hs 0.63±0.40 0.47±0.43 0.66±0.40 0.72±0.42
(b) Transition wood (ring 8)
Estimate α−Cellulose % Lignin % Fiber length % Coarseness %
σ2
g 0.25 2 0.14 6 0.0059 4 0.00026 7
σ2
s 0.27 2 0 0 0.0009 1 0 0
σ2
gl 0 0 0.13 5 0.0007 0 0.00020 6
σ2
sl 3.26 28 0.81 32 0.0159 10 0.00071 20
σ2
plot 1.47 13 0.06 2 0.0236 15 0.00032 9
σ2
e 6.49 55 1.37 54 0.1096 70 0.00201 57
h2
i 0.09±0.13 0.23±0.24 0.15±0.13 0.30±0.26
h2
f s 0.29±0.37 0.49±0.29 0.60±0.28 0.62±0.24
h2
hs 0.46±0.46 0.56±0.41 0.67±0.41 0.62±0.39
Table III.Type B additive (rB_gca) genetic correlations forα-cellulose, lignin, fiber length, and coarseness for the juvenile wood (ring 3), transition wood (ring 8) and for the combined wood from combined sites analysis.
Wood Type α−Cellulose Lignin Fiber length Coarseness
Juvenile wood 1.00 0.51 0.72 1.00
Transition wood 1.00 0.52 0.89 0.56
Combined 1.00 0.53 0.95 0.77
3.4. Product-moment phenotypic and additive genetic correlations
Product-moment correlations between pairs of micro wood traits are presented in Table IV. The relationships of lignin with the other three traits were all negative but favorable. As α-cellulose content, fiber length and coarseness increase lignin content decreases. Alpha cellulose had positive correlations with fiber length (0.57) and coarseness (0.47). The relationship between fiber length and coarseness was also positive. All the product-moment correlations were significantly different from zero (P<0.001).
Wood traits were not genetically correlated with growth, stem straightness, or fusiform rust disease infection. However, additive genetic correlations between micro wood traits were moderately high and significantly different from zero both for juvenile and transition wood (Tab. V). The signs of the genetic
Table IV. Product-moment (phenotypic) correlations between α -cellulose, lignin, fiber length and coarseness for combined juvenile and transition wood across four sites.
Lignin Fiber length Coarseness
α−cellulose –0.21*** 0.57*** 0.47***
Lignin –0.20*** –0.24***
Fiber length 0.41***
*** Correlations are significant at 0.001 probability level respectively. Number of observations used ranged from 515 to 550.
ACY 0.69*** 0.50*** –0.73*** 0.01 –0.01 –0.01 0.00
COA 0.67*** 0.37*** –0.53*** 0.02 –0.03 –0.01 0.00
FLW 0.50*** 0.34*** –0.74*** 0.01 0.00 –0.01 0.00
LIG –0.73*** –0.52*** –0.73*** –0.02 –0.02 0.01 –0.01
HT6 –0.01 0.00 –0.01 0.01 0.78*** 0.00 –0.09***
VOL6 –0.03 0.01 –0.02 0.01 0.78*** 0.06* –0.02
RUST6 0.00 –0.01 0.00 0.00 –0.01 –0.07** 0.14***
STRT6 –0.02 –0.01 –0.02 0.00 –0.09*** –0.03 0.14***
*, **, *** Approximate genetic correlations are significant at 0.05, 0.01, and 0.001 probability level respectively. Number of observations used ranged from 515 to 550.
juvenile and transition wood were similar in magnitude and in direction.
4. DISCUSSION
4.1. Wood types
Latewood within a growth ring of loblolly pine had more desirable micro wood properties than earlywood. Latewood appeared to be more desirable becauseα-cellulose content was higher and lignin content was lower than earlywood. In addi-tion, longer fibers and higher coarseness makes latewood de-sirable for solid wood products when compared to earlywood. The results based on combined four sites from this study were parallel to the results by Sykes et al. [14] that were based on limited sample size from one site. Genetic selection based on percentage of latewood in a growth ring could be an effective way to manipulate chemical and morphological wood proper-ties. The difference between earlywood and latewood within transition wood (ring 8) was more pronounced forα-cellulose content and fiber length compared the difference within juve-nile wood (ring 3).
Juvenile wood (ring 3) was less desirable for the micro wood traits compared to transition wood (ring 8). Ring 8 from the pith of trees at breast height can be considered transition wood rather than mature wood for loblolly pine [15]. There was an apparent increasing trend ofα-cellulose content, fiber length, and coarseness from juvenile wood to transition wood. We observed a slight decrease of lignin content from juvenile wood to transition wood.
Considerable variation in the wood properties was found between juvenile and transition wood, except for lignin con-tent (Fig. 2). The results suggested that non-additive genetic effects were negligible for wood traits, and these traits are mainly controlled by the additive genetic effects. Genetic vari-ation inα-cellulose content was higher than that found by Jett et al. [5], with both additive and dominance genetic compo-nents. Selection against lignin content or selection for longer fiber and higher α-cellulose content through breeding could yield modest genetic gains due to weak heritabilities. Selec-tion based on half-sib or full-sib family means may be more
efficient to improve micro wood traits compared to mass se-lection.
The results suggested that genetic improvement for α-cellulose content and coarseness may be realized based on transition wood because phenotypic variation was higher for transition wood than juvenile wood. Transition wood her-itabilities may be more meaningful than those of juvenile wood, as they are closer to the age (6-year from planting) when most selections are made within the North Carolina State University-Industry Cooperative Tree Improvement Pro-gram [6]. The heritabilities based on combined sites were un-biased and lower than those from Sykes et al. [14], because genotype by site interaction was taken into account in these es-timations. Individual-tree heritabilities for fiber length in this study were lower than those found by Loo et al. [8]. However, we estimated greater family-means heritability for fiber length compared to Loo et al. [8] (Tab. I). They reported 0.31 and 0.37 individual-tree, and 0.45 and 0.51 family heritabilities for transition wood fiber length at four sites.
Standard errors of all the heritabilities were high. This could be mainly due to the limited number of parents in the ex-periment and possible random genetic drift in the sampling [4]. The laboratory measurements techniques may need improve-ment for more reliable estimate of micro wood traits [17]. The results reported in this study should be considered cautiously and may be repeated with greater sampling size of parents. Isik et al. [4] reported considerable variation in heritability es-timates from different diallel groups of the same breeding pop-ulations of loblolly pine, ranging between theoretical limits (0, 1). Measurement of wood traits is costly and time consum-ing. Unless laboratory measurement techniques are improved, it is costly to increase sample size for more reliable estimation of genetic parameters.
4.2. Correlations
content or fiber length could decrease lignin content in a selec-tion program of loblolly pine. Increasingα-cellulose content may result in the production of more paper per cubic meter of wood, less lignin, and more efficient pulping and bleaching. However, before considering one or two wood traits for breed-ing and selection, more efforts are needed. Tree improvement programs should decide which traits will be of most impor-tance in the future before incorporating them into their breed-ing programs.
We used correlations between individual-tree breeding val-ues as approximate genetic correlations for micro wood traits. Best-linear unbiased predicted individual-tree breeding values are the sum of the parental genetic contribution and fixed ef-fects adjusted within-family values. Broad surveys of literature suggested that genetic and product-moment phenotypic corre-lations have the same sign and even the magnitude [2, 9]. Our finding also confirmed the relationships of phenotypic and ge-netic correlations reported in the literature. For example, phe-notypic and approximate genetic correlations of lignin content with three other micro wood traits were all negative. Approx-imate genetic correlations were higher than phenotypic corre-lations. Correlations between breeding values could easily be used as approximate genetic correlations [9]. One of the ad-vantages of correlations based on breeding values is that test-ing the significance is straightforward as they are conventional product-moment correlations.
4.3. Genotype by site interactions
Theoretically, type B genetic correlations range between 0.0 and 1.0. High correlation coefficients indicate lack of geno-type by environment interactions. There was essentially no site by general combining ability interactions forα-cellulose for juvenile and transition wood, mainly because of zero gen-eral combining ability by site interaction variances. The results suggested that parent trees do not interact noticeably with dif-ferent sites forα-cellulose. In contrast, for lignin content there was noticeable general combining ability by site interaction. Genotypes by site interactions were negligible for fiber length and coarseness. Although the test sites are not far from each other, they differed significantly for growth traits because of different soil fertility. The lack of genotype by environment in-teractions suggested that, genotypes improved forα-cellulose, fiber length and coarseness could be deployed over a wide range of locations in the Piedmont region of the southern USA. Relatively high specific combining ability by site interac-tion variances were observed for all wood traits (Tab. II). The percentage of specific combining ability by site interaction variance ranged between 20 to 37% for all traits, except fiber length for juvenile wood. Our results suggested that loblolly pine full-sib families were less stable across different site con-ditions than half-sib families for these wood properties. If site by specific combining ability interactions continue to be im-portant, as shown in this study, breeding for full-sib family deployment strategy may be considered for the improvement of micro wood traits. However, this difference between half-sib and full-half-sib family may be due to different sample size and
relatively large measurement error of these traits in the labora-tory. In addition, lack of non-additive genetic effects (except α-cellulose for transition wood) may indicate that rank changes of full-families from one site to another could be mainly due to the environmental noise. Isik et al. [4] reported a wide range of type B genetic correlations for height from different diallel groups of the same breeding population. They suggested that the variation in variance estimates from diallels could be due to sampling and random genetic drift.
5. CONCLUSION
Wood traits were mainly under additive genetic con-trol. Non-additive genetic effects appeared to be negligible. Individual-tree heritabilities were generally weak, but family heritabilities were moderate. General combining ability by site interaction forα-cellulose was zero. Specific combining abil-ity by site interaction variance was high for all the traits, ex-plaining up to 30% of the total phenotypic variance. Chem-ical wood traits had weak relationships with height growth, volume, and stem straightness. Genetic correlations of lignin withα-cellulose and fiber length were moderately high and favorable (negative); suggesting that selection forα-cellulose content or for fiber length may lead to a decrease in lignin con-tent in breeding populations of loblolly pine. The results from this study were based on a small number of parents (n=12). Further research is needed to fully understand the genetic ba-sis of chemical wood traits and their potential for inclusion in tree improvement programs.
Acknowledgements: This study was supported a grant from the De-partment of Energy (Grant DE-FC36-01GO10624), NCSU-Industry Cooperative Tree Improvement Program, Department of Forestry, and Department of Wood and Paper Sciences at NC State University.
REFERENCES
[1] DeBell J.D., Gartner B.L., DeBell D.S., Fiber length in young hy-bridPopulusstems grown at extremely different rates, Can. J. For. Res. 28 (1998) 603–608.
[2] Falconer D.S., Mackay T.F., Introduction to quantitative genetics, Prentice Hall Harlow, England, 1996.
[3] Gwaze D.P., Wolliams J.A., Kanowski P.J., Bridgwater F.E., Interactions of genotype with site for height and stem straightness inPinus taedain Zimbabwe, Silvae Genet. 50 (2001) 135–140. [4] Isik F., Boos D.D., Li B., The distribution of genetic parameter
es-timates and confidence intervals from small disconnected diallels, Theor. Appl. Genet. 110 (2005) 1236–1243.
[5] Jett J.B., Weir R.J., Barker J.A., The inheritance of cellulose in loblolly pine, TAPPI Forest Biology Conference Proceedings, TAPPI Press, Madison 1977.
[6] Li B., McKeand S., Weir R., Tree improvement and sustainable forestry – impact of two cycles of loblolly pine breeding in the USA, For. Genet. 6 (1999) 229–234.
[7] Littell R.C., Milliken G.A., Stroup W.W., Wolfinger R.D., SAS System for Mixed Models, SAS Institute Inc. Cary, NC, 1996. [8] Loo J.A., Tauer C.G., McNew R.W., Genetic-variation in the time
[11] Pearson R.G., Gilmore R.C., Effect of fast growth-rate on the mechanical-properties of loblolly-pine, For. Prod. J. 30 (1980) 47–54.
[12] Shupe T.F., Choong E.T., Yang C.H., The effects of silvicul-tural treatments on the chemical composition of plantation-grown loblolly pine wood, Wood Fiber Sci. 28 (1996) 295–300.
[13] Shupe T.F., Hse C.Y., Choong E.T., Groom L.H., Differences in some chemical properties of innerwood and outerwood from five silviculturally different loblolly pine stands, Wood Fiber Sci. 29 (1997) 91–97.
[16] Xiang B., Li B., A new mixed analytical method for genetic analysis of diallel data, Can. J. For. Res. 31 (2001) 2252–2259.
[17] Yokoyama T., Kadla J.F., Chang H.-M., Microanalytical method for the characterization of fiber components and morphology of woody plants, J. Agric. Food Chem. 50 (2002) 1040–1044.
[18] Yu Q., Pulkkinen P., Rautio M., Haapanen M., Alen R., Stener L.G., Beuker E., Tigerstedt P.M., Genetic control of wood physicochemi-cal properties, growth, and phenology in hybrid aspen clones, Can. J. For. Res. 31 (2001) 1348–1356.
[19] Zobel B., The changing quality of the world wood supply, Wood Sci. Technol. 18 (1984) 1–17.