ABSTRACT
GARNER, ALAN BRAD. High-Density Grass Carp Stocking Effects on a Reservoir Invasive Plant, Water Quality, and Native Fishes. (Under the direction of Dr. Thomas J. Kwak).
Stocking grass carp Ctenopharyngodon idella is a commonly applied technique used to control nuisance aquatic vegetation in reservoirs. Factors that influence the degree of aquatic vegetation control are stocking density, regional climate, abundance and species composition of the aquatic plant community, and relative grass carp feeding preferences for the plant species. We evaluated high-density grass carp stocking in a reservoir for control of parrot-feather (Myriophyllum aquaticum, an invasive aquatic plant that is not preferentially consumed by grass carp) and the associated effects on water quality and native fishes. Lookout Shoals Lake, a piedmont North Carolina reservoir, was stocked with triploid grass carp at a density of 100 fish per vegetated hectare. Parrot-feather biomass in the lake was significantly reduced three months after grass carp stocking, compared to biomass in in-situ exclosures. During the second year after grass carp stocking, parrot-feather biomass in the lake compared to biomass in in-situ exclosures indicated continued control, but unexplained lack of growth within most experimental exclosures precluded biomass analyses. Increases in ambient water chlorophyll a, reactive phosphorus, and nitrate-nitrite concentrations were measured after grass carp stocking. We evaluated the native fish community using seasonal shoreline electrofishing before and after grass carp stocking. Total catch (by number or biomass) for all fish species in aggregate at shoreline transects was not significantly different after grass carp stocking. Catch rates of largemouth bass Micropterus salmoides, bluegill
High-Density Grass Carp Stocking Effects on a Reservoir Invasive Plant, Water Quality, and Native Fishes
by
Alan Brad Garner
A thesis submitted to the Graduate Faculty of North Carolina State University
In partial fulfillment of the Requirements for the degree of
Master of Science
Fisheries and Wildlife Sciences
Raleigh, North Carolina 2008
APPROVED BY:
_______________________________ ______________________________
Dr. Joseph E. Hightower Dr. Kenneth H. Pollock
Biography
I was raised, along with one younger brother, by two wonderful parents who imparted compassion, discipline, humility, and a love of nature. My father is a wildlife biologist who enjoys hunting and fishing, and he introduced my brother and me to these activities at an early age. I started fishing with a cane pole for “bream” which I later learned were likely bluegill or redear sunfish. It wasn’t long before I graduated to bass fishing, of which I plan to be a life-long participant and student, especially smallmouth bass fishing. The natural world has always been an important part of my life. Activities like hunting, fishing, or just plain rambling have instilled in me an appreciation and respect for the natural world.
Acknowledgments
Table of Contents
List of Tables ... vi
List of Figures ... viii
Chapter I - High-Density Grass Carp Stocking Effects on a Reservoir Invasive Plant and Water Quality. Introduction and Objectives ...2
Study Area and Aquatic Plant Management ...7
Methods...9
Experimental Exclosure and Vegetation Sampling ...9
Water Quality Sampling ...10
Results ...11
Vegetation ...11
Water Quality ...13
Discussion ...14
Management Implications ...17
Literature Cited ...19
Chapter II - High-Density Grass Carp Stocking Effects on Reservoir Fish Populations. Introduction and Objectives ...38
Study Area and Management ...42
Methods...44
Results ...45
100-m Seasonal Shoreline Electrofishing Transects ...46
List of Tables Chapter I
Table 1 Total submersed vegetation biomass (g/m2) from inside and outside eight experimental exclosures on Lookout Shoals Lake
during July, August, and September of 2005 and 2006 ...26 Table 2 Parrot-feather biomass (g/m2) from inside (In) and outside (Out)
eight experimental exclosures on Lookout Shoals Lake during
July, August, and September of 2005 and 2006 ...26 Table 3 Mean, standard error (in parentheses), and range of water quality
measurements from Lookout Shoals Lake monthly (June-August) in 1997 and 2002 (NCDWQ 2003) prior to grass carp stocking, and in 2005-2006 after grass carp stocking. Within each parameter,
different superscript letters indicate significant differences ...27 Table 4 Mean, standard error (in parentheses), and range of water quality
measurements during spring (April-June), summer (July-September), fall-winter (October, November, January, March) taken at uplake and midlake locations on Lookout Shoals Lake 2005-2007. Within each parameter and season, different
superscript letters indicate significant differences ...28 Table 5 Mean, standard error (in parentheses), and range of water quality
measurements during spring (April-June), summer (July-September), fall-winter (October, November, January, March) taken at uplake and midlake locations on Lookout Shoals Lake 2005-2007. Within each parameter, season, and year, different
superscript letters indicate significant differences ...29 Table 6 Mean, standard error (in parentheses), and range of water quality
measurements during summer (July-September) 2005 and 2006 samples taken inside and outside eight experimental exclosures on Lookout Shoals Lake. Within each parameter and year, different
Table 7 Mean, standard error (in parentheses), and range of water quality measurements during fall-winter (October and November 2005; January, March, October, and November 2006; and, January, and March 2007) samples taken inside and outside eight experimental exclosures on Lookout Shoals Lake. Within each parameter and year group (2005-2006 and 2006-2007), different superscript
letters indicate significant differences ...31 Table 8 Mean, standard error (in parentheses), and range of water quality
measurements during spring (April, May, and June 2006 and April 2007) samples taken inside and outside eight experimental
exclosures on Lookout Shoals Lake. Within each parameter and
year, different superscript letters indicate significant differences ...32 Chapter II
Table 1 Total numbers of fish collected by electrofishing eight, 100-m seasonal shoreline transects on Lookout Shoals Lake during spring,
summer, and fall, 2004-2007 ...65 Table 2 Total numbers of fish collected by electrofishing at ten, 300-m
annual shoreline transects on Lookout Shoals Lake during spring
List of Figures Chapter I
Figure 1 Location of study site, Lookout Shoals Lake, in relation to other
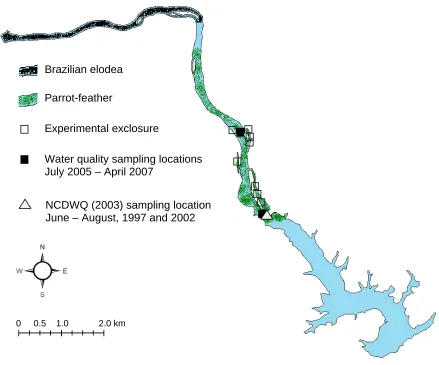
Catawba River reservoirs within North Carolina ...33 Figure 2 Parrot-feather and Brazilian elodea approximate coverage, and
experimental exclosure and water quality sampling locations on
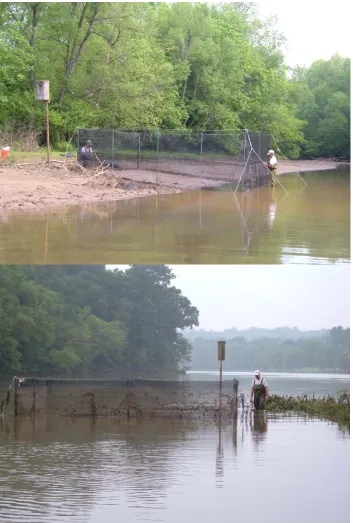
Lookout Shoals Lake, North Carolina ...34 Figure 3 Experimental exclosures (6 m × 6 m × 2 m, 1.3-cm plastic mesh).
The upper photograph was taken during exclosure construction with a 1-m drawdown of Lookout Shoals Lake. Lower photgraph
depicts normal lake level ...35 Figure 4 Mean biomass (kg/m2) of parrot-feather collected from eight
exclosures during July, August, and September on Lookout Shoals Lake, 2005. Different letters indicate significant differences within
months ...36 Chapter II
Figure 1 Location of study site, Lookout Shoals Lake, in relation to other
Catawba River reservoirs within North Carolina ...67 Figure 2 Parrot-feather and Brazilian elodea estimated coverage, locations
of 100-m shoreline electrofishing transects sampled seasonally beginning summer of 2004 and ending spring of 2007, and 300-m shoreline electrofishing transects sampled annually during spring of 1994-1997, 2000, and 2005-2007 on Lookout Shoals Lake,
North Carolina ...68 Figure 3 Catch rate by number (number/100 m) of all species in aggregate,
bluegill, largemouth bass, redbreast sunfish, and yellow perch collected from eight, 100-m seasonal shoreline electrofishing transects during spring, summer and fall on Lookout Shoals Lake, 2004-2007. Common letters indicate catch rates that are not
Figure 4 Biomass (kg/100 m) of all species in aggregate, bluegill, largemouth bass, redbreast sunfish, and yellow perch collected from eight, 100-m seasonal shoreline Electrofishing transects during spring, summer and fall on Lookout Shoals Lake, 2004-2007. Common letters indicate biomass levels that are not
significantly different within all or each species ...70 Figure 5 Length distributions of bluegill collected from eight, 100-m
seasonal shoreline electrofishing transects during fall on Lookout
Shoals Lake 2004-2006...71 Figure 6 Length distributions of yellow perch collected from eight, 100-m
seasonal shoreline electrofishing transects during fall on Lookout
Shoals Lake 2004-2006...72 Figure 7 Relative weight of bluegill, largemouth bass and yellow perch
collected from eight, 100-m seasonal shoreline electrofishing transects during spring, summer and fall on Lookout Shoals Lake 2004-2007. Common letters indicate relative weight values that
are not significantly different within each species ...73 Figure 8 Catch rate by number (number/100-m, above) and biomass
(kg/100-m, below) of all species collected from ten, 300-m annual shoreline electrofishing transects during spring on Lookout Shoals Lake, 1994-2007. Common letters indicate rates that are not
significantly different ...74 Figure 9 Catch rate by number (number/100-m, above) and biomass
(kg/100-m, below) of bluegill collected from ten, 300-m annual shoreline electrofishing transects during spring on Lookout Shoals Lake, 1994-2007. Common letters indicate rates that are not
significantly different ...75 Figure 10 Catch rate by number (number/100-m, above) and biomass
(kg/100-m, below) of largemouth bass collected from ten, 300-m shoreline electrofishing transects during spring on Lookout Shoals Lake, 1994-2007. Common letters indicate rates that are not
Figure 11 Catch rate by number (number/100-m, above) and biomass (kg/100-m, below) of redbreast sunfish collected from ten, 300-m shoreline electrofishing transects during spring on Lookout Shoals Lake, 1994-2007. Common letters indicate rates that are not
significantly different ...77 Figure 12 Catch rate by number (number/100-m, above) and biomass
(kg/100-m, below) of yellow perch bass collected from ten, 300-m shoreline electrofishing transects during spring on Lookout Shoals Lake, 1994-2007. Common letters indicate rates that are not
Introduction
Stocking grass carp Ctenopharyngodon idella is an increasingly employed control technique for the management of nuisance aquatic vegetation and offers several advantages over mechanical or chemical controls in aquatic plant management, including low cost, labor saving, and low risk to public health (Sutton 1977; Rottman 1977; Bailey 1978; Allen and Wattendorf 1987; Cassani 1995; Li and Moyle 1999). Despite these advantages, aquatic vegetation control has not been universally achieved in all grass carp applications. Factors that influence the degree of vegetation control when using grass carp are stocking density (Fowler and Robson 1978), regional climate (Van Dyke et al. 1984; Bonar et al. 1993), abundance and species composition of the aquatic plant community (Prowse 1971; Opuszynski 1972; Van Dyke et al. 1984), and relative grass carp feeding preferences for the plant species (Fowler and Robson 1978). Application of this technique typically involves varying grass carp stocking densities in an effort to achieve the desired amount of vegetation control. High-density grass carp stocking to control persistent nuisance aquatic vegetation is receiving increased attention as an application, but scientific evaluation has been limited. Of particular interest are the degree of vegetation control and the potential impacts to ecosystem processes associated with this control technique.
primarily controlled by natural processes, such as regional climate, herbivory, and
interspecific competition (Holm et al. 1969; Frye 1972; Aulbach-Smith and de Kozlowski 1996). Conversely, invasive plant species often spread unhindered by these same control mechanisms and become a nuisance (Frye 1972; Aulbach-Smith and de Kozlowski 1996). When alien plants naturalize or native plants are released from natural controls, the
ecosystem is always impacted, and in some cases irrevocably (Cronk 1995). Reservoirs are especially susceptible to nuisance aquatic plant infestations.
Stabilized water levels characteristic of reservoir operations are conducive to aquatic plant growth (Leslie et al. 1987), but reservoirs are typically constructed in regions where natural lakes and native aquatic vegetation do not occur (Smart et al. 1998). Reservoir ecosystems are typically in relatively early stages of ecological succession, and establishment of native aquatic vegetation is a slow process, unlike that for nuisance species which invade rapidly and fill the available niche (Boyd 1971; Doyle et al. 1997; Smart et al. 1998).
Stocking grass carp is an important biological management technique for nuisance aquatic plant growth. Grass carp are herbivorous fish native to China and Siberia and can grow to more than 50 kg and survive more than 20 years (Lin 1935; Nikol’skii 1954; Avault 1965; Cross 1969; Bailey and Boyd 1972; Jenkins and Burkhead 1993). Diploid grass carp were introduced to the U.S. for aquatic macrophyte control in 1963 and have been prohibited in many states because they may reproduce and impact native aquatic plant and fish communities (Stevenson 1965; Sills 1970; Sutton 1977; Pflieger 1978; Allen and Wattendorf 1987; Cassani 1995). Since the development of sterile triploid grass carp in 1983, which alleviated some concern over the long-term impacts from establishment of viable grass carp populations, grass carp have become widely used as a control agent for aquatic nuisance vegetation (Bain 1993; Cassani 1996).
While the ability of grass carp to control many aquatic plants has been
Feeding preference for the target plant relative to other aquatic vegetation by grass carp is an important consideration when determining stocking densities for aquatic plant control (Fowler and Robson 1978). Grass carp may not consume a less preferred target plant, opting instead for a preferred plant which can eventually lead to the spread of the target vegetation (Edwards 1974; Vinogradov and Zolotova 1974; Fowler and Robson 1978; Leslie et al. 1987). This is of particular concern if the vegetation preferred by grass carp is native or endemic to the aquatic system (Allen and Wattendorf 1987). Grass carp introduction in this scenario could adversely affect the species composition of the plant community (Vinogradov and Zolotova 1974; Fowler and Robson 1978).
High-density grass carp stocking is a potential management technique for
controlling target plant species that are food sources not preferred by grass carp (Fowler and Robson 1978; Pine and Anderson 1991; Catarino et al. 1997). However, achieving control of aquatic vegetation not preferentially consumed by grass carp with intensive stocking could result in elimination of all aquatic vegetation in the system (Shireman et al. 1985; Kohler and Courtenay 1986; Allen and Wattendorf 1987; Bain 1993; Cassani 1995). Elimination of invasive aquatic vegetation would clearly limit its spread (Cronk 1995), but the adverse impact to native and endemic plant species is of concern (Allen and Wattendorf 1987). The potential elimination of all aquatic plant species should be considered in
relation to impacting the uses of the waterbody (Leslie et al. 1987).
(Mickle and Wetzel 1978) and stabilize sediments of reservoirs (Dieter 1990; James and Barko 1994; Madsen et al. 2001; Bachmann et al. 2004). Increased turbidity could result from runoff, shoreline erosion, and destabilization of sediments due to a decline in
shoreline and littoral vegetation. These same factors and the release of nutrients from grass carp excreta can also accelerate eutrophication (Stanley 1974; Mitzner 1978; Cassani 1996).
Field investigations in reservoirs where grass carp have controlled nuisance aquatic vegetation have detected some moderate changes in water quality. Nutrient concentrations have decreased, and water clarity has increased, following aquatic plant infestations
(Canfield et al. 1983). Aquatic vegetation control utilizing grass carp has resulted in increases in nutrient parameters and decreased water clarity (Canfield et al. 1983; Leslie et al. 1983). Conversley, decreases in nutrient concentrations and increased water clarity have followed aquatic vegetation control utilizing grass carp (Mitzner 1978). Water depth, retention time, nutrient loading, relative abundance of vegetation to lake volume, and rate of vegetation removal influence the impact grass carp may have on lake and reservoir water quality (Mitzner 1978; Leslie et al. 1983; Shireman et al. 1985; Cassani 1996). The
mechanisms producing these conflicting results remain unclear and demonstrate that additional research is needed in this area.
indirect effects of this practice is needed for the advancement of sound aquatic plant management. With this research project, I attempt to address two key issues related to high-density grass carp stocking in a reservoir setting: (1) the degree of control of aquatic plant species considered difficult to control with grass carp and (2) possible impacts to water quality. The objectives of this study were to evaluate the efficacy of a high-density triploid grass carp stocking to control nuisance levels of parrot-feather Myriophyllum aquaticum, a non-native nuisance aquatic plant that is not a food source preferred by grass carp and detect associated changes in the water quality of a piedmont North Carolina reservoir.
Study Area and Aquatic Plant Management
of the reservoir (Weatherby 1932; Sutton 1985; Blackburn et al. 1969; Aulbach-Smith and de Kozlowski 1996).
Water-level management and aquatic herbicides have been utilized to control parrot-feather and Brazilian elodea abundances and distributions. Brazilian elodea has been successfully controlled with winter drawdowns of Lookout Shoals Lake, which have restricted the infestation to the riverine section from the Oxford Hydroelectric Dam, that impounds Lake Hickory, downstream about five km to the upstream impounded area of Lookout Shoals Lake. Parrot-feather has infested approximately 90 ha of the littoral zone of the upper reservoir due to the ineffectiveness of winter drawdowns at controlling its spread and has been selectively controlled with aquatic herbicides (Ken Manuel, Duke Energy, personal communication). However, recent installation of a municipal water facility has resulted in increased restrictions on the use of aquatic herbicides, and other control options were sought for the management of this invasive aquatic plant. Parrot-feather is not considered to be a food source preferred by grass carp (Avault 1965; Pine and Anderson 1991; Catarino et al. 1997); thus, control of this nuisance aquatic plant with grass carp was questionable. This presented an experimental opportunity to evaluate a high-density grass carp stocking management technique in an attempt to control a nuisance aquatic plant species that was not a food source preferred by grass carp.
Kozlowski 1994; Hanlon et al. 2000). These fish were approximately 350 mm in total length and 525 g in weight.
Methods
Experimental Exclosure and Vegetation Sampling
To determine grass carp efficacy as a control agent of parrot-feather, eight square exclosures approximately 6-m wide and 2-m high were installed prior to grass carp stocking to allow vegetation growth within the exclosures without grass carp influence (Figure 3). They were constructed in shallow water, less than 2 m deep, in areas of known parrot-feather occurrence. Galvanized pipe was driven into the substrate at the exclosure corners, and plastic 1.3-cm square mesh fencing was stretched around and held in place by vinyl-coated galvanized cable at the top and reinforcement bar weights at the bottom. An area of equal size and morphology adjacent to each exclosure was delineated to sample for comparison of parrot-feather biomass within the corresponding exclosure.
Harvested plant biomass sampling was conducted for sensitivity in detecting changes in parrot-feather abundance to evaluate the degree of control (Madsen and Bloomfield 1993). Throughout the growing season, vegetation was harvested from six rectangular quadrats within each exclosure and the area adjacent to the exclosure. The quadrats were 1 m wide by 6 m long and extended the length of the exclosure
by hand and by the same observer. The vegetation from each quadrat was then spun in a mesh bag to remove excess water, and fresh weight was measured (±1 g). This process was repeated until the weight stabilized. The first vegetation samples (July 2005) from inside the exclosures were used to verify an adequate sample size using the equation suggested by Madsen (1993) for estimating adequate sample sizes needed for aquatic vegetation biomass sampling. Evidence of non-normality was detected in the parrot-feather biomass samples which was not remedied by data transformation. Thus, a Wilcoxon signed rank test was used to detect differences in parrot-feather biomass from inner and outer quadrats. All statistical comparisons were considered significant at a probability of less than 0.05 (alpha).
Water Quality Sampling
Lookout Shoals water quality was monitored monthly from July 2005 through April 2007. Surface samples and measurements were collected from two mainlake locations in the middle and upper lake areas and from inside and outside each of the eight experimental exclosures (Figure 2). Measurements of temperature, dissolved oxygen, and pH were made using a Hydrolab® model MS5 multi-probe datasonde and Surveyor 4a display unit.
hardness (ethylenediaminetetraacetic acid titration), and within 48 h of collection for ammonia (salicylate method), nitrate (calcium reduction method), nitrite (diazotization method), reactive phosphorus (PhosVer 3 method), using a Hach® CEL/850 test kit. Chlorophyll a samples were delivered to the Center for Applied Aquatic Ecology, North Carolina State University, within 24 h of collection, where they were analyzed using the EPA 445.0 (revision 1.2) method (EPA 1997).
Lookout Shoals Lake water quality was monitored during the months of June, July, and August of 1997 and 2002 by the North Carolina Division of Water Quality (NCDWQ 2003). One of these locations corresponds to one (midlake) of the two mainlake locations monitored for our research. This location provides a comparison of water quality
parameters before (1997, 2002) and after (2005-2007) grass carp stocking. One-way analysis of variance (JMP 7, Statistical Analysis Software, Cary, North Carolina) was utilized to detect differences among years for water quality determinations available from the NCDWQ (NCDWQ 2003)and those conducted for this study, and among years and seasons for the mainlake water quality determinations from this study. A one-way analysis of variance was also used to detect differences among seasons and years between the inner and outer exclosure water quality determinations with blocking by exclosure.
Results
Vegetation
Chara and Brazilian elodea were only encountered in quadrats inside the exclosures, while parrot-feather was encountered inside and outside the exclosures. Parrot-feather biomass was highly variable among exclosures and sampling occasions (Table 2). Analysis of July 2005 parrot-feather biomass indicated no significant difference in the mean parrot-feather biomass from the quadrats available to the grass carp (0.02 kg/m2) and the quadrats from inside the exclosures (0.05 kg/m2) two months after grass carp were stocked and one month into the parrot-feather growing season (Figure 4). A significant reduction in parrot-feather biomass was observed outside the exclosures, relative to that inside, three and four months after grass carp were stocked. Mean parrot-feather biomass from the quadrats available to the grass carp was less than 0.01 kg/m2 in both August and September, whereas mean parrot-feather biomass from the quadrats in the exclosures was 0.60 kg/m2 and 0.54 kg/m2 in August and September, respectively. These results demonstrate an average difference in parrot-feather biomass inside and outside of exclosures over 50-fold.
In the 2006 sampling season, no vegetation was encountered in any quadrat
Water quality
No significant differences were detected before and after grass carp stocking for temperature, pH, and secchi depth, or dissolved oxygen, ammonia, and nitrate-nitrite concentrations from existing data and the sampling conducted during this study (Table 3). There was a significant increase in chlorophyll a concentrations from 2002 and 2005 to 2006, but this change did not coincide temporally with grass carp stocking.
No consistent or ecologically significant changes between seasons in physical water quality parameters were detected during the two years following grass carp stocking (Table 4). A relatively high degree of variability in secchi depth readings was found for all
variation in dissolved oxygen concentrations were observed over the entire course of the study.
Significant differences were detected between the uplake and midlake sampling locations for the water quality parameters (Table 5). Consistently elevated levels were detected in reactive phosphorus concentrations during summer 2005 and secchi depth readings during summer 2006 at the uplake location. Consistently elevated levels of total hardness were detected at the midlake location during fall and winter of 2005 and 2006. However, no significant differences were detected for temperature, dissolved oxygen, pH, chlorophyll a, ammonia, nitrate-nitrite, or total alkalinity between the locations throughout the course of the study.
No consistent or ecologically significant differences were detected inside versus outside of the experimental exclosures in any season for temperature or dissolved oxygen, ammonia, nitrate-nitrite, total alkalinity, and total hardness concentrations (Tables 6-8). Consistently elevated pH was observed inside the exclosures during summer 2005 (Table 6). Increased maximum concentrations were detected in reactive phosphorus during summer 2005 and in chlorophyll a during summer 2005 and 2006 inside the exclosures versus outside.
Discussion
of the parrot-feather growing season and two months prior to its peak growth period in Lookout Shoals Lake. In this case, the plant biomass of a major infestation did not require depletion to achieve reasonable control; rather, grass carp could consume less abundant vegetation as it grew. Grass carp presence at the initiation of the parrot-feather growing season may be a key factor contributing to the level of control seen. Also, parrot-feather new growth may be more palatable to grass carp facilitating early and continued control as the growing season progressed (Prowse 1971; Leslie et al. 1994). This factor (i.e., timing) may be of equal importance as density of grass carp for controlling parrot-feather.
Lakewide visual estimation and quadrat sampling indicated a lack of plant biomass and continued vegetation control in 2006 and 2007. The finding of little to no vegetation growth inside the exclosures during 2006 was unexpected and may be due to herbivore intrusion, sedimentation effects, or annual variation in plant growth. Doyle et al. (1997) reported herbivory and sedimentation as deterrents to the establishment of aquatic plants in exclosures in two Texas reservoirs. Evidence of sedimentation and intrusion by painted turtles Chrysemys picta was observed among all exclosures during my study. Painted turtles are known to be omnivorous (Martof et al. 1980) and may have sought the
Of the significant changes detected in the water quality parameters of Lookout Shoals Lake after grass carp stocking, only those for nutrient and chlorophyll a
concentrations pose ecological significance. The elevation in Chorophyll a during the second year after grass carp were stocked could be indicative of a shift in nutrient availability to the phytoplankton community resulting from grass carp excreta or
resuspension of sediments (Boyd 1971; Shireman et al. 1985). The elevated nitrogen and phosphorus levels observed beginning in the summer of 2005 and through the spring of 2006 were followed by a four-fold increase in chlorophyll a concentrations during the summer of 2006. Chlorophyll a serves as an index of primary production (Brylinsky and Mann 1971). In lakes with extensive littoral areas, aquatic macrophytes can comprise a significant portion of the primary production as they sequester nutrients and alter photic conditions early in the growing season in competition with phytoplankton communities (Boyd 1971). Aquatic macrophytes also have added competitive advantages over
Management Implications
Invasive aquatic vegetation is an ongoing problem for water resource managers. The triploid grass carp is an increasingly useful biological control agent of aquatic vegetation that can decrease cost and risk to public health (Sutton 1977; Bailey 1978; Li and Moyle 1999), and my research demonstrates that high-density grass carp stocking can be included in that assessment for controlling aquatic plant species considered to be food sources non-preferred by grass carp. I observed control of an invasive aquatic plant previously considered difficult to control with grass carp, presumably due to the high-density component of the stocking. The changes observed in reservoir water quality following vegetation control were moderate and are likely of minimal concern for management and water use.
In addition to stocking density, timing of grass carp stocking may influence the degree of vegetation control. For control of invasive aquatic vegetation that is not
preferred by grass carp, managers should consider stocking soon after infestation or early in the season before vegetation biomass reaches peak levels.
When deciding on a management strategy for the control of invasive aquatic plants, one must consider the impacts of control techniques versus the costs of no control. This study did not address possible impacts to native or endemic vegetation because the aquatic plant community of the study reservoir was dominated by invasive plant species.
in other water bodies that indicate full control of aquatic plants may result with high-density grass carp stocking (Bailey and Boyd 1972; Martyn et al. 1986; Hanlon et al. 2000), and managers should expect full control and depletion of aquatic vegetation with this strategy. The changes observed in the aquatic plant community and water quality of Lookout Shoals raise questions regarding the possible long-term effects on littoral and shoreline aquatic plant and fish species. Future research may address those issues, as well as broader ecosystem-level effects.
Literature Cited
Aiken, S. G., P. R. Newroth, and I. Wile. 1979. The biology of Canadian weeds. 34.
Myriophyllum spicatum L. Canadian Journal of Plant Science 59:201-215. Ali, M. M., and M. A. Soltan. 2006. Expansion of Myriophyllum spicatum (Eurasian
water milfoil) into Lake Nasser, Egypt: invasive capacity and habitat stability. Aquatic Botany 84:239-244.
Aliyev, D. S., and R. Y. Bessmertnaya. 1968. Use of the grass carp [Ctenopharyngodon idella (Val.)] to control the larvae of blood-sucking mosquitoes. Problems in
Ichthyology 8:319-321.
Allen, S. K., Jr., and R. J. Wattendorf. 1987. Triploid grass carp: status and management implications. Fisheries 12(4):20-24.
Aulbach-Smith, C. A., and S. J. de Kozlowski. 1996. Aquatic and wetland plants of South Carolina, second edition. South Carolina Department of Natural Resources,
Columbia, South Carolina.
Avault, J. W. 1965. Preliminary studies with grass carp for aquatic weed control. The Progressive Fish Culturist 27:207-209.
Bachmann, R. W., M. V. Hoyer, and D. E. Canfield, Jr. 2004. Aquatic plants and nutrients in Florida lakes. Aquatics 26:4-11.
Bailey, W. M. 1978. A comparison of fish populations before and after extensive grass carp stocking. Transactions of the American Fisheries Society 107:181-206.
Bailey, W. M., and R. L. Boyd. 1972. Some observations on the white amur in Arkansas. Hyacinth Control Journal 10:20-22.
Bain, M. B. 1993. Assessing impacts of introduced aquatic species: grass carp in large systems. Environmental Management 17:211-224.
Blackburn, R. D., L. W. Weldon, R. R. Yeo, and T. M. Taylor. 1969. Identification and distribution of certain similar-appearing submersed aquatic weeds in Florida. Hyacinth Control Journal 8(a):17-21.
Boyd, C. E. 1971. The limnological role of aquatic macrophytes and their relationship to reservoir management. American Fisheries Society Special Publication 8:153-166. Boyd, C. E., and C. S. Tucker. 1998. Pond Aquaculture Water Quality Management.
Kluwer Academic, Boston, Massachusetts.
Boylen, C. W., L. W. Eichler, and J. D. Madsen. 1999. Loss of native aquatic plant species in a community dominated by Eurasian watermilfoil. Hydrobiologia 415:207-211.
Brylinsky, M., and K. H. Mann. 1971. An analysis of factors governing productivity in lakes and reservoirs. Limnology and Oceanography 18:1-14.
Canfield, D. E., Jr., M. J. Maceina, and J. V. Shireman. 1983. Effects of hydrilla and grass carp on water quality in a Florida lake. Journal of the American Water Resources Association 19:773-778.
Cassani, J. R. 1995. Problems and prospects for grass carp as a management tool. Pages 407-412 in L. Schramm and R. G. Piper, editors. Uses and effects of cultured fishes in aquatic ecosystems. American Fisheries Society, Symposium 15, Bethesda,
Maryland.
Cassani, J. R. 1996. Managing aquatic vegetation with grass carp. American Fisheries Society, Introduced Fish Section, Bethesda, Maryland.
Catarino, L. F., M. T. Ferreira, and I. S. Moreira. 1997. Preferences of grass carp for macrophytes in Iberian drainage channels. Journal of Aquatic Plant Management 36:79-83.
Chapman, V. J., and B. J. Coffey. 1971. Experiments with grass carp in controlling exotic macrophytes in New Zealand. Hdirobiologia (Bucuresti) 12:313-323.
Cronk, Q. C. B. 1995. Changing worlds and changing weeds. British Crop Protection Council Proceedings, Weeds in a Changing World, Farnham, Surrey, UK 64:3-13. Cross, D. J. 1969. Aquatic weed control using grass carp. Journal of Fish Biology
1:27-30.
de Winton, M. D., and J. S. Clayton. 1996. The impact of invasive submerged weed species on seed banks in lake sediments. Aquatic Botany 53:31-45.
Dieter, C. D. 1990. The importance of emergent vegetation in reducing sediment resuspension in wetlands. Journal of Freshwater Ecology 5:467-473.
Doyle, R. D., R. M. Smart, C. Guest, and K. Bickell. 1997. Establishment of native aquatic plants for fish habitat: test plantings in two north Texas reservoirs. Lake and Reservoir Management 13:259-269.
Duke Power. 1999. Access. Duke Energy Carolinas, Charlotte, North Carolina.
Edwards, D. J. 1974. Weed preference and growth of young grass carp in New Zealand. New Zealand Journal of Marine and Freshwater Research 8:341-350.
EPA (Environmental Protection Agency). 1997. Method 445.0. National Exposure Research Laboratory, Office of Research and Development, Cincinnati, Ohio. Florschutz, O., Jr. 1972. The importance of Eurasian milfoil (Myriophyllum spicatum) as
a waterfowl food. Proceedings of the Annual Conference of the Southeastern Association of Game and Fish Commissioners 26:189-194.
Fowler, M. C., and T. O. Robson. 1978. The effects of the food preferences and stocking rates of grass carp (Ctenopharyngodon idella Val.) on mixed plant communities. Aquatic Botany 5:261-276.
Frye, O. E. 1972. Weed control as it relates to the aquatic environment. Journal of Aquatic Plant Management 10:12-13.
Gasaway, R. D., and T. F. Drda. 1977. Effects of grass carp introduction on waterfowl habitat. Transactions of the North American Wildlife and Natural Resources Conference 42:73-85.
Hall, D. J., and E. E. Werner. 1977. Seasonal distribution and abundance of fishes in the littoral zone of a Michigan lake. Transactions of the American Fisheries Society 106:545-555.
Hanlon S. G., M. V. Hoyer, C. E. Cichra, and D. E. Canfield, Jr. 2000. Evaluation of macrophyte control in 38 Florida lakes using triploid grass carp. Journal of Aquatic Plant Management 38:48-54.
James, W. F., and J. W. Barko. 1994. Macrophyte influences on sediment resuspension and export in a shallow impoundment. Lake and Reservoir Management 10:95-102. Jenkins, R. E., and N. M. Burkhead. 1993. Freshwater fishes of Virginia. American
Fisheries Society, Bethesda, Maryland.
Kohler, C. C., and W. R. Courtenay, Jr. 1986. American Fisheries Society position on introductions of aquatic species. Fisheries 11(2):39-42.
Leslie, A. J., L. E. Nall, and J. M. Van Dyke. 1983. Effects of vegetation control by grass carp on selected water-quality variables in four Florida lakes. Transactions of the American Fisheries Society 112:777-787.
Leslie, A. J., Jr., J. M. Van Dyke, R. S. Hestand, III, and B. Z. Thompson. 1987.
Management of aquatic plants in multi-use lakes with grass carp. Lake and Reservoir Management 3:266-276.
Leslie, A. J., L. E. Nall, G. P. Jubinsky, and J. D. Schardt. 1994. Effects of grass carp on the aquatic vegetation in Lake Conway, Florida. Florida Department of
Environmental Protection, Tallahasee, Florida.
Li, H. W., and P. B. Moyle. 1999. Management of introduced fishes. Pages 345-374 In
C.C. Kohler and W. A. Hubert, editors. Inland fisheries management in North America, 2nd edition. American Fisheries Society, Bethesda, Maryland. Lin, S. 1935. Life history of Waan Ue (Ctenopharyngodon idella Cuv. and Val.).
Lingnan Science Journal 14:129-135.
Madsen, J. D. 1993. Biomass techniques for monitoring and assessing control of aquatic vegetation. Lake and Reservoir Management 7:141-154.
Madsen, J. D., and J. A. Bloomfield. 1993. Aquatic Vegetation Quantification Symposium: an overview. Lake and Reservoir Management 7:137-140.
Madsen, J. D., J. W. Sutherland, J. A. Bloomfield, L. W. Eichler, and C. W. Boylean. 1991. The decline of native vegetation under dense Eurasian watermilfoil canopies. Journal of Aquatic Plant Management 29:94-99.
Madsen, J. D., P. A. Chambers, W. F. James, E. W. Koch, and D. F. Westlake. 2001. The interaction between water movement, sediment dynamics and submersed
Martof, B. S., W. M. Palmer, J. R. Bailey, and J. R. Harrison, III. 1980. Amphibians and reptiles of the Carolinas and Virginia. University of North Carolina Press, Chapel Hill, North Carolina.
Martyn, R. D., R. L. Noble, P. W. Bettoli, and R. C. Maggio. 1986. Mapping aquatic weeds with aerial color infrared photography and evaluating their control by grass carp. Journal of Aquatic Plant Management 24:46-56.
Mickle, A. M., and R. G. Wetzel. 1978. Effectiveness of submersed angiosperm-epiphyte complexes on exchange of nutrients and organic carbon in littoral systems. I.
Inorganic nutrients. Aquatic Botany 4:303-316.
Mitchell, D. S. 1969. The ecology of vascular hydrophytes on Lake Kariba. Hydrobiologia 34:448-464.
Mitzner, L. 1978. Evaluation of biological control of nuisance aquatic vegetation by grass carp. Transactions of the American Fisheries Society 107:135-145.
Nikol’skii, G. V. 1954. Special ichthyology, 2nd edition. Main Administration of Higher Education of the Ministry of Culture, USSR. [Translated from Russian by Dr. J. I. Lengy and Z Krauthmer, Israel Program for Scientific Translations Ltd., 1961.] NCDWQ (North Carolina Department of Environment and Natural Resources, Division
of Water Quality). 2003. Basinwide Assessment Report, Catawba River Basin. Raleigh, North Carolina.
Opuszynski, K. 1972. Use of phytophagous fish to control aquatic plants. Aquaculture 5:61-74.
Orr, B. K., and V. H. Resh. 1992. Influence of Myriophyllum aquaticum cover on
Anopheles mosquito abundance, ovipostion, and larval microhabitat. Oecologia 90:474-482.
Pflieger, W. L. 1978. Distribution and status of the grass carp (Ctenopharyngodon idella) in Missouri streams. Transactions American Fisheries Society 107:113-118.
Pine, R. T., and W. J. Anderson. 1991. Plant preferences of triploid grass carp. Journal of Aquatic Plant Management 29:80-82.
Rice, J. A., R. L. Noble, and R. L. Curry, editors. 1999. Pond Management Guide. North Carolina Cooperative Extension Service, North Carolina Wildlife Resources
Commission, Raleigh, North Carolina.
Roach, L. S., and E. L. Wickliff. 1934. Relationship of aquatic plants to oxygen supply, and their bearing on fish life. Transactions of the American Fisheries Society 64:370-378.
Rottman, R. 1977. Management of weedy lakes and ponds with grass carp. Fisheries 2(5):8-14.
Savino, J. F., and R. A. Stein. 1982. Predator-prey interaction between largemouth bass and bluegills as influenced by simulated, submersed vegetation. Transactions of the American Fisheries Society 111:255-266.
Schramm, H. L., and K. J. Jirka. 1989. Epiphytic macroinvertebrates as a food resource for bluegills in Florida lakes. Transactions of the American Fisheries Society 118:416-426.
Shireman, J. V., M. V. Hoyer, M. J. Maceina, and D. E. Canfield, Jr. 1985. The water quality and fishery of Lake Baldwin, Florida: 4 years after macrophyte removal by grass carp. Pages 201-206 in Proceedings of the 4th Annual Conference of the North American Lake Management Society, McAfee, New Jersey.
Sills, J. B. 1970. A review of herbivorous fish for weed control. The Progressive Fish Culturist 32:158-161.
Smart, R. M., G. O. Dick, and R. D. Doyle. 1998. Techniques for establishing native aquatic plants. Journal of Aquatic Plant Management 36:44-49.
Stanley, J. G. 1974. Nitrogen and phosphorus balance of grass carp, Ctenopharyngodon idella, fed Elodea, Egeria densa. Transactions of the American Fisheries Society 103:587-592.
Statistical Analysis Software. 2007. JMP7. Cary, North Carolina.Stevenson, J. H. 1965. Observations of the grass carp in Arkansas. The Progressive Fish Culturist 27:203-206.
Sutton, D. L. 1977. Grass carp (Ctenopharyngodon idella Val.) in North America. Aquatic Botany 3:157-164.
Sutton, D. L. 1985. Biology and ecology of Myriophyllum aquaticum. Pages 59-71 in L. W. J. Anderson, editor. Proceedings of the First International Symposium on
Watermilfoil (Myriophyllum spicatum) and Related Haloragaceae Species. Vancouver, British Columbia.
Van Dyke, J. M., A. J. Leslie, Jr., and L. E. Nall. 1984. The effects of the grass carp on the aquatic macrophytes of four Florida lakes. Journal of Aquatic Plant Management 22:87-95.
Vinogradov, V. K., and Z. K. Zolotova. 1974. The influence of the grass carp on aquatic ecosystems. Hydrobiological Journal 10:72-78.
Voigts, D. K. 1976. Aquatic invertebrate abundance in relation to changing marsh vegetation. American Midland Naturalist 95:313-322.
Weatherby, C. A. 1932. Anacharis densa on Long Island. Rhodora 34:151-152. Wickliff, E. L., and L. S. Roach. 1937. Some studies of impounded waters in Ohio.
Transactions of the American Fisheries Society 66:76-86.
Table 1. Total submersed vegetation biomass (g/m2) from inside and outside eight experimental exclosures on Lookout Shoals Lake during July, August, and September of 2005 and 2006, following the May 2005 stocking of grass carp.
Table 2. Parrot-feather biomass (g/m2) from inside (In) and outside (Out) eight
experimental exclosures on Lookout Shoals Lake during July, August, and September of 2005 and 2006.
2005 2006
July August September July August September
Exclosure In Out In Out In Out In Out In Out In Out
1 27 2 1,643 0 385 0 0 0 0 0 0 0
2 2 2 3 0 8 0 0 0 0 0 0 0
3 37 2 178 2 197 0 13 0 2 0 0 0
4 0 0 23 0 48 0 117 0 2 0 0 0
5 245 33 1,660 0 2,025 0 0 0 0 0 0 0
6 38 113 580 2 447 0 0 0 2 0 0 0
7 65 28 687 22 1,177 12 332 0 1,453 0 1,330 0
8 2 0 10 0 62 0 0 0 0 0 0 0
2005 2006
Species July August September July August September
Inside
Chara spp. 223 142 45 140 0 0
Brazilian elodea 1 0 0 0 0 0
Parrot-feather 416 4,784 4,349 462 1,459 1,330
Outside
Table 3. Mean, standard error (in parentheses), and range of water quality
measurements from Lookout Shoals Lake monthly (June-August) in 1997 and 2002 (NCDWQ 2003) prior to grass carp stocking, and in 2005-2006 after grass carp stocking. Within each parameter, different superscript letters indicate significant differences.
Year
1997 2002 2005 2006
Temperature (oC) 25.3a (3.2) 26.0a (1.9) 24.7a (<0.1) 27.8a (1.2)
19.7-30.9 22.3-28.1 24.7-24.8 26.0-30.0
pH 6.5a (0.3) 6.9a (0.2) 6.7a (0.2) 7.4a (0.3)
6.1-7.2 6.6-7.2 6.5-6.8 7.1-7.9
Dissolved oxygen (mg/L) 7.0a (0.8) 6.3a (0.9) 5.5a (1.0) 7.0a (0.5)
5.6-8.3 4.6-7.3 4.5-6.5 6.1-7.6
Secchi depth (m) 1.5a (0.3) 1.5a (0.5) 1.2a (0.6) 1.4a (0.1)
1.0-2.0 1.0-2.4 0.6-1.8 1.3-1.5
Chlorophyll a (µg/L) - 3.5a (1.5) 2.1a (0.4) 8.7b (0.6)
- 0.4-5.0 1.7-2.5 8.0-9.9
Ammonia (mg/L NH3-N) 0.05a (0.02) 0.03a (0.01) 0.07a (0.02) 0.02a (0.01)
0.01-0.07 0.02-0.04 0.05-0.08 <0.01-0.03
Nitrate-nitrite (mg/L NO3--N, NO2--N) 0.25a (0.03) 0.07a (0.04) 0.31a (0.20) 0.27a (0.15)
Table 4. Mean, standard error (in parentheses), and range of water quality measurements during spring (April-June), summer (July-September), fall-winter (October, November, January, March) taken at uplake and midlake locations on Lookout Shoals Lake 2005-2007. Within each parameter and season, different superscript letters indicate significant differences.
Spring Summer Fall-Winter
2006 2007 2005 2006 2005-2006 2006-2007 (N=6) (N=2) (N=6) (N=6) (N=8) (N=8) Temperature (oC) 19.1a (2.0) 15.6a (0.8) 24.7a (0.1) 26.4a (1.0) 12.1a (1.7) 12.0a (1.7)
14.5-26.0 14.8-16.3 24.1-25.1 23.5-30.0 6.8-18.8 8.0-19.5
Dissolved oxygen (mg/L) 8.0a (0.3) 9.8b (0.3) 5.4a (0.3) 5.6a (0.5) 8.4a (0.5) 9.7a (0.7) 6.8-8.9 9.5-10.0 4.4-6.5 4.4-7.4 6.4-10.3 7.4-13.0
pH 7.0a (<0.1) 7.5b (0.1) 6.6a (<0.1) 7.2b (0.2) 7.2a (<0.1) 7.5b (0.1)
6.8-7.1 7.4-7.5 6.5-6.8 6.7-7.9 7.0-7.3 7.2-8.1
Secchi depth (m) 1.9a (0.2) 2.7b (0.2) 1.5a (0.3) 1.6a (0.1) 2.3a (0.2) 1.9a (0.4) 1.5-2.5 2.5-2.8 0.6-2.5 1.3-2.0 1.4-3.0 0.9-3.3
Chlorophyll a (µg/L) 3.9a (1.2) 1.1a (0.2) 2.5a (0.6) 4.3a (1.5) 1.7a (0.3) 4.4a (2.3)
1.2-8.3 0.9-1.2 1.1-5.4 1.5-9.9 0.7-2.9 0.7-17.5
Ammonia (mg/L NH3-N ) 0.05a (0.01) 0.05a (0.01) 0.06a (0.01) 0.04a (0.02) 0.06a (0.01) 0.05a (0.01)
0.01-0.1 0.04-0.05 <0.01-0.1 <0.01-0.11 <0.01-0.1 <0.01-0.09
Nitrate-nitrite (mg/L NO3--N, NO2--N) 0.63a (0.02) 0.15b (0.01) 0.47a (0.12) 0.54a (0.18) 0.72a (0.15) 0.16b (0.02)
0.56-.68 0.14-0.16 0.11-0.86 0.06-1.11 0.09-1.31 0.05-0.25
Reactive phosphorus (mg/L PO43-) 0.17a (0.02) 0.03b (0.02) 0.24a (0.03) 0.09b (0.02) 0.23a (0.01) 0.11b (0.01)
0.11-.26 0.01-0.05 0.12-0.32 0.06-0.17 0.18-0.30 0.06-0.16
Total alkalinity (mg/L as CaCO3) 11.3a (0.50) 12.3a (0.3) 11.5a (0.3) 10.7a (0.6) 11.6a (0.2) 13.7b (0.3)
9.5-12.5 12.0-12.5 10.5-11.9 8.5-12.5 11.0-12.5 12.5-14.5
Total hardness (mg/L as CaCO3) 10.5a (0.6) 12.3a (0.3) 11.1a (0.3) 10.9a (0.5) 11.7a (0.3) 13.6b (0.6)
Table 5. Mean, standard error (in parentheses), and range of water quality measurements during spring (April-June), summer (July-September), fall-winter (October, November, January, March) taken at uplake and midlake locations on Lookout Shoals Lake 2005-2007. Within each parameter, season, and year, different superscript letters indicate significant differences.
Summer 2005 Fall-Winter 2005-2006 Spring 2006 Summer 2006 Fall-Winter 2006-2007 Uplake Midlake Uplake Midlake Uplake Midlake Uplake Midlake Uplake Midlake Temperature (oC)
24.5a (0.3) 24.8a (0.1) 12.2a (2.7) 12.0a (2.4) 19.0a (2.9) 19.2a (3.5) 25.9a (1.2) 27.0a (1.9) 12.2a (2.6) 11.8a (2.5)
24.1-25.1 24.7-25.0 6.8-18.8 7.3-17.8 15.5-24.7 14.5-26.0 23.8-28.0 23.5-30.0 8.3-19.5 8.0-18.4
Dissolved oxygen (mg/L) 5.2a (0.5) 5.6a (0.6) 8.3a (0.8) 8.5a (0.5) 7.7a (0.6) 8.3a (0.3) 5.1a (0.5) 6.1a (0.8) 9.8a (1.2) 9.7a (1.0)
4.4-5.9 4.5-6.5 6.4-10.3 7.3-9.9 6.8-8.9 7.6-8.7 4.4-6.1 4.7-7.4 7.6-13.0 7.4-12.2
pH 6.5a (<0.1) 6.6a (0.1) 7.2a (0.1) 7.2a (0.1) 7.0a (0.1) 7.0a (<0.1) 7.0a (0.2) 7.4a (0.2) 7.6a (0.2) 7..5a (0.2)
6.5-6.6 6.5-6.8 7.0-7.3 7.0-7.3 6.8-7.1 7.0-7.1 6.7-7.2 7.2-7.9 7.3-8.1 7.2-8.0
Secchi depth (m) 1.7a (0.6) 1.3a (0.4) 2.4a (0.3) 2.2a (0.3) 2.0a (0.3) 1.8a (0.2) 1.9a (0.1) 1.4b (<0.1) 1.7a (0.4) 2.1a (0.6)
0.6-2.5 0.6-1.8 1.5-3.0 1.4-2.7 1.5-2.5 1.5-2.1 1.7-2.0 1.3-1.4 0.9-2.5 0.9-3.3
Chlorophyll a (µg/L) 1.8a (0.4) 3.2a (1.1) 1.5a (0.3) 1.8a (0.5) 3.3a (1.8) 4.5a (2.0) 1.8a (0.2) 6.8a (2.2) 5.1a (4.1) 3.8a (2.9)
1.1-2.5 1.7-5.4 0.7-2.2 1.0-2.9 1.2-6.8 1.8-8.3 1.5-2.2 2.5-9.9 0.7-17.5 0.7-12.4
Ammonia (mg/L NH3-N) 0.05a (0.03) 0.07a (0.01) 0.06a (0.02) 0.06a (0.02) 0.05a (0.02) 0.06a (0.02) 0.07a (0.02) 0.01a (0.01) 0.05a (0.02) 0.06a (0.02)
<0.01-0.10 0.05-0.08 <0.01-0.10 0.03-0.09 0.01-0.09 0.03-0.10 0.04-0.11 <0.01-0.02 <0.01-0.09 0.01-0.08
Nitrate-nitrite (mg/L NO3--N, NO2--N) 0.06a (0.21) 0.40a (0.15) 0.63a (0.17) 0.82a (0.26) 0.64a (0.04) 0.61a (0.03) 0.63a (0.21) 0.50a (0.33) 0.16a (0.04) 0.16a (0.02)
0.14-0.86 0.11-0.57 0.15-0.88 0.09-1.31 0.56-0.68 0.56-0.64 0.30-1.01 0.06-1.11 0.05-0.25 0.11-0.20
Reactive phosphorus (mg/L PO43-) 0.28a (0.04) 0.19b (0.04) 0.24a (0.03) 0.22a (0.01) 0.18a (0.04) 0.17a (0.02) 0.08a (0.01) 0.11a (0.03) 0.10a (0.01) 0.13a (0.02)
0.19-0.32 0.12-0.26 0.18-0.30 0.20-0.24 0.11-0.26 0.14-0.19 0.07-0.10 0.06-0.17 0.06-0.13 0.09-0.16
Total alkalinity (mg/L as CaCO3) 11.8a (<0.1) 11.1a (0.4) 11.8a (0.4) 11.5a (0.3) 11.5a (0.8) 11.0a (0.8) 11.7a (0.4) 9.7a (0.6) 13.6a (0.4) 13.8a (0.5)
11.8-11.9 10.5-11.9 11.0-12.5 11.0-12.0 10.0-12.5 9.5-12.0 11.0-12.5 8.5-10.5 12.5-14.5 12.5-14.5
Total hardness (mg/L as CaCO3) 11.3a (0.4) 10.9a (0.4) 11.5a (0.5) 11.9b (0.4) 10.7a (0.8) 10.3a (0.9) 11.8a (0.4) 10.0a (0.6) 14.0a (1.0) 13.3a (0.7)
Table 6. Mean, standard error (in parentheses), and range of water quality measurements during summer (July-September) 2005 and 2006 samples taken inside and outside eight experimental exclosures on Lookout Shoals Lake. Within each parameter and year, different superscript letters indicate significant differences.
Summer 2005 Summer 2006 Inside Outside Inside Outside Temperature (oC) 24.7a (0.2) 24.7a (0.2) 26.2a (0.5) 26.1a (0.5)
23.6-26.5 23.7-26.9 23.0-29.6 23.0-29.6
Dissolved oxygen (mg/L) 5.8a (0.2) 5.5a (0.2) 5.6a (0.1) 5.5a (0.1) 4.2-9.1 4.1-9.0 4.7-6.8 4.7-7.0
pH 6.7a (<0.1) 6.6b (<0.1) 7.1a (0.1) 7.1a (<0.1) 6.5-6.9 6.4-6.9 6.6-7.5 6.6-7.5
Chlorophyll a (µg/L) 15.3a (4.0) 10.0a (2.1) 11.4a (1.7) 10.4a (1.5) 0.9-94.6 0.7-33.2 1.7-35.3 1.2-21.4
Ammonia (mg/L NH3-N) 0.04a (0.01) 0.05a (0.01) 0.05a (0.01) 0.05a (0.01)
<0.01-0.10 <0.01-0.15 <0.01-0.12 <0.01-0.15
Nitrate-nitrite (mg/L NO3--N, NO2--N) 0.32a (0.05) 0.36a (0.05) 0.46a (0.07) 0.46a (0.07)
0.01-0.69 0.02-0.87 0.07-0.97 0.06-1.12
Reactive phosphorus (mg/L PO43-) 0.27a (0.03) 0.26a (0.02) 0.13a (0.01) 0.15a (0.02)
0.10-0.87 0.10-0.48 <0.01-0.29 0.05-0.38
Total alkalinity (mg/L as CaCO3) 11.8a (0.1) 11.6a (0.1) 11.0a (0.2) 11.0a (0.2)
10.8-12.8 10.8-12.6 9.5-12.5 9.5-12.5
Total hardness (mg/L as CaCO3) 11.4a (0.1) 11.5a (0.1) 11.1a (0.2) 11.1a (0.3)
Table 7. Mean, standard error (in parentheses), and range of water quality measurements during fall-winter (October and November 2005; January, March, October, and
November 2006; and, January, and March 2007) samples taken inside and outside eight experimental exclosures on Lookout Shoals Lake. Within each parameter and year group (2005-2006 and 2006-2007), different superscript letters indicate significant differences.
Fall-winter 2005-2006 Fall-winter 2006-2007 Inside Outside Inside Outside Temperature (oC) 11.5a (0.6) 11.5a (0.6) 11.3a (0.7) 11.3a (0.7)
7.1-18.5 7.0-18.4 5.8-19.6 5.8-19.6
Dissolved oxygen (mg/L) 9.0a (0.3) 8.6a (0.2) 9.6a (0.3) 9.4a (0.3) 6.6-11.5 6.6-10.7 6.7-12.6 6.7-12.6
pH 7.1a (<0.1) 7.1a (<0.1) 7.5a (0.1) 7.5a (0.1) 6.9-7.4 6.9-7.4 6.9-8.4 7.1-8.2
Chlorophyll a (µg/L) 5.3a (1.0) 4.8a (0.9) 5.9a (1.4) 4.6a (1.0) 1.2-29.6 0.7-28.3 0.6-37.3 0.7-20.4
Ammonia (mg/L NH3-N) 0.04a (<0.01) 0.05a (0.01) 0.07a (0.01) 0.07a (0.01)
0.01-0.08 <0.01-0.11 <0.01-0.21 <0.01-0.22
Nitrate-nitrite (mg/L NO3--N, NO2--N) 0.57a (0.06) 0.58a (0.05) 0.19a (0.03) 0.21a (0.02)
0.03-1.13 0.03-0.98 0.03-0.89 0.04-0.77
Reactive phosphorus (mg/L PO43-) 0.23a (0.01) 0.22a (0.01) 0.12a (0.01) 0.12a (0.01)
0.14-0.38 0.10-0.46 0.01-0.26 0.02-0.28
Total alkalinity (mg/L as CaCO3) 11.2a (0.1) 11.7a (0.1) 13.4a (0.2) 13.5a (0.2)
10.4-11.8 10.5-13.0 12.0-16.0 12.0-16.0
Total hardness (mg/L as CaCO3) 11.8a (0.1) 11.9a (0.2) 13.75a (0.3) 13.9a (0.3)
Table 8. Mean, standard error (in parentheses), and range of water quality measurements during spring (April, May, and June 2006 and April 2007) samples taken inside and outside eight experimental exclosures on Lookout Shoals Lake. Within each parameter and year, different superscript letters indicate significant differences.
Spring 2006 (N=24) Spring 2007 (N=8)
Inside Outside Inside Outside
Temperature (oC) 18.8a (1.0) 18.9a (1.0) 16.0a (0.7) 15.9a (0.6) 14.3-25.7 14.3-25.8 13.7-18.8 13.9-18.4
Dissolved oxygen (mg/L) 7.7a (0.2) 7.5a (0.2) 9.1a (0.2) 8.9a (0.3) 5.2-9.6 5.7-9.0 8.3-10.0 7.7-9.9
pH 6.9a (<0.1) 6.9a (<0.1) 7.4a (<0.1) 7.2a (0.1) 6.7-7.1 6.7-7.0 7.1-7.5 6.5-7.5
Chlorophyll a (µg/L) 7.2a (1.0) 7.1a (1.0) 4.2a (1.1) 4.7a (1.3) 1.6-19.4 1.4-18.5 1.4-10.5 1.3-11.2
Ammonia (mg/L NH3-N) 0.06a (0.01) 0.05a (0.01) 0.05a (0.01) 0.04a (0.01)
<0.01-0.20 <0.01-0.20 <0.01-0.10 <0.01-0.10
Nitrate-nitrite (mg/L NO3--N, NO2--N) 0.65a (0.03) 0.59a (0.03) 0.16a (0.01) 0.16a (0.01)
0.41-1.17 0.30-1.07 0.13-0.20 0.11-0.20
Reactive phosphorus (mg/L PO43-) 0.17a (0.01) 0.14a (0.01) 0.12a (0.03) 0.05a (0.02)
0.06-0.33 0.04-0.26 <0.01-0.26 <0.01-0.13
Total alkalinity (mg/L as CaCO3) 11.9a (0.2) 11.9a (0.2) 12.8a (0.2) 12.6a (0.2)
10.0-13.0 10.0-13.0 12.0-14.0 12.0-14.0
Total hardness (mg/L as CaCO3) 11.1a (0.2) 11.2a (0.2) 12.6a (0.1) 12.6a (0.1)
Figure 1. Location of study site, Lookout Shoals Lake, in relation to other Catawba River reservoirs within North Carolina.
Lake Norman Lookout Shoals Lake Lake Rhodhiss
Figure 2. Parrot-feather and Brazilian elodea approximate coverage, and experimental exclosure and water quality sampling locations on Lookout Shoals Lake, North Carolina.
Parrot-feather Brazilian elodea
Experimental exclosure
0 0.5 1.0 2.0 km
Water quality sampling locations July 2005 – April 2007
0.0 0.2 0.4 0.6 0.8
Jul Aug Sep
Figure 4. Mean biomass (kg/m2) of parrot-feather collected from eight exclosures during July, August, and September on Lookout Shoals Lake, 2005. Different letters indicate significant differences within months.
A A
A
A
B B
0
Exclosure
Lake
Mean biomass (kg/m
Introduction
Stocking grass carp Ctenopharyngodon idella is a commonly applied technique used to control nuisance aquatic vegetation in reservoirs. Factors that influence the degree of aquatic vegetation control are stocking density (Fowler and Robson 1978), regional climate (Van Dyke et al. 1984; Bonar et al. 1993), abundance and species composition of the aquatic plant community (Prowse 1971; Opuszynski 1972; Van Dyke et al. 1984), and relative grass carp feeding preferences for the plant species (Fowler and Robson 1978). Among these factors, manipulation of grass carp stocking densities is the typical method available to aquatic plant managers to achieve control of some types of aquatic vegetation. High-density grass carp stocking may help managers control aquatic plant species not preferentially consumed by grass carp and difficult to control with this technique. High stocking densities may result in the rapid elimination of aquatic vegetation preferentially consumed by grass carp, forcing the fish to consume aquatic plant species they would not ordinarily consume, or risk starvation (Fowler and Robson 1978; Pine and Anderson 1991; Catarino et al. 1997). Achieving control of vegetation that is not preferentially consumed by grass carp using high stocking densities could result in elimination of all aquatic vegetation in the system (Shireman et al. 1985; Kohler and Courtenay 1986; Allen and Wattendorf 1987; Bain 1993; Cassani 1995). Complete elimination of invasive vegetation would limit its spread (Cronk 1995), but little is known regarding the impacts that such a management strategy may exert on reservoir fish communities.
associated invertebrate communities provide important food sources for fish and waterfowl (Cross 1969; Vinogradov and Zolotova 1974; Voigts 1976; Schram and Jirka 1989), spawning and nursery habitat for fish (Muncy 1962; Franklin and Smith 1963; Holland and Huston 1984), and are influential in fish predator-prey relationships (Hall and Werner 1977; Mittlebach 1981; Savino and Stein 1982). However, reservoirs typically have little or no native aquatic vegetation (Smart et al. 1998) and the resident fish populations should have few established relationships with aquatic plants.
Native plant species provide an array of benefits in a balanced ecosystem where their growth is primarily controlled by natural adaptive processes (Holm et al. 1969; Frye 1972; Aulbach-Smith and de Kozlowski 1996). Conversely, invasive plants often spread unhindered by these same natural controls and become a nuisance (Frye 1972; Aulbach-Smith and de Kozlowski 1996). Invasive aquatic vegetation can provide similar benefits as non-invasive vegetation, but without natural control, invasive plants can suppress other aquatic plants (Mitchell 1969; Aiken et al. 1979; Madsen et al. 1991; de Winton and Clayton 1996; Boylen et al. 1999; Ali and Soltan 2006), and adversely affect fish
populations by excluding fish from spawning sites (Keast 1984) and providing excessive cover for prey fish species (Swingle and Smith 1941; Smith and Swingle 1942; Heman et al. 1969; Frye 1972; Barnett and Schneider 1974).
and provide habitat for nuisance insect species (Aliyev and Bessmertnaya 1968; Orr and Resh 1992). Management of nuisance aquatic plants is a common challenge for water resource managers.
Stocking grass carp is a technique for the management of nuisance aquatic
vegetation and offers several advantages over mechanical or chemical controls in aquatic plant management including low cost, labor saving, and low risk to public health (Sutton 1977; Rottman 1977; Bailey 1978; Allen and Wattendorf 1987; Cassani 1995; Li and Moyle 1999). Grass carp are herbivorous fish native to China and Siberia and can grow to more than 50 kg and survive more than 20 years (Lin 1935a; Nikol’skii 1954; Avault 1965; Cross 1969; Bailey and Boyd 1972; Jenkins and Burkhead 1993). Diploid grass carp were introduced to the U.S. for aquatic macrophyte control in 1963 and have been prohibited in many states because they may reproduce and impact native aquatic plant and fish
communities (Stevenson 1965; Sills 1970; Sutton 1977; Pflieger 1978; Allen and Wattendorf 1987; Cassani 1995). Since the development of sterile triploid grass carp in 1983, which alleviated some concern over the long-term impacts from establishment of viable grass carp populations, grass carp have become widely used as a control agent for aquatic nuisance vegetation (Bain 1993; Cassani 1996).
High grass carp densities and the potential loss of aquatic vegetation have raised concerns with fisheries managers regarding the effects on the native fish community. Grass carp in Asia have been reported to be omnivorous, consuming plants, insects, and fish (Lin 1935b), but studies conducted in the U.S. indicate that grass carp do not compete directly with native fishes for food resources (Kilgen and Smitherman 1971; Bailey and Boyd 1972; Terrell and Fox 1974; Rottman and Anderson 1976; Colle et al. 1978; Lembi et al. 1978; Lewis 1978). Thus, some concern remains that high grass carp densities could cause significant habitat or physical disturbances that may impact resident fish populations (Vinogradov and Zolotova 1974; Kohler and Courtenay 1986).
Stocking densities of grass carp that are higher than typically recommended may be a cost-effective means to control aquatic plants that are not preferentially consumed by grass carp, but additional insight into the effects of such a practice on reservoir fish communities is needed for informed aquatic plant and ecosystem management. The objective of this study was to evaluate the effects of a high-density triploid grass carp stocking on the abundance and distribution of native fish populations in Lookout Shoals Lake, a piedmont North Carolina reservoir.
Study Area and Management
Lookout Shoals Lake is a 528-ha reservoir located between Lake Hickory and Lake Norman on the Catawba River in the western piedmont of North Carolina (Figure 1). The lake is jointly managed by Duke Energy (e.g., water levels and aquatic macrophytes) and the North Carolina Wildlife Resources Commission (e.g., the fishery). It was impounded in 1915 by the construction of the Lookout Shoals Dam and Hydroelectric Station for power production, which is the primary use of the reservoir; municipal water supply and recreation are secondary uses (Duke Power 1999; NCDWQ 2003). Parrot-feather
Water-level management and aquatic herbicides have been previously utilized in attempts to control parrot-feather and Brazilian elodea abundances and distributions. Brazilian elodea has been successfully controlled with winter drawdowns of this reservoir, which have restricted the infestation to the riverine section from the Oxford Hydroelectric Dam, that impounds Lake Hickory, downstream about five km to the upstream impounded area of Lookout Shoals Lake. Parrot-feather has infested approximately 90 ha of the littoral zone of the upper reservoir due to the ineffectiveness of winter drawdowns at controlling its spread and has been selectively controlled using aquatic herbicides (Ken Manuel, Duke Energy, personal communication). Recent installation of a municipal water intake facility on Lookout Shoals Lake, however, has resulted in increased restrictions on the use of aquatic herbicides, and other control options were sought for the management of this invasive aquatic plant. While grass carp are a common control option for nuisance aquatic plants, parrot-feather is not a food source preferred by grass carp (Avault 1965; Pine and Anderson 1991; Catarino et al. 1997). This presented an experimental
opportunity to research a high-density grass carp stocking management technique to control a nuisance aquatic plant species that was not a food source preferred by grass carp.
Methods
The impact of a high-density grass carp stocking to control parrot-feather on fish populations in Lookout Shoals Lake was evaluated over time using shoreline electrofishing catch data collected prior to and after grass carp were stocked. Fish populations associated with eight, 100-m shoreline transects (Figure 2) were sampled seasonally during spring, summer and fall of 2004-2007 using a boat-mounted electrofisher operating at 4-6 A, 120 pulses/sec, DC. These transects are located in the upper area of Lookout Shoals Lake, where the parrot-feather infestations were extensive and any effects of grass carp were likely to occur. Sampling these transects began in summer 2004 and continued through spring 2005, prior to grass carp stocking and from summer 2005 to spring 2007 after grass carp had been stocked. All sizes and species of fish collected were identified to species, and individually weighed (±1 g) and measured (±1 mm total length, TL).
In addition, fish population data from ten, 300-m shoreline transects (Figure 2) sampled during spring using similar techniques as described above were used for historical comparisons. These data were collected by Duke Energy biologists in 1994-1997, 2000, and 2005-2007 from shoreline transects representing available habitat types, situated throughout the middle and lower lake. All sizes and species of fish collected were identified to species, counted and weighed in aggregate (±1 g).
distributions plotted for all bluegill and yellow perch collected from the fall samples of the seasonal shoreline electrofishing transects. Mean relative weights were calculated for largemouth bass greater than 150 mm TL, bluegill greater than 80 mm TL, and yellow perch greater than 100 mm TL, collected from the seasonal shoreline electrofishing transects, using equations from Henson (1991), Hillman (1982), and Willis et al. (1991), respectively. Initially, a factorial analysis of variance with year, season, and transects as main effects was conducted for catch rates of all fish species in aggregate, bluegill, largemouth bass, redbreast sunfish, and yellow perch from the seasonal transects. Year, season, and transects were significant main effects with no interaction. Then, catch rates were analyzed by season for annual differences before and after grass carp stocking. Evidence of non-normality was detected in catch rates which was not remedied by data transformation. Thus, a Kruskal-Wallis test was utilized to detect differences among years within seasons and before and after grass carp stocking, and a Nemenyi multiple
comparison test was used to detect differences between years within each season (Zar 1996, Statistical Analysis Software 2007). All statistical comparisons were considered significant at a probability of 0.05 (alpha).
Results
representing 31 species and one hybrid complex (Table 2). Most common species by number were bluegill (47%), yellow perch (15%), largemouth bass (13%), and redbreast sunfish (12%).
100-m seasonal shoreline electrofishing transects
SE) during spring 2005 versus 10 fish/100m (3.9 SE) during spring 2007, 25 fish/100 m (8.2 SE) during summer 2004 versus 8 fish/100 m (3.3 SE) during summer 2006, and 37 fish/100 m (11.2 SE) during fall 2004 versus 2 fish/100 m (0.6 SE) during fall 2006.
Biomass (kg/100 m) of fish species sampled from the eight, 100-m seasonal
Yellow perch showed a significant reduction in biomass in both fall samples after grass carp stocking. Mean biomass of yellow perch was 0.92 kg/100 m (0.27 SE) during fall 2004 versus 0.14 kg/100 m (0.04 SE) during fall 2006.
Mean lengths and length distributions of bluegill and yellow perch showed some variability before and after grass carp stocking (Figures 5 and 6). Mean length of bluegill during fall 2004, before grass carp stocking, was 78 mm (2.0 SE). After grass carp stocking, mean length of bluegill was 104 mm (2.5 SE) during fall 2005 and 93 mm (1.7 SE) during fall 2006. Mean lengths of yellow perch during fall 2004, before grass carp stocking, was 121 mm (2.4 SE). After grass carp stocking, mean length of yellow perch was 160 mm (7.5 SE) during fall 2005 and 179 mm (8.0 SE) during fall 2006.