University of Windsor University of Windsor
Scholarship at UWindsor
Scholarship at UWindsor
Electronic Theses and Dissertations Theses, Dissertations, and Major Papers
2008
A classification system for promoting and assessing
A classification system for promoting and assessing
redevelopment of brownfield sites
redevelopment of brownfield sites
Shovini Dasgupta University of Windsor
Follow this and additional works at: https://scholar.uwindsor.ca/etd
Recommended Citation Recommended Citation
Dasgupta, Shovini, "A classification system for promoting and assessing redevelopment of brownfield sites" (2008). Electronic Theses and Dissertations. 8038.
https://scholar.uwindsor.ca/etd/8038
A CLASSIFICATION SYSTEM FOR PROMOTING AND
ASSESSING REDEVELOPMENT OF BROWNFIELD SITES
By
Shovini Dasgupta
A Dissertation submitted to the Faculty of Graduate Studies
through the Department of Civil and Environmental Engineering in partial fulfillment of the requirements for the
Degree of Doctor of Philosophy at the University of Windsor
Windsor, Ontario, Canada
2008
1*1
Library and Archives Canada Published Heritage Branch Bibliothgque et Archives Canada Direction duPatrimoine de l'6dition
395 Wellington Street Ottawa ON K1A0N4 Canada
395, rue Wellington Ottawa ON K1A 0N4 Canada
Your file Votre reference
ISBN: 978-0-494-62767-9 Our file Notre r6f6rence
ISBN: 978-0-494-62767-9
NOTICE: AVIS:
The author has granted a
non-exclusive license allowing Library and Archives Canada to reproduce, publish, archive, preserve, conserve, communicate to the public by
telecommunication or on the Internet, loan, distribute and sell theses
worldwide, for commercial or non-commercial purposes, in microform, paper, electronic and/or any other formats.
L'auteur a accorde une licence non exclusive permettant a la Bibliotheque et Archives Canada de reproduire, publier, archiver, sauvegarder, conserver, transmettre au public par telecommunication ou par Nnternet, preter, distribuer et vendre des thises partout dans le monde, a des fins commerciales ou autres, sur support microforme, papier, electronique et/ou autres formats.
The author retains copyright ownership and moral rights in this thesis. Neither the thesis nor substantial extracts from it may be printed or otherwise reproduced without the author's permission.
L'auteur conserve la propriete du droit d'auteur et des droits moraux qui protege cette these. Ni la these ni des extraits substantiels de celle-ci ne doivent etre imprimes ou autrement
reproduits sans son autorisation.
In compliance with the Canadian Privacy Act some supporting forms may have been removed from this thesis.
While these forms may be included in the document page count, their removal does not represent any loss of content from the thesis.
Conformement a la loi canadienne sur la protection de la vie privee, quelques formulaires secondaires ont ete enleves de cette these.
Bien que ces formulaires aient inclus dans la pagination, il n'y aura aucun contenu manquant.
I + I
AUTHOR'S DECLARATION OF ORIGINALITY
I hereby certify that I am the sole author of this thesis and that no part of this thesis has been published or submitted for publication.
I certify that, to the best of my knowledge, my thesis does not infringe upon anyone's copyright nor violate any proprietary rights and that any ideas, techniques, quotations, or any other material from the work of other people included in my thesis, published or otherwise, are fully acknowledged in accordance with the standard referencing practices. Furthermore, to the extent that I have included copyrighted material that surpasses the bounds of fair dealing within the meaning of the Canada Copyright Act, I certify that I have obtained a written permission from the copyright owner(s) to include such material(s) in my thesis and have included copies of such copyright clearances to my appendix.
ABSTRACT
Significant economic, legal and environmental concerns present obstacles to the
redevelopment of thousands of brownfields in Canada, which have the potential to
stimulate economic growth, community revitalization, and urban renewal. Individually
analyzing the threats and opportunities associated with redevelopment of each single site
results in spending of significant amounts of resources. To overcome this limitation, the
dissertation has developed a methodology for effectively classifying brownfields on the
basis of a broad set of factors including contaminants, infrastructure and ecological
conditions, revenue opportunities, community pressure and anticipated land uses, so that
they can be analyzed categorically. Building on a review of existing classification
systems, this dissertation provides a structured means for integrating the objectives of
multiple stakeholders (e.g., municipality, developer, regulator, community) in a
comprehensive manner. The classification system is designed to be transparent and
straightforward and accounts for different redevelopment opportunities. The brownfield
sites are evaluated based on attributes of the site and their suitability towards various
potential redevelopment opportunities. Even though the system is applicable to all the
stakeholders, municipalities are given a special emphasis as they represent a balance
among various stakeholders' interests in any brownfield revitalization effort. The
applicability of the developed classification is demonstrated using an illustrative example
of a site entitled ABC automotive service garage with detailed calculations and flow
diagrams. This classification methodology enables the greater understanding of issues
specific to different brownfield scenarios, encourages the effective use of policy and
resources, demonstrates the tradeoffs and has the potential to serve as an educational and
DEDICATION
This dissertation is dedicated to my beloved husband Souvik.
Souvik, it is a challenge to be a doctoral student, but it is a much greater challenge to be the loving spouse of a doctoral student; to support and encourage her during the days of disappointment, and to share and cherish the joyous moments. All I want to say to you is "Thank you" for being my best friend, an earnest soul-mate, an honest critique of all my work, and a patient supporter of all my endeavours for four long years! I am excited to
start a new phase of our lives together!
I would also like to mention the name of my late grandfather, Parimal Kumar Dasgupta.
Dadabhai\ I know you have always taken great pride in all my achievements, even when they were insignificant. I wish I could share this moment with you. Wherever you are, I
know you will be very proud of me today!
Last but not least, thanks very much to my loving parents, Mr. Udit Bhanu Dasgupta and Ms. Madhumita Dasgupta, for teaching me to appreciate the value of education and
ACKNOWLEDGEMENT
I wish to take the opportunity to thank
• My supervisor, Dr. Edwin Tam, for his technical guidance and financial support, without which it would not have been possible to complete this research successfully. Dr. Tam, I will always look up to you for your inspiration, guidance, and research insight, as well as your kindness as an individual. Thanks very much for being not only my supervisor, but also my most admirable intellectual and professional mentor.
• Our industrial partners, especially Peter Beukema and Patrick Shriner from AMEC, Marcia Wallace from the Province of Ontario, and Wendy Meininger-Dyk from Seneca College. Your practical advice and support were extremely helpful in the successful completion of this research.
• Our municipality partner, Mark Brickell from the Niagara Economic Development Corporation, for being one of the key initiators of this project to develop a brownfield classification, and for his advice, encouragement and support throughout this research. Thanks to Neil Robertson, Thom Hunt and the rest of the Planning Department staff from the City of Windsor for their invaluable advice.
• Dr. Philip Byer from the University of Toronto for his advice, suggestions and extremely valuable input to my research.
• My research partner from the University of Toronto, Nik Schruder, for taking care of a significant portion of the health risk evaluation for brownfields, and for his valuable comments and critiques during the initial phase of this research. Nik, it was a pleasure working with an energetic, kind and knowledgeable individual like you.
• My committee member, Dr. Nihar Biswas, for his insightful advice, continued guidance and support throughout my journey as a graduate student since 2002. I am grateful to him for all the help and guidance that I have received from him since the very first day I came to Canada.
• My thanks are also extended to Dr. Rajesh Seth and Dr. Phil Graniero for taking the time to review my work and participate in my examination committee.
• Special thanks to Dr. Chris Kennedy from the University of Toronto for participating in my committee and taking the time to review my dissertation.
TABLE OF CONTENTS
AUTHOR'S DECLARATION OF ORIGINALITY iii
ABSTRACT iv
DEDICATION v
ACKNOWLEDGEMENTS vi
LIST OF TABLES xii
LIST OF FIGURES xiv
LIST OF ABBREVIATIONS xvi
1.0 INTRODUCTION 1
1.1 Brownfield Definitions 2 1.2 Recent Trends and Need for a Brownfield Classification System 4
1.3 Objectives of the Dissertation 6
1.4 User Characteristics 7 1.5 Organization of the Dissertation and Specific Contributions 7
2.0 LITERATURE REVIEW 9
2.1 Background of Brownfield Classification Systems 9 2.2 Assessment of Existing Classification Systems 10
2.2.1 Type 1: "Health and Risk" Based Classification Systems 10 2.2.2 Type 2: "Financial Incentive" Based Classification Systems 17 2.2.3 Type3: Relevant and Critical Attribute Based Classification 22
Systems
2.2.4 Typology Implied in the Definition of Brownfield Provided by 26 NRTEE in 2003
2.3 Summary of Available Brownfield Classifications 31 2.4 Classification Approach Derived from the Literature Review 32
3.0 BASIC CHARACHTERISTICS OF THE CLASSIFICATION SYSTEM 34
3.1 Summary of Basic Charachteristics of the Classification System 34
3.1.1 Expectations from the Expert System 34 3.1.2 Adapting a Tiered Approach to Overcome Data-gaps 34
3.1.3 Non Numerical Approach in Overall Rating 35 3.1.4 Time Dimension 3 6
3.1.5 Recognizing General versus Specific Scenarios by Raising Red Flags 39
3.1.6 Use of Default Values for Decision Making 39
3.2 Classification Research Scope and Boundaries 40
3.3 Illustrative Example 42
4.1 Overview of Approach 43 4.2 Individual Levels within the Framework 43
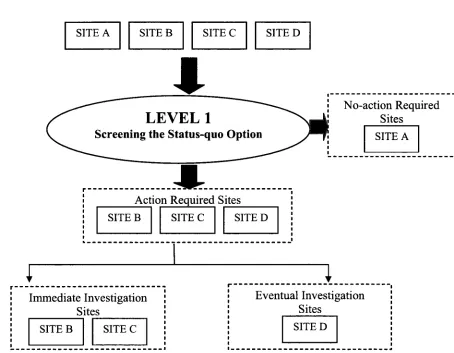
4.2.1 Level 1: Screening the Status-quo Option 43 4.2.2 Level 2: Screening-out Limited Potential Site Uses 46
4.2.3 Level 3: Classifying Sites Based on Basic End Uses 47 4.2.4 Level 3-Advanced: Assessing the Severity of CAR 49
4.3 Expectations of Information Required 50 4.4 Applicability of the Proposed Classification System 50
5.0 LEVEL 1: SCREENING THE STATUS QUO OPTION 52
5.1 Overview of Level 1 52 5.2 Information Requirement 53 5.3 Decision Criteria and Assessment 54
5.3.1 Level 1 Checklist 54 5.3.2 Sorting the Checklist Information and Level 1 Grouping 57
5.3.3 Contaminant Perspective on Sites with Potential Chemical Hazard 59
5.4 Summary 61 5.5 Illustrative Example: Level 1 61
5.5.1 Site Description 61 5.5.2 Checklist 61 5.5.3 Decision Methodology 62
5.5.4 Output: Level 1 66 5.5.5 Discussion 67
6.0 LEVEL 2: SCREENING-OUT LIMITED POTENTIAL SITE USES 68
6.1 Overview of Level 2 68 6.2 Information Requirements 70 6.3 Decision Methodology 70
6.3.1 Summary of Decision Methodology 70 6.3.2 List of Development Constraints 72 6.3.3 Siting Protocols for Various End Uses 72
6.4 Summary 73 6.5 Illustrative Example: Level 2 75
6.5.1 Site Location and Objectives 75 6.5.2 List of Development Resistant Features 75
6.5.3 Minimal Area Requirement 76 6.5.4 Standard Siting Protocols for Residential End Use 76
6.5.5 Standard Siting Protocols for Industrial End Use 79
6.5.6 Output: Level 2 80
7.0 LEVEL 3 AND LEVEL 3-ADVANCED 81
7.1 Level 3: Classifying Sites based on Basic End Uses 81 7.2 Level 3-Advanced: Assessing the Severity of Required Action 86
8.0 LAND AND INFRASTRUCTURE- LEVEL 3 AND LEVEL 3-ADVANCED 87
8.2 Information Requirement 89 8.3 Onsite Assets Module 89
8.3.1 Step 1: Availability Assessment 90 8.3.2 Step 2: Onsite Assets Hazard Potential 90
8.3.2. A Assessing Hazardous Building Materials 93 8.3.2. B Regulatory Chemicals Containing Equipment and Storage 100
Assessment
8.3.2.C Storage Tank Equivalence Assessment 100
8.4 Ecology Module 101 8.4.1 Step 1: Excluding Low Ecological Impact (LEI) Sites From 102
Ecological Evaluation
8.4.2 Step 2: Criteria To Be Considered As A High Ecological Sensitivity 104 (HES) Site
8.4.3 Step 3: Simplified Ecological Evaluation (SEE) 105
8.5 Site Accessibility Module 108 8.6 Overall Level 3 and Level 3-Advanced Score 108
8.7 Illustrative Example: Level 3- Land and Infrastructure 111 8.7.1 Information Requirement for Illustrative Example 111
8.7.1.A Potential Residential Use 113 8.7.1.B Potential Commercial Use 113 8.7.2 Land and Infrastructure Evaluation for Potential Residential Use 113
8.7.2.A Onsite Assets Module - Residential 113 8.7.2.B Ecology Module - Residential 120 8.7.2.C Accessibility Module - Residential 125 8.7.2.D Overall Land and Infrastructure Score for Residential Use 126
8.7.3 Land and Infrastructure Evaluation for Potential Commercial Use 127
8.7.2.A Onsite Assets Module - Commercial 127 8.7.2.B Ecology Module - Commercial 131 8.7.2.C Accessibility Module- Commercial 132 8.7.2.D Overall Land and Infrastructure Score for Commercial Use 133
8.8 Conclusion 134
9.0 ECONOMICS - LEVEL 3 AND LEVEL 3-ADVANCED 135
9.1 Overview of Economics 135 9.2 Information Requirement 136 9.3 Decision Methodology 138
9.3.1 Importance of Exit Strategies 138 9.3.2 Decision Methodology for Sale after Redevelopment 138
9.3.3 Estimating the Internal Rate of Return from the Project (IRR Proj) 139
9.3.4 Estimating Minimum Attractive Rate of Return (MARR) 143
9.3.5 Level 3 Evaluations for Economics 148 9.3.6 Level 3-Advanced: Assessing the Degree of CRA for Economics 148
9.3.7 Opportunities for Extending the Concept of Risk Premium and Tax 151 Rate
9.4 Illustrative Example: Level 3 and Level 3-Advanced - Economics 152
9.4.2 Decision Methodology 153 9.4.2.A Residential Redevelopment Option 153
9.4.2.B Commercial Redevelopment Option 158
9.4.2.C Sale After Remediation 159
9.4.3 Discussion 161
9.5 Conclusion 162
10.0 HEALTH - LEVEL 3 AND LEVEL 3-ADVANCED 163
10.1 Use of CHSR Methodology to Evaluate Health 163 10.2 Scoring the Severity of Risk Using CHSR Methodology 164
10.2.1 Ground-water Pathway 164 10.2.2 Surface-water Pathway 165 10.2.3 Surface-soil Pathway 165 10.2.4 Vapor-intrusion pathway 165 10.3 SAR(Severity of Action Required) Score for Each Module 167
10.4 Level 3 Evaluation for Health 167 10.5 Illustrative Example: Level 3 and Level 3-Advanced Health 167
11.0 SOCIAL/COMMUNITY- LEVEL 3 AND LEVEL 3-ADVANCED 170
11.1 Overview of Community 170 11.1.1 Community Concerns 170 11.1.2 Community Need for the End Use 171
11.1.3 Tax Base 171 11.2 Conclusion 172
12.0 SUMMARY OF OUTPUTS FROM THE OVERALL CLASSIFICATION 174
12.1 Output from the Overall Classification System 174
12.2 Demonstrating the Tradeoffs 176
13.0 CONCLUSIONS AND RECOMMENDATIONS 179
13.1 Conclusions 179 13.2 Recommendations 179
REFERENCES 182
APPENDICES 188
APPENDIX-A: Input Data for Evaluating ABC Automotive Service Garage 188 APPENDIX-B: Chemicals Considered Under Each Contaminant Group Discussed in 194
Level 1
APPENDIX-C: Contaminants Associated with Historical Uses and Disposed 199 Chemicals
APPENDIX-D: Minimum Land Area Required for Various Potential End Uses 202
Assembly.
APPENDIX-G: List of Common Asbestos Containing Materials 208 APPENDIX-H: List of Chemicals that Aid in Deciding if the Site is a Low 211
Ecological Impact (LEI) Site
APPENDIX-I: Limiting Concentrations of Hazardous Substances for Ecological 213 Evaluation
APPENDIX-J: Sample Remediation Cost for Various Techniques Used- 216 Remediation Technology Cost Compendium
APPENDIX K: Flow Diagrams for Health Risk Pathways 222
LIST OF TABLES
Table 2-1 Type 1 Classification of Brownfield Sites and their Country of Use 11
Table 2-2 Example Scoring Guideline for NCS (CCME, 1992) 13 Table 2-3 Ranking Matrix for Potential Marine and Aquatic Sites of Concern 15
(CCME, 1998)
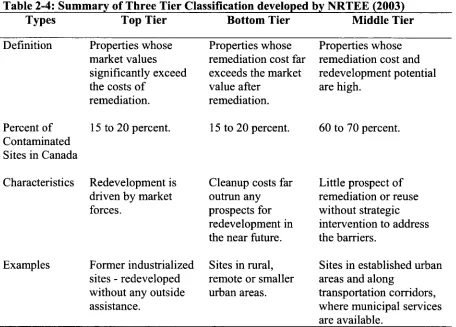
Table 2-4 Summary of Three Tier Classification developed by NRTEE (2003) 17
Table 2-5 Financial Classification of Brownfield Sites (AR, 2005) 19 Table 2-6 The Selection of Typologies Identified by HYGIA Project (HYGIA, 23
2002)
Table 2-7 Examples of Potentially Contaminated Sites and an Initial Estimation 25 of Information Availability and Risk Associated with Them
(NRTEE, 1997b)
Table 2-8 Typology of Brownfield sites -Urban Mines Ltd. (Alker et al., 2000) 28 Table 2-9 Critical Characteristics of Brownfield sites - Urban Mines Ltd. 29
(Alker et al., 2000)
Table 2-10 Comprehensive List of Basis for Comparison for Type 3 30 Classifications .
Table 4-1 Example Output-Matrix of Level 3 49 Table 5-1 Contaminant Groups Present in ABC Automotive Service Garage 66
Table 6-1 Description of Categories of End Uses Considered in Level 2 69 (NBCC, 2005)
Table 6-2 List of Development Resistant Features 73 Table 6-3 Standard Siting Protocols for Various End uses 75
Table 6-4 List of Development Constraining Features for ABC Automotive 76 Service Garage
Table 6-5 Standard Siting Protocol Checklist for ABC Automotive Service 77 Garage - Residential
Table 6-6 Standard Siting Protocol Checklist for ABC Automotive Service 79 Garage - Industrial
Table 7-1 Categories Considered for Level 3 Assessment of Classification 82 Table 7-2 Evaluation Modules Considered Under Different Categories 84
Table 7-3 Possible Output Matrices from Level 3 85 Table 8-1 Adjusted Intermediate SAR Score 100 Table 8-2 UST/AST/ Underground Structure Equivalents 101
Table 8-3 Criteria for Qualifying as an Low Ecological Impact (LEI) site 104 Table 8-4 Criteria for Qualifying as a High Ecological Sensitivity (HES) Site 105
Table 8-5 Ecological Sensitivity of Site Attributes 106 Table 8-6 Criteria for Site Accessibility Module 109 Table 8-7 Adjustment of Score for Regulated Chemical Storage/ Equipment 119
Table 8-8 Criteria for Qualifying as a Low Ecological Impact (LEI) Site- 121 Residential Use
Table 8-9 Criteria for Qualifying as a High Ecological Sensitivity (HES) Site- 122 Residential Use
Table 8-11 Site Accessibility Score for ABC Automotive Service Garage- 125 Residential Use
Table 8-12 Adjustment of Score for Regulated Chemical Storage/Equipment 130 Table 8-13 Criteria for Qualifying as a Low Ecological Impact (LEI) Site - 131
Commercial Use
Table 8-14 Site Accessibility Score for ABC Automotive Service Garage - 132 Commercial Use
Table 9-1 Example values of Risk Premium (risk ratings are adapted from 147 Mundy (2001).
Table 9-2 Possible Sources of Funding for the Residential Redevelopment 156 Project
Table 9-3 Possible Sources of Funding for the Residential Redevelopment 158 Project - Scenario II
Table 9-4 Possible Sources of Funding for the Commercial Redevelopment 159 Project
Table 10-1 Summary of the Results from CHSR Based on Information Provided 168 from the Phase II ESA
Table 12-1 Summary of Outputs Obtained at Each Level of the Classification 175 System for the ABC Automotive Service Garage
LIST OF FIGURES
Figure 2-1 Stages of Redevelopment of a Brownfield Site 20 Figure 2-2 The Brownfield redevelopment types A-B-C Model 21 Figure 2-3 Brownfield Typology as per NRTEE Definition (2003) 27 Figure 3-1 Influence of Time Dimension on the Proposed Brownfield 38
Classification [Adopted from Mundy (2001)]
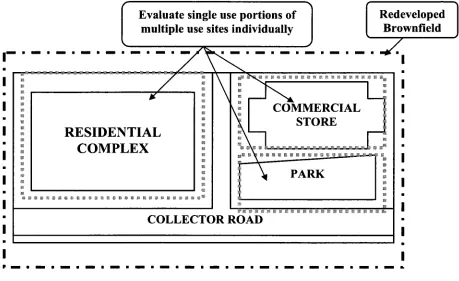
Figure 3-2 Single Use versus Multiple Use Sites 42 Figure 4-1 Levels of the Proposed Classification System 44
Figure 4-2 Classification System for Assessing and Promoting Redevelopment 45 of Brownfield Sites
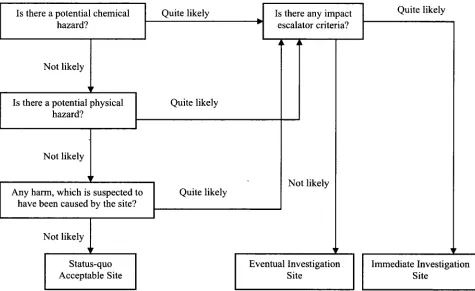
Figure 5-1 Level 1 User Checklist 55 Figure 5-2 Decision Criteria for Level 1 59 Figure 5-3 Level 1: Screening the Status-quo Option 60
Figure 5-4 Example Level 1 Checklist for ABC Automotive Service Garage 63
Figure 5-5 Decision Flow for ABC Automotive Service Garage 65
Figure 6-1 Decision Criteria for Level 2 71 Figure 6-2 Location of ABC Automotive Service Garage 75
Figure 6-3 Availability of Public Transportation Services For ABC 78 Automotive Service Garage
Figure 6-4 Factories and Industries Near ABC Automotive Service Garage 78 Figure 6-5 Landfill and Disposal Facilities Near ABC Automotive Service 79
Garage
Figure 7-1 Example Framework for Level 3 Evaluation (Land and 84 Infrastructure)
Figure 7-2 Sample Output Matrix for Level 3 Classification of Brownfield 85 Sites
Figure 8-1 Evaluation of Land and Infrastructure for Brownfield Classification 88
Figure 8-2 Onsite Assets Module: Step 1- Compatibility Assessment 91 Figure 8-3 Onsite Assets Module Step 2: Onsite Assets Hazard Potential 92
Figure 8-4 Assessment of Hazardous Building Materials 94 Figure 8-5 Methodology for Assessment of the Lead Score 97
Figure 8-6 Ecological Evaluation Module 103 Figure 8-7 Simplified Ecological Evaluation (Step 3.A) 106
Figure 8-8 Evaluation of Land and Infrastructure for Brownfield Classification 110 Figure 8-9 Compatibility Assessment for ABC Automotive Service Garage- 115
Residential Use
Figure 8-10 Onsite Assets Module Step 2: Onsite Assets Hazard Potential - 116 Residential Use
Figure 8-11 Assessment of Hazardous Building Materials - ABC Automotive 117 Service Garage- Residential Use
Figure 8-12 Methodology for Assessment of the Lead Score- ABC Automotive 118 Service Garage- Residential Use
Figure 8-13 Simplified Ecological Evaluation (Step 3.A)- Residential Use 123
Evaluation of Land and Infrastructure for Brownfield Classification 127 - Residential Use
Compatibility Assessment for ABC Automotive Service Garage- 129 Commercial Use
Onsite Assets Module Step 2: Onsite Assets Hazard Potential - 130 Commercial Use
Evaluation of Land and Infrastructure for Brownfield Classification 133 - Commercial Use
Level 3 Economic Evaluation of Brownfield Sites 136
Schematic Diagram for Estimating MARR 144
Distribution of Risk Premium 146 Parameters Required for Level 3 and Level 3 Advanced Economic 150
Evaluations
Evaluation of Health for Brownfield Classification 166 Evaluation of Health for Brownfield Classification- ABC 169 Automotive Service Garage - both Residential and Commercial
Options
Figure 11-1 Social/Community Evaluation for Brownfield Classification 172 Figure 8-15
Figure 8-16
Figure 8-17
Figure 8-18
Figure 9-1 Figure 9-2 Figure 9-3 Figure 9-4
A BC Bu
C i , C 2 , . . C t
CCME CHSR CIP CRA DC Du D dc E EC Eu ESA FMV HES HRS H HYGIA I
I R R P r o j L
LEI L M MARR
M A R Rr i s kf r e e
MDL MNR MOE NCS NPV PEL PHCs PSF RDC RHAS RMC RSS RP
LIST OF ABBREVIATIONS
Area of contaminated soil Backfilling cost
Backfilling cost per unit weight of soil Cash flow in year 1,2, T
Canadian Council of Minister of the Environment Contamination Health and Safety Risk
Community Improvement Plan Category Requiring Action Haulage and disposal cost of soil
Haulage and disposal cost per unit weight of soil
Debt from bank expressed as a fraction of total revitalization cost Average depth of contaminated soil
Equity investment of the developer expressed as a fraction of total revitalization cost;
Excavation cost
Excavation cost per unit weight of soil Environmental Site Assessments Fair Market Value
High Ecological Sensitivity site Hazardous Ranking System High
Hybrid Geophysical technology for the Evaluation of Insidious contaminated Areas
Non refundable incentives (government) expressed as a fraction of total revitalization cost
Internal Rate of Return for the Project
Low interest loans expressed as a fraction of total revitalization cost Low Ecological Impact sites
Low Med
Minimum Attractive Rate of Return
Risk free Minimum Attractive Rate of Return Minimum Detectable Limit
Ministry of Natural Resources Ministry of the Environment National Classification System Net Present Value
Probable Effect Level Petroleum hydrocarbons Pre Submission Form Redevelopment cost
Rapid Hazard Assessment System Remediation cost
r0 Opportunity cost of the developer (%)
rL Capitalization rate on low interest loans (%)
rp Prime interest rate (%)
SAR Severity of Action Required SEE Simplified Ecological Evaluation SQGTG Soil Quality Guidelines Task Group SVOCs Semi Volatile Organic Compounds s Stigma
T Duration of the project in years Ti Duration of remediation
T2 Duration of redevelopment t Effective Tax Rate for the project t' Overall tax rate in the region
ti Reduction in effective tax rate due to tax incentive programs TEE Terrestrial Ecological Evaluation
UC Upfront cost
US EPA United States Environmental Protection Agency UST Underground Storage Tank
V Total volume of soil to be disposed during dig and dump VOCs Volatile Organic Compounds
1.0 INTRODUCTION
In Canada, there are over 30,000 brownfield sites representing significant potential in terms
of economic growth, community revitalization, and urban renewal (NRTEE, 1997a). About
3900 (NRTEE, 1996) of such sites are situated in Ontario and 4200 in British Columbia
(Simons, 1998). In the United States there are an estimated 425,000 brownfield sites that
tarnish the urban landscapes (GAO, 1995). The US EPA estimates that there are between
500,000 and 1 million brownfields, typically in urban areas, in American communities (Bush,
2002). About 2000 such sites exist in Chicago, 5000 in Georgia and 8000 in New Jersey
(Schmitter, 1998; Bartsch et al., 2001; United States Conference of Mayors, 2000). Many of
these sites present opportunities to revitalize the environment, provide new jobs, increase the
tax base, control urban sprawl and renew obsolete civil infrastructure (Amekudzi and
Fomunung, 2004).
The redevelopment of these sites can lead to significant economic progress and ease the
burden on municipalities, particularly older cities, in terms of creating new infrastructure and
generating new productive lands that could be great sources of revenue for the government.
A comprehensive study prepared for the NRTEE in 2002 by Royal Analytics Inc. (RAI)
entitled "Economic Impact of Brownfield Redevelopment Activities in Canada" documented
that every brownfield redevelopment investment dollar brings forth $3.80 in the output of
various industries in the Canadian economy. In addition to this, every dollar spent on
brownfields (by private or public investors) could result in an extra $0.22 in federal tax
revenues (RAI, 2002). This is in addition to the original tax revenue that was being received
without the brownfields being redeveloped. Another survey conducted as a part of a recent
study undertaken by U.S. Conference of Mayors (2000) revealed that 179 US cities indicated
that if all the brownfields were redeveloped, the responding cities would realize $5 -$13.4 M
in terms of additional tax revenues per city per year. These figures clearly depict the
significance of brownfield cleanups.
Despite the significant economic benefits of brownfield cleanup to the individual cities, the
primary reasons these brownfield projects do not attract potential developers is because of
cited concern of liability that the site redeveloper or owner may face from poorly assessed
and controlled health risks. As a result, the tendency until recently was to prefer "greenfield"
(previously undeveloped) sites for new redevelopments. This situation was exacerbated by
the abundance of general information and the lack of specific information on how any
particular brownfield can be approached, the unavailability of structured means to tackle
important issues, and the absence of an informed policy to guide the interested stakeholders.
All of these factors tend to pose challenges towards revitalizing brownfields.
As a result, evaluating brownfields and promoting their effective revitalization would benefit
greatly from identifying characteristics that lead to the systematic evaluation of brownfields.
This can be achieved by developing a taxonomy or classification of brownfield sites.
There continues to be significant advancement of the types of brownfields technologies
available for assessing and treating contaminants, but a structured means for integrating the
objectives of multiple stakeholders (e.g., municipality, developer, regulator, community) in a
concise manner is still absent. No readily available classification methods exists which could
differentiate among the brownfields based on an overall suite of relevant characteristics, such
as community settings, site characteristics, contaminant characteristics, development
potential and financial viability. Because of this, it is difficult to communicate brownfield
issues to unfamiliar parties and it is necessary to continually formulate "new" strategies for
recurring or categorical situations. In order to overcome this gap, this research develops a
methodology for classifying brownfields in a systematic manner.
The first step for developing a systematic classification starts with identification of a
common and clear definition of brownfields.
1.1 BROWNFIELD DEFINITION
There are several regulatory definitions of brownfields used across the world. The term
"brownfield" is generally used to describe previously developed industrial or commercial
properties, where the potential for redevelopment is complicated by the presence of real or
However, from a regulatory standpoint, brownfields do not have a common definition. In
United Kingdom (UK) and Australia the term brownfield simply indicates previously
developed lands (Roberts et al., 1998). However, the term has more specific definitions in United States (US) and Canada. In the US, the brownfield definition is found in Public Law
107-118 (H.R. 2869) - "Small Business Liability Relief and Brownfields Revitalization Act"
signed into law in 2002. This defines brownfields as:
"Real property, the expansion, redevelopment, or reuse of which may be complicated by the presence or potential presence of a hazardous substance, pollutant, or contaminant."
This definition was later amended to exclude certain types of severely contaminated
properties that have very high concentrations of hazardous waste, such as the Superfund
sites, operating facilities that are subjected to investigation/remedial-actions/cleanups and a
few waste disposal/dump sites considered under waste disposal acts (EPA, 2007).
In Canada, the definition of brownfield is more general and includes severely contaminated
sites as well. The first formal definition of brownfield in Canada was provided by the
National Roundtable on the Environment and the Economy (NRTEE) in 2003 in a report
entitled "Cleaning up the Past, Building the Future - A National Brownfields Redevelopment
Strategy for Canada", which defined a "brownfield" as:
"An abandoned, vacant, derelict or underutilized commercial or industrial property where past actions have resulted in actual or perceived contamination and where there is an active potential for redevelopment. "
Although this definition identifies "an active potential for redevelopment" to be one of the
necessary conditions of being a brownfield realistically it may not be possible to evaluate the
potential without a minimal site investigation by the municipalities or the developers. In the
their individual specific needs and incorporate this definition into their Official Plan or
Community Improvement Plan (CIP) (AR, 2007).
Therefore, from a regulatory standpoint the brownfields do not have a common definition.
However, in spite of the differences, all brownfield definitions share the following key
points:
• Sites are often old industrial, commercial or institutional facilities.
• Sites are often strategically located in areas where municipal services and infrastructure
are in place (AR, 2007).
• Sites are abandoned/idled or underused due to real or perceived contamination (AR,
2007).
The definition of brownfield provided by NRTEE (2003) mentions all these key points and
has been used as the working definition of this research. Moreover, using the definition
provided by NRTEE as the starting point could enhance the applicability of this classification
system to Canadian scenarios.
1.2 RECENT TRENDS AND NEED FOR A BROWNFIELD CLASSIFICATION SYSTEM
In recent years the push to redevelop abandoned sites has increased significantly to promote
urban renewal, "smart growth" and return brownfield sites to more productive uses (Tam and
Byer, 2004). Policies have also been developed to encourage brownfield development
endeavors (Bobechko, 2005). Whether a brownfield redevelopment could promote "smart
growth" and community sustainability or not depends mostly on a proper planning. Planning
is based significantly on knowledge gathered from case studies, local situations and expert
judgment. In some cases, it is possible to employ specific remedies that have been proven
under similar discrete condition. However, a systematic classification to capture the
knowledge from these different sources and to enforce a structured approach to the proper
evaluation of contaminated sites is limited (Martin and Toll, 2006). Such systematic
approaches to revitalizing these sites is crucial for developers, communities and the
authorities, and communities to understand the multiple and complex issues related to
brownfields in order to make sound decisions. Practical experience and research in Canada
and abroad demonstrates that if the appropriate mechanisms and decision tools can be put in
place, then brownfield sites can be redeveloped and significant economic, environmental and
social benefits can be realized locally, regionally and nationally (EPA, 2006).
Regulatory approaches have been recently developed that tend to facilitate brownfields
development and more clearly streamline the expectations of all stakeholder groups such as
property owners, potential purchasers and regulators. Recent legislative improvements, such
as Bill 153 in Ontario which outlines the Record of Site Condition (RSC), are considered as significant advancements in encouraging brownfield redevelopment. RSC supercedes the
1996 Ministry of the Environment (MOE) Guidelines for use of contaminated sites in
Ontario (Girlon et al., 2004) and incorporates the following key changes to streamline the
previously practiced risk assessment process for brownfields:
Requirement of Qualified Professionals
RSC regulation created the designation of a qualified professional, based on experience and
academic degree and indicated that a risk assessment be carried out under the supervision of
a qualified professional. This is an attempt to improve consistency and maintain the quality
of risk assessment process.
Pre-Submission Form (PSF)
Unlike 1996 MOE Guidelines, this new legislation does not require an independent third
party review of the site specific risk assessment. Rather, the ministry requires the submission
of a PSF prior to conducting a risk assessment to ensure that all mandatory requirements are
fulfilled instead of depending on a third party evaluation, which relies on individually biased
judgments, which are more variable perceptions (Girlon et al., 2004). This is an invaluable
effort to streamline the risk assessment.
Ecological Risk Assessment
However, these abovementioned regulatory changes do not necessarily help decision makers
evaluate the tradeoffs among different alternatives because they are intended for compliance.
Developing a systematic classification system could enable the greater understanding of
issues specific to different brownfield scenarios, encourage the effective use of these new
policy and resources, and serve as an educational and communication tool. Such a system
would allow decision makers to consider in advance how to approach a brownfield
development and promote urban renewal.
1.3 OBJECTIVE OF THE DISSERTATION
In order to advance decision making about brownfields, a research project between the
University of Windsor, the University of Toronto and Seneca College has developed a
system for classifying brownfields on the basis of land and infrastructure attributes,
community setting, economic opportunities, and human-health risk. This dissertation
develops the core methodology for this brownfields classification.
The central objective of this dissertation is to develop an expert classification system to
effectively categorize brownfields that could serve as an integrative, decision support tool
and offer categorical solutions for recurring brownfield scenarios. It will thus:
• Isolate the site situations where the status-quo may be questionable because of the
potential hazard associated with a site.
• Identify the potential redevelopment options for hazardous sites, recognize the
"limited-potential" site uses, and subsequently isolate the situations where
redevelopment may be questionable.
• Demonstrate the extent of actions that should be undertaken to overcome the barriers
for any given site revitalization option in terms of the following:
o Suitability of available land, infrastructure, ecology and service resources for
the proposed end use;
o Potential for the site to generate financial (e.g., return on investment) benefits
of redevelopment;
o Likelihood of the brownfield site to pose risk to human health.
• Create a classification system to incorporate the above aspects in an efficient and
step-wise manner.
1.4 USER CHARACTERISTICS
The primary purpose of the developed classification is to empower the municipalities to use
this classification system in any general brownfield settings, because they represent the
interest of multiple stakeholders. However, the framework is adaptable to the needs of other
stakeholders and could be used by the developers, regulators and community as well for
improved evaluation of brownfields.
1.5 ORGANIZATION OF THE DISSERTATION AND SPECIFIC CONTRIBUTIONS
The chapters in this dissertation are arranged as follows. Chapter 2 reviews twelve
contemporary brownfield classification systems and analyzes their strengths and weaknesses.
The overview of the key features of the proposed classification system is detailed in Chapter
3. A detailed description of the classification methodology and its application in an existing
case study is presented in Chapters 4 through 12. Chapter 4 describes the basic methodology
of classifying the sites and the different tiers of the developed classification. The first two
tiers (Level 1 and Level 2) of the developed classification along with their applications are
elaborated in Chapters 6 and 7. The third and fourth tiers of the classification are detailed in
Chapters 8 through 12. The conclusion and recommendations for future work are drawn in
Chapter 13.
Because this classification project is a collaborative effort, this thesis dissertation makes
specific and significant contributions in the following aspects:
• Reviewing contemporary brownfield classification systems and analyzing their
strengths and weaknesses.
• Formulating the scope of the proposed classification system (excluding health and
social aspects which were undertaken by other participants).
• Developing and refining specific procedural details for Levels 1 and 2, which were
Refining the specific procedural details for Levels 3 and Level 3-Advanced, which
were outlined but not developed (excluding health and social aspects).
Fully developing the land, infrastructure and economic models from Levels 1 though
Level 3-Advanced (defined in the following chapters) within this classification
system.
Integrating the health module developed by the University of Toronto into the revised
classification system.
2.0 LITERATURE REVIEW
Different brownfield classification systems, scoring schemes and ranking methods have been
developed in the past by various organizations in order to classify brownfields. Many of the
systems are designed for a specific group of stakeholders or jurisdictions, and cannot be used
to evaluate situations outside of their intended original use. Nevertheless, they provide useful
starting points to consider what the desirable elements within a comprehensive classification
system are. This chapter reviews twelve contemporary brownfield classification systems and
analyzes their strengths and weaknesses. The chapter concludes that the lack of a
multidisciplinary approach in the development of the existing classification systems limit
their use on a broader scale and establishes the need for a broader multidisciplinary
classification system which could serve as a basic framework for systematic
decision-making.
2.1 BACKGROUND OF BROWNFIELD CLASSIFICATION SYSTEMS
A brownfield site needs to be characterized against two major categories of attributes;
namely, site-based attributes (e.g., hydrology, topology, size, contamination, site use) and
contextual attributes (e.g., surrounding land uses, market forces, legal regime) (DETR, 2000). These two types of attributes contribute to the evaluation of brownfields: for example,
perception, liability, policy issues, legal conditions and the image of a site (Alker et al.,
2000). These attributes in turn either strengthen or weaken the probability of success of any
particular revitalization effort.
Several attempts have been carried out to characterize brownfields in terms of their
contextual and site based attributes which have led to the development of several preliminary
classifications for decision-making. However, all of these attributes are not equally important
to the different groups of stakeholders involved in the process of redevelopment. As a result
when individual stakeholder groups attempt to develop a classification system for brownfield
sites, they only capture representative information relevant to their objectives and not
necessarily all other involved stakeholders, limiting the robustness of their classification
None of the classification systems examined captures both context and site-based attributes,
and none consider both the attributes of an existing contaminated site as well as the future
site use. Of course, some of these systems were never intended to be a comprehensive system
of classification; for example, some only focus on health risk aspects. The potential downfall
however, is that some of them may be used to reach conclusions about brownfields actions
outside of their intended scope of analysis.
2.2 ASSESSMENT OF EXISTING CLASSIFICATION SYSTEMS
All the existing brownfield classification systems can be categorized into three major groups:
• Type 1: "Health and Risk" Based Classification Systems
• Type 2: "Financial Incentive" Based Classification Systems
• Type 3: "Relevant Critical Attribute" Based Classification Systems
These categories of classification systems and examples of each are reviewed in the
following sections.
2.2.1 Type 1: "Health and Risk" Based Classification Systems
The first category of taxonomy to evaluate the brownfield sites comprises of numerically
based screening tools primarily designed to assess the impacts of brownfield sites in terms of
the hazard and potential hazard to human health and environment. The taxonomy employs
some screening tools to rank a site and quantitatively indicate its magnitude of hazard
compared to other sites. Several of such classification systems are employed by different
countries to make the evaluation of contaminated sites more consistent.
Five such "Type 1" classification systems described in this section are summarized in Table
2-1. Among them, the two most important and widely used scoring mechanisms in North
America are Hazardous Ranking System (HRS) developed by US EPA for the resource
allocation in cleanup of superfund projects and the National Classification System (NCS)
Table 2-1: Type 1 Classification of Brownfield Sites and their Country of Use
Available Type 1 Classification Systems Developer Country of Use
Hazardous Ranking System (HRS) US EPA USA
National Classification System (NCS) CCME Canada
Classification of Aquatic Contaminated sites
CCME Canada
Rapid Hazard Assessment System (RHAS)
Risk Screening System (RSS)
New Zealand Ministry of Environment
New Zealand Ministry of Environment
New Zealand
New Zealand
Hazardous Ranking System (HRS) (EPA, 1990; 2006)
The Hazardous Ranking System (HRS) is the scoring system developed by the US
Environmental Protection Agency (EPA) Superfund program to assess the relative threat
associated with actual or potential releases of contaminations from a brownfield site (EPA,
1990). Based on the HRS score received, the sites are placed on a list of significantly
contaminated sites called the National Priorities List (NPL). Federal funds are allocated for
the cleanup of sites which are placed in NPL.
In the HRS scoring scheme, numerical values are assigned to factors grouped into three basic
categories to determine the risk posed by a particular site. The three factors considered are
(EPA, 1990):
• The likelihood that a site has released or has the potential to release hazardous
substances into the environment;
• The characteristics of the waste -such as toxicity, mobility and waste volume;
• The receptors affected by the release.
HRS score combines four different exposure pathways which are scored based on the above
mentioned three categories of factors. The pathways are: ground water migration (drinking
water), surface water migration (drinking water, human food chain, sensitive environments);
soil exposure (resident population, nearby population, sensitive environments); and air
(ranging from 1-100) for four different pathways. The final score is a combination of the four
individual pathway scores. Depending on the final score of a site its position in NPL is
determined.
National Classification System (NCS) (CCME, 1992)
The Canadian version of HRS Scoring system was developed by the Canadian Council of
Minister and Environment (CCME) to streamline identification and cleanup of high risk
contaminated sites in Canada (CCME, 1992). This scoring scheme is known as the National
Classification System (NCS) and can be used as a screening tool to consistently evaluate
contaminated sites for their potential to impact human health and environment.
NCS calculates the hazard and hazard potential of a site by scoring the site characteristics
that can be grouped into the following three categories:
• Contaminant characteristics - the hazards from contaminant(s) present at site;
• Exposure pathway the route through which the contaminant(s) reaches a receptor
-e.g. groundwater, surface water, or air; and
• Receptor(s) - the individuals that are affected by the release.
Each site is assigned an overall score based on several attributes belonging to the above
mentioned three groups. Depending upon the score the sites are categorized into five groups:
Class 1- Action required, Class 2- Action likely required, Class 3- Action may be required,
Class N- Action not likely required and Class I- Insufficient information.
It could be noted that the groups of factors considered in NCS is slightly different from the
factors considered in HRS. Exposure pathways are considered by both systems in a different
manner. In HRS, the contaminant characteristics and receptors are considered as factors
which influence the four migration pathways, which are the primary means to capture the
adverse effects of contaminated sites. For example, the site received four different scores
from four individual pathways (ground water, surface water, surface soil and air migration),
which are combined to determine the overall site score out of hundred (100). On the other
hand in NCS, "migration pathway" is another factor of similar significance to the
contaminated site. In NCS the contribution of migration pathways is about one third of the
total score; the rest of the score is based on the type of the contamination and the receptors.
NCS scores are driven primarily by Canadian regulations. An example of scoring guidelines
and evaluation factor of a site is given in Table 2-2. It is clear from the table that when the
groundwater quality is evaluated, the score is assigned based on Canadian Drinking Water
Guidelines (CDWG). The same is true for other attributes as well. Because of this, several
experts such as Butler and Petts (2000) remarked that it is difficult to apply CCME
classification to other jurisdictions as they relate to specific Canadian legislations.
The NCS does classify the contaminated sites in a rational and systematic manner, providing
a consistent method for evaluating contaminated sites across Canada. This method addresses
information gaps by assigning a score range as opposed to a specific score for a particular
site. If only partial information is available for a site, the site may get a score range (e.g.
25-28), rather than a specific score (e.g. 27).
Table 2-2: Example Scoring Guideline for NCS (CCME, 1992)
Category Evaluation factor: Groundwater Scoring guideline Exposure
Pathways
• Concentration of contamination significantly exceeds CDWG by two times
11
• Concentration between one and two times of CDWG
6
• Meets CDWG 0
The NCS is flexible for various special conditions where the user has the option to downplay
the score if the waste itself is of a higher concern but the particular site is not as adversely
contaminated. For example, if there is an old contaminated site where most of the radioactive
waste has decayed, the user may significantly reduce the high score assigned because of the
higher concern associated with the radioactive waste (CCME, 1992).
classification and recommended updating the CCME classification to limit its subjectivity,
reflect more recent soil quality guidelines and include information specific to northern
landscapes (CCME, 2005). Several changes were made to the original CCME classification
following the SQGTG recommendations and a revised ranking system was developed
(revised NCS) in 2005. This new system - the Federal Contaminated Sites Accelerated
Action Plan Contaminated Site Classification System - is a revised version of the original
NCS.
In the original NCS classification each site had only one final score. In case of any possible
uncertainties, a site was assigned a range of score. This updated version of CCME attempts
to resolve the issues of uncertainty by expressing the overall score of a site in two inbuilt
components. The uncertain part of the score is given as the raw potential score, whereas the certain part of the score is given by the raw known total score. The raw total score is given by:
Raw total score = Raw known total score + Raw potential total score [2.1]
Moreover, the focus of this new version of CCME is more on science behind the overall risk
management issues. The system made the "Qualified Professionals" responsible for
justifying their decision making by providing description of their Site Specific Risk
Assessment (SSRA).
The revised NCS system has also proposed to incorporate the factors specific to the proposed
land use. This is an important attempt to evaluate the "future use" of a site and incorporate
redevelopment potential as opposed to just human health and risk. However, the
consideration is mostly limited to the exposure related characteristics. The planning, social
and community wellbeing related characteristics have not been associated with the
redevelopment potential.
Lastly, this revised NCS system integrates factors specific to sites located in northern
questions and is adaptable to the specific needs of the users. The revised NCS has only been
recently proposed and opened for public review, and its final form has not yet been released
as of this writing.
Classification of Aquatic Contaminated sites (EC, 2005)
The NCS is not developed for assessment of a site with significant aquatic influence (marine
sites). A method for risk ranking of contaminated marine and aquatic sites on Canadian
federal properties was formulated by the Department of Fisheries and Ocean. This
classification scheme relies upon the Canadian Sediment Quality Guidelines for Protection of
Aquatic Life adopted by Canadian Council of Ministers of the Environment (CCME, 1998).
In order to apply this classification scheme, each attribute which contributes to the risk of a
marine site is assessed numerically using a parameter called the "Probable Effect Level
(PEL)". The concentrations above PEL limits are expected to produce adverse effects on
biological species. With the help of a prioritization scheme proposed by Long and McDonald
(1997) four relative types of aquatic contaminated sites were defined based on the PEL score
of the marine sites. The Ranking scheme is given in Table 2-3. The system is analogous to
the NCS scheme.
Table 2-3: Ranking Matrix for Potential Marine and Aquatic Sites of Concern (CCME, 1998)
Relative Priority Determination of Relative Priority Ranking
NCS-Ranking type Hazard
Ranking Score
Highest Priority Sites Mean of (mean sample PEL quotients)> 2.3 1 and/or 21 or more PEL's exceeded
Medium-high Priority Mean of (mean sample PEL quotients) 1.51-2.3 2 Sites and/or 6-20 PEL's exceeded
Medium-low Priority Sites Mean of (mean sample PEL quotients) 0.11-1.5 3 and/or 1-5 PEL's exceeded
Rapid Hazard Assessment System (RHAS) (NZ MFE, 1993)
The Rapid Hazard Assessment System (RHAS) was designed by the New Zealand Ministry
for the Environment (NZ MFE) in 1993 for evaluating brownfield sites consistently with
regard to the potential environmental risk. Identical to NCS classification RHAS involves
assessing contaminant characteristics, exposure pathways, and receptors at a site. This
scoring is very similar to NCS and the scoring criteria and cut off scores for each class is
designed based on Canadian guidelines. Minimal changes are made to make the scheme
applicable to New Zealand.
Risk Screening System (RSS) (NZ MFE, 2004)
Risk Screening System (RSS) is a simplified version of RHAS published by Ministry for the
Environment of New Zealand in order to avoid certain complications where rapid screening
is required. RSS is designed to partially replace the RAHS discussed in the previous section.
However, it was anticipated that there may be situations where RAHS may be more desirable
(NZ MFE, 2004).
Similar to NSC, the RSS is a risk based screening tool. It uses a set of attributes to indicate
the relative risk of a site which is expressed as a number ranging from 0-1. The three
categories of brownfield sites are defined as: 1) a high-risk site, 2) a low-risk site and 3) a
medium risk site based on the overall score.
Challenges of Applying Type 1 Classification Systems
All of the Type 1 Classification systems described above are established on the impact or
potential impact of sites on human health and environment. The two most significant ones in
North America are HRS and NCS. However, neither can address specific factors such as
technological, legal, political and/or socioeconomic aspects and many other contextual
attributes which are keys to any redevelopment efforts. Also, all these systems only consider
the present site with contamination existing on the site but do not capture the characteristics
of the future site (apart from the revised NCS which have some simplistic provisions for
future use) after the redevelopment has taken place. Also, the risk based score cannot be
the developers (ECO, 2005). Therefore, Type 1 classifications can be used to prioritize
remediation needs based on health risks but not redevelopment potential.
2.2.2 Type 2: "Financial Incentive" Based Classification Systems
The Type 2 classification systems were used to categorize the brownfield sites on the basis of
economic status or possible financial incentives. Three such classification systems are
discussed in this section.
Three-Tier Classification by NRTEE (2003)
The NRTEE report "Cleaning the Past Building the Future" (2003) emphasized market return
rather than on health risk and classified the brownfields in terms of their prospects for
redevelopment into three general tiers. The characteristics of these three ties of brownfield
are summarized in Table 2-4.
Table 2-4: Summary of Three Tier Classification developed by NRTEE (2003) Types Top Tier Bottom Tier Middle Tier
Definition Properties whose market values significantly exceed the costs of
remediation.
Properties whose remediation cost far exceeds the market value after
remediation.
Properties whose remediation cost and redevelopment potential are high.
Percent of Contaminated Sites in Canada
15 to 20 percent. 15 to 20 percent. 60 to 70 percent.
Characteristics Redevelopment is driven by market forces.
Cleanup costs far outrun any prospects for redevelopment in the near future.
Little prospect of remediation or reuse without strategic intervention to address the barriers.
Examples Former industrialized sites - redeveloped without any outside assistance.
Sites in rural, remote or smaller urban areas.
Sites in established urban areas and along
This three tier classification system by NRTEE shows an attempt to value market forces. In
other words, the context of redevelopment potential of a site was recognized, as opposed to
dealing with the site as an isolated piece of land with its direct impacts on human health.
This classification is simplistic and does not outline the general principles for redevelopment
or address the complicated issues of a site that is in the middle tier and therefore might have
the greatest amount of uncertainty as to what should be done. Health, liability and other
issues are largely absent and it has been assumed that remediation could give rebirth to any
site however adverse the contamination may be. The classification system briefly touched
upon the importance of a strategic location, but did not detail it. However, the movement
towards considering redevelopment potential and the context (e.g., market forces) likely
rendered this system more useful to developers and could be considered more
"redevelopment oriented" rather than just focusing on contamination issues. The system is
mostly qualitative and is not integrated with quantitative information. Lastly, the definition of
middle tier for this classification is somewhat vague and contradictory. If the middle tier sites
have high potential for redevelopment, it is unclear why such sites would have little prospect
for remediation and reuse without strategic intervention.
Financial Classification of Brownfield by aboutREMEDIATION (AR, 2005)
Another Type 2 classification formulated by aboutREMEDIATION (AR) is based on fiscal
incentives. According to AR there are three types of financial classes of brownfield sites.
These are: 1) positive value; 2) negative value; and 3) neutral value sites. The characteristics
of these three are summarized in Table 2-5.
A positive brownfield is the one where; the difference between present value and market
value of remediated site could provide return on investments. A neutral brownfield is the one
which cannot generate any return on investments without upfront government assistance, or
policy changes. Although the return is negligible, such sites do have some positive features.
A negative value brownfield is a site whose value is minimal and without government
This classification is very similar to the NRTEE (2003) three-tier classification scheme, but
the viability is decided primarily based on remediation and does not incorporate
revitalization. This classification system is inclined to overvalue fiscal components and
assumes these to be the driving forces which determine the prospects for redevelopment.
However, this is likely true only if the site is assessed from developers' perspective rather
than from a community's perspective. The comparison to determine viability of
redevelopment is carried out between "as is" value and value after remediation of the land
and not after revitalization of the land.
Table 2-5: Financial Classification of Brownfield Sites (AR, 2005) Positive Value Sites
Sites those are viable and profitable.
Sites possess good location and development potential and no incentives are required.
Represents 10-20% of current Brownfield market.
Neutral Value Sites
No gain on investment without upfront incentives or policy changes.
Worthwhile for governments to invest and create incentives.
The property has no value to a developer without upfront assistance.
Represents 60-80% of current brownfield market.
Negative Value Sites
Sites that are perceived as negative value.
Properties may be orphan, abandoned, escheated. Land value is often very low. Allowances are mandatory.
Cannot be developed without government involvements.
Environmentally, socially and economically disputed.
High-risk for investors and developers.
Represents 10-20% of current brownfield market.
The brownfield redevelopment process involves two stages as shown in Figure 2-1: 1)
remediation/cleanup and 2) revitalization. Remediation results in a cleaned up site; however,
unless it is available for end use the financial viability cannot be completely assessed. Thus,
the viability of redevelopment is not completely understood after remediation. A study by
Chay and Greenstone (1999) estimated the effect of Superfund clean-ups on local housing
hazardous waste sites to be cleaned up through the Superfund program. A follow up analysis
suggests that the benefits of Superfund clean-ups as estimated through the housing market
are substantially lower than the $43 million mean cost of Superfund clean-ups (Chay and
Greenstone, 1999). This indicates that the effect of cleanup may not necessarily result in
increase in land value unless it is revitalized. Therefore, assessing the viability of
redevelopment based on the difference between present value and value after remediation
could leave out the importance of revitalization on the site. As with the NRTEE approach
previously, AR classification scheme overvalues the fiscal component of risk and is mostly
conceptual.
REMEDIATION
REVITALIZATION
Site Available for
Potential Uses
Figure 2-1: Stages of Redevelopment of a Brownfield Site
AR (2005) also stipulates that the above three site types can be moved from one
classification to another depending on site conditions discovered, incentives and programs
delivered, and the real estate deal struck. However, the mechanisms that could be applied to
facilitate such a move are not given.
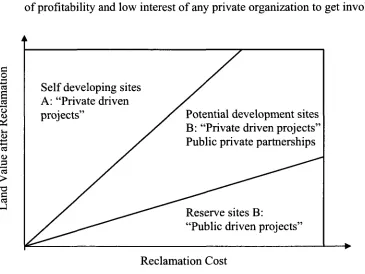
Brownfield Redevelopment Types: theA-B-C Model by CABERNET (CABERNET, 2005)
CABARNET (Concerted Action on Brownfield and Economic Regeneration Network), is a
European organization that focuses on rehabilitation of brownfields in Europe. CABARNET
adopts a perspective of examining the economic status of brownfield projects somewhat
similar to aboutRemediation. Brownfields are divided into three major classes: A sites, B
on cost and land value directly, this classification focuses on the integrated effect of cost and
land value on the source of funding.
• A Sites - projects driven by private funding;
• B Sites - projects on the borderline of profitability and funded through public-private
co-operation or partnerships; and
• C Sites - projects funded by mainly public sector or municipality because of the lack
of profitability and low interest of any private organization to get involved
Figure 2-2: The Brownfield Redevelopment Types A-B-C Model (CABERNET, 2005)
The focus on partnership for funding makes this classification a useful tool for promoting
redevelopment at a general level, particularly if it is necessary to engage with multiple
stakeholders. However, the model lacks details about how to classify the existing sites,
especially those that may lie within the transition zones between the different classes.
Challenges of Applying Type 2 Classification Systems
Type 2 classification systems attempt to capture the financial issues influencing the
brownfield site. The underlying principles rely on comparing present value,
remediation/redevelopment cost, and the value of the site after revitalization. While
economics is a major driving force for redevelopment of any brownfield project, it is an
oversimplification to use only the remediation cost and the land value. None of the Type 2
classification system could attempt to capture the offsite economic benefits of the
redevelopment. For example, the economic benefit of rejuvenating a brownfield site may be
minimal but the increase in tax base in the surrounding areas because of its rejuvenation may
be quite significant. Furthermore, the Type 2 classification systems remain mostly qualitative
as opposed to being data driven and do not incorporate social issues such as stigma in the
post cleanup values of the land. This limits the scope for their extensive practical application.
Health is also outside the scope of these classifications. They mostly focus on the fiscal
component of all the incentives associated with the entire redevelopment process.
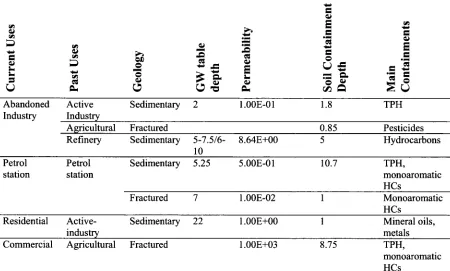
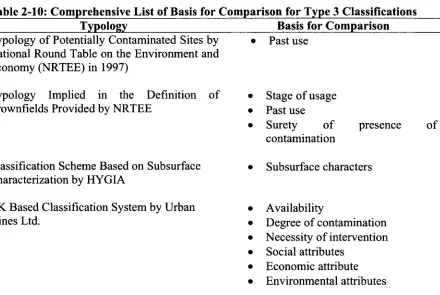
2.2.3 Type 3: Relevant and Critical Attribute Based Classification Systems
These are basically classification systems that do not fall under the Type 1 or 2 categories.
This third category of brownfield classification systems involve attributes which could
include but not limited to the effects of contaminants on human health and environment and
financial incentives. These systems cover a diverse range of site based attributes such as
geology, subsurface characterizations, and contextual attributes such as potential for
redevelopment, past use or state of present use. The classification schemes are primarily
established based on some critical attributes: the reoccurrence of these attributes results in
some common redevelopment patterns, financial gains, and risk reduction and liability
protection. However, in most of the cases the classifications are conceptual and qualitative
and are not supported by quantitative screening methodologies and rigorous data analysis.
Examples of Type 3 systems include:
• Classification scheme based on subsurface characterization by HYGIA- an European
R&D Project
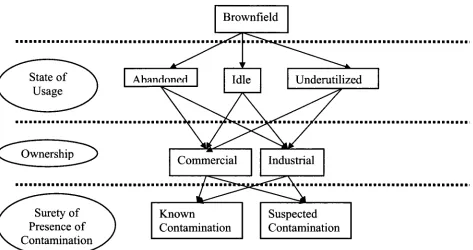
• Typology of potentially contaminated sites by NRTEE
• Typology implied in the definition of a brownfield provided by NRTEE in 2003

![Figure 3-1: Influence of Time Dimension on the Proposed Brownfield Classification 10. Increase in value due to redevelopment [Adapted from Mundy (2001)]](https://thumb-us.123doks.com/thumbv2/123dok_us/1466518.1179687/56.612.109.536.127.594/influence-dimension-proposed-brownfield-classification-increase-redevelopment-adapted.webp)