| INVESTIGATION
Statistical Methods for Identifying Sequence Motifs
Affecting Point Mutations
Yicheng Zhu,*,1Teresa Neeman,†Von Bing Yap,‡and Gavin A. Huttley*,1
*Research School of Biology and†Statistical Consulting Unit, The Australian National University, Canberra, Australian Capital Territory 2601, Australia, and‡Department of Statistics and Applied Probability, National University of Singapore, Singapore 117546, Singapore ORCID IDs: 0000-0002-5272-5543 (V.B.Y.); 0000-0001-7224-2074 (G.A.H.)
ABSTRACTMutation processes differ between types of point mutation, genomic locations, cells, and biological species. For some point mutations, specific neighboring bases are known to be mechanistically influential. Beyond these cases, numerous questions remain unresolved, including: what are the sequence motifs that affect point mutations? How large are the motifs? Are they strand symmetric? And, do they vary between samples? We present new log-linear models that allow explicit examination of these questions, along with sequence logo style visualization to enable identifying specific motifs. We demonstrate the performance of these methods by analyzing mutation processes in human germline and malignant melanoma. We recapitulate the known CpG effect, and identify novel motifs, including a highly significant motif associated with A/G mutations. We show that major effects of neighbors on germline mutation lie within 62 of the mutating base. Models are also presented for contrasting the entire mutation spectra (the distribution of the different point mutations). We show the spectra vary significantly between autosomes and X-chromosome, with a difference in T/C transition dominating. Analyses of malignant melanoma confirmed reported characteristic features of this cancer, including statistically significant strand asymmetry, and markedly different neighboring influences. The methods we present are made freely available as a Python libraryhttps://bitbucket.org/pycogent3/mutationmotif.
KEYWORDS context dependent mutation; germline mutation; somatic mutation; sequence motif analysis; mutation spectrum; bioinformatics; 5-methyl-cytosine; log-linear model
U
nderstanding the contributions of mutation processes to genetic diversity has broad relevance to topics ranging from estimating genetic divergence (Huttley 2004; Schluter 2009; Harris 2015) to the etiology of disease (Peltomaki and Vasen 1997; Ying and Huttley 2011; Nik-Zainalet al.2012; Alexandrov et al.2013a). While mutations occur on many scales, from single nucleotide point mutations to substantial genomic rearrangements, we restrict our attention here to point mutation processes. A multitude of mechanisms have been characterized that cause DNA lesions (Cooke et al.2003; Helledayet al.2014). Similarly, an array of processes repairing DNA lesions have also been described (Helleday
et al. 2014). From examination of sequence composition alone, it is apparent that mechanisms of mutagenesis (lesion formation and subsequent failure of DNA repair) differ be-tween genomic locations (Francioliet al.2015), between cell types (Nishinoet al.1996), and between species (Karlinet al.
1998). In evaluating natural systems, where only the starting and ending sequence states may be known, establishing the mechanistic origins remains a challenge. In mammals, an in-formative exception is the case of C/T point mutations. In this instance, a 39 G strongly implies a mechanism of 5-methyl-cytosine (5mC) deamination. This is due to the binding affinity of DNA methylases for the CpG sequence motif (Vinson and Chatterjee 2012), and the greatly elevated mutation rate of 5mC (Coulondre et al.1978). As the CpG example illustrates, predicting the contribution of a specific mechanism requires knowledge of a characteristic mutation sequence signature. Motivated by this, we focus here on de-velopment of a statistical method, and associated visuali-zation approach, for revealing signature sequence motifs
Copyright © 2017 by the Genetics Society of America doi: 10.1534/genetics.116.195677
Manuscript received September 14, 2016; accepted for publication December 1, 2016; published Early Online December 12, 2016.
Supplemental material is available online atwww.genetics.org/lookup/suppl/doi:10. 1534/genetics.116.195677/-/DC1.
associated with point mutations. We refer to these as muta-tion motifs.
Considerable evidence indicates that the influence of neighboring bases on point mutations is a general phenom-enon. Early studies on inherited, and thus germline, mutations in humans supported the hypermutability of the CpG dinu-cleotide as the dominant origin of C/T mutations (Cooper 1995). Subsequent work further suggested that the remain-ing 11 point mutations are also affected by neighborremain-ing bases (Krawczaket al.1998). From analyses of mutations in human disease genes, Krawczaket al.(1998) inferred the influence of neighbors are confined to the positions immediatelyfl ank-ing the mutated location. The work on human polymor-phisms demonstrated these results applied more generally across the genome (Zhao and Boerwinkle 2002). Recently, using trinucleotides where the mutated base is central, dis-tinctive mutation signatures that discriminate human cancer types have been identified (Alexandrovet al.2013a). These results demonstrate that the influence of neighboring bases generalizes to somatic mutations. Early influential work on plant cpDNA completes the demonstration of the generality of neighboring influences across the tree-of-life (Mortonet al.
1997). While Krawczaket al.(1998) and Zhao and Boerwinkle (2002) identified the influence of neighbors is proportional to distance, the work of Alexandrovet al.(2013a) was focused on the immediateflanking bases.
The influence of neighboring bases on mutagenesis can have multiple causes. The chemical properties of DNA alone can confer a neighbor influence on mutation susceptibility. Adjacent pyrimidines are vulnerable to a dimerization in the presence of UV light (Brown 2002, p. 426), with TpT being most susceptible. As the influence of DNA methylase preference for CpG dinucleotides demonstrates, DNA binding properties of macromolecules are a further likely source of neighboring base influences. With numerous DNA–protein binding interactions central to DNA repair processes, any affinity to specific sequence motifs of these molecules may result in those motifs being under-represented in mutated sequences.
Analysis techniques for estimation of neighboring base influences on mutation draw on different approaches. Krawczak et al. (1998) quantified neighboring base infl u-ence by contrasting observed base frequencies against an equiprobable frequency distribution via a Euclidean dis-tance. Zhao and Boerwinkle (2002) used just the base frequencies per position except beyond 610 bp, where averages across position ranges were used. In both these approaches, the background sequence distribution is as-sumed to be random occurrence of bases. These approaches therefore potentially obscure the real signal by confounding it with the nonrandom occurrence of bases characteristic of DNA sequences.
The distinctive mutagenic biology of cancer has moti-vated development of methods to identify specific mutation signatures across all point mutations. The related methods of Alexandrov et al. (2013b) and Shiraishi et al. (2015) tackle the problem of resolving the signatures of different
mutational processes. As these signatures can contain in-stances of the different point mutation directions, they are a composite of distinct underlying mutational processes operating across multiple types of point mutations. The differ-ent mutation signatures may, therefore, contain compondiffer-ent(s) that are identical, and are not well suited to examining the influence of neighboring bases on single point mutation directions.
More recently, the influence of neighboring bases has been examined by using a probability of polymorphism that was conditioned on the sequence context (Aggarwala and Voight 2016). A 7-mer context was identified as account-ing for a median of 81% of the variability in the probability of polymorphism across point mutations. This result indi-cated inclusion of higher-order (three-way and greater) interactions accounted for as much as 50% of the model predictive power. However, k-mers exhibit a nonran-dom distribution within the human genome (Karlin 1998; Choret al. 2009). Moreover, variation in sequence compo-sition is correlated with variation in substitution rate (Hodgkinson and Eyre-Walker 2011). These suggest that by averaging across all occurrences of the sequence con-text, the results of Aggarwala and Voight (2016) could
re-flect the relationship between genomic location, and the probability of polymorphism rather than the mechanistic influence of neighbors on mutation.
Detection of functional sequence motifs is a related prob-lem to which information theoretic techniques have been extensively applied. Mutual information (MI) per position in a sequence alignment is computed by subtracting the position’s Shannon entropy from entropy of the uniform dis-tribution (Shannon 1948). Coupling of this metric with the sequence logo visualization approach has led to its widespread application for discovery of functional motifs (Schneider and Stephens 1990). The display used the MI statistic to define a stack of color-coded letters, representing the sequence states, with each letter’s height scaled proportional to its contribu-tion to the total MI (Schneider and Stephens 1990). For this application, it is conventional to assume an independent equifrequent reference distribution. As removing the con-straint of equal frequencies can lead to negative values of MI, which are not readily interpretable, MI is not appropriate for examination of most DNA sequences, as the equifrequent property typically does not hold.
confounding is accounted for. Most available methods also do not distinguish contributions from independent positions compared with joint contributions from multiple positions. For instance, are mutations affected by the sequence of bases present at two positions (Zhang and Mathews 1995)? Log-linear models allowflexible parameterisations for hierarchi-cal hypothesis testing of categorihierarchi-cal data, and have been previously applied to examination of neighboring influences (Huttleyet al.2000). Their generality allows for controlling of potential confounding differences, such as differences in sample size and nucleotide composition. The support for comparing hypotheses in a hierarchical manner enables ex-plicit examination of hypotheses such as strand symmetry and absence of higher-order effects, which have been as-sumed by some approaches (Aggarwala and Voight 2016). Thus, they provide an objective basis for identifying paramet-rically succinct models.
In this study, we develop log-linear approaches for exam-ination of mutation processes. Our work is distinguished from previous methods by conditioning on the mutation event, rather than the sequence context, and employs a control distribution that is matched for genomic location. We pre-sent hierarchical hypothesis tests for evaluating whether: (i) neighboring bases associate with mutation direction, (ii) neighboring base associations are equal between samples, and (iii) the spectrum of mutations (the relative abundance of the 12 point mutations) are equal between samples. A se-quence logo inspired visualization approach is also presented. We demonstrate application of the models by applying them to data previously reported to exhibit distinctive mutation processes, namely, germline mutations in different sequence classes (e.g., transcribed, untranscribed) and chromosome classes (e.g., autosome and sex-chromosome), and somatic mutations in cancer. Mutation events in both human germ-line and somatic tissues were inferred from single nucleotide genetic variants available in Ensembl. In addition to replicat-ing the well-known CpG effect, our results indicate that neighborhood size can be quite large, and, as we demonstrate for the A/G transition mutation, the influence of neighbors does not decay monotonically with distance. We further show that both independent and dependent position infl u-ences contribute to mutational process. Through formal testing of equivalence between samples, we demonstrate significant differences between sequence classes, chromo-some classes, and between melanoma and germline muta-tions. Software implementing all these methods, released under an open source license, is made available athttps:// bitbucket.org/pycogent3/mutationmotif.
Materials and Methods
Data sampling
We infer mutation events in humans from published genetic variant records. Germline mutations were inferred from single nucleotide polymorphic (SNP) sites. Somatic mutations
were inferred from genetic variants identified in cancers. In both cases, the mutation direction, location, and associated
flanking sequence were sampled from Ensembl (Fliceket al.
2013), release 79 using PyCogent’s Ensembl querying capabil-ities (Knightet al.2007). The Ensembl variation database re-cords whether a variant is classified as somatic. We sampled germline SNPs using thatflag, and required the Ensembl re-cord indicate the SNP was validated, had an inferred ancestral allele, and that itsflanking sequence matched the reference genome. For each suchfiltered SNP, we recorded the alleles, ancestral allele, strand, sequence class (exonic, intronic, or intergenic), genomic coordinates, and 300 bp of flanking sequence either side of the SNP location.
Sampling somatic genetic variants involved both the COSMIC (Forbeset al.2015) and Ensembl databases. Com-plete mutant export data were obtained from COSMIC, which included variant identifiers and the primary pathology from which a variant had been reported. Flanking sequence was derived by obtaining the Ensembl records for the variant identifiers, ensuring the record wasflagged as somatic, and then following the same procedure as for the germline vari-ants. We restricted our attention to variants identified from malignant melanoma.
Determining base counts
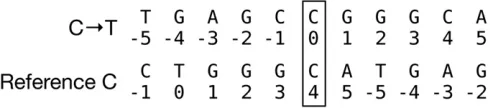
For each mutation direction (e.g., C/T) we obtained base counts from paired mutated and reference base locations. Neighbor positions were indexed relative to the position of the chosen location. For a mutated base, the chosen location was the annotated site of the variant (Figure 1). With knowl-edge of the mutation direction, a location with the same starting base as that affected by the mutation was randomly sampled within 300 bp of the annotated variant (e.g., a ran-dom choice of a position with a C in the case of a C/T mutation), but excluded the variant location. This is the paired reference base. In each case, a 5 bp long sequence centered on the chosen location was extracted, and the bases observed per relative position were recorded. We refer to these as neighborhoods. As the total number of possible neighborhoods was 256, a singlefile was written with counts for each of the possible neighborhoods for both the mutated and reference locations. This approach to identifying the ref-erence distribution also confers a substantial computational advantage, both in terms of memory required, and compute time.
Log-linear modeling of neighbor effects
For a single position, we evaluate whetherbaseand mu-tation status occur independently using a straightforward log-linear model. Under the most saturated log-linear model, the log of the expected frequencyfisforbase i, and mutation
status s, can be expressed as:
lnfis¼ lþlbasei þlstatuss þlbaseis :status (1)
wherelrepresents the intercept (i.e., common to all counts),
lbase
i ;the contribution to the frequency of beingbase i;l status s
the contribution to the frequency of being mutationstatus,s;
and the interaction between baseandstatuslbase:status
is :The
latter expresses the degree of nonindependence between
baseand mutationstatus. The number of levels for each factor are:base, four levels (A, C, G, and T), and mutationstatus, two levels (mutated, M, and reference, R). Because the total counts for M and R are identical by design,lstatus¼0 for alls:
Thefit of a log-linear model is measured as the deviance (D). We specify the null hypothesis that bases occur independent of mutation status, by setting lbase:status¼0 for alli,s. The alternate is the fully saturated model. The difference in D
between the null and alternate, nested models, is taken as
x2, with degrees of freedom equal to the difference in the
number of free parameters. In this instance, the degrees of freedom is 3.
When comparing groups,e.g., autosomevs.X-chromosome, we add another factor (lgroup) to the log-linear model (2).
The fully parameterised version of this log-linear model re-quires addition of three interaction parameters: two two-way interactions, and the three-two-way interaction parameter
lbase:status:group: This parameter represents the influence of
group on thebase: statusinteraction. We therefore evaluate the null hypothesis of no difference between samples by set-ting alllbase:status:group¼0 and compare this against the fully saturated model. If the group factor has only two levels, then the degrees of freedom for the resultingDis 3.
lnfisg¼lþlibaseþlstatuss þlgroupg
þlbase:status
is þl
base:group
ig þl
status:group sg
þlbase:status:group isg
(2)
We now extend this approach to consider the simultaneous influence on mutation status of bases at multiple positions. To illustrate, consider the two neighbors following the base C in Figure 1. There are 16 possible dinucleotides at the 1, 2 posi-tions. The goal of this model is to establish whether the dinu-cleotides at these two positions associate with mutation status of C, after taking account of the independent contributions of these positions. In order to achieve this, our two-position in-teraction model extends the independent contribution model (1), adding factors for the additional position, and then inter-action terms between the parameters. The fully saturated two-position interaction model is
lnfijs¼lþlbasei 1þl base2
j þlstatuss þl
base1:status
is
þlbase2:status
js þl
base1:base2
ij þl
base1:base2:status
ijs
(3)
where lbase1 andlbase2 represent the base contributions at
positions one and two, respectively. In addition to including factors for the independent contributions of the two positions on mutation status, thelbase1:base2 accounts for nonindependent
occurrence of bases at the positions—a key property of DNA sequences. The null hypothesis of no interaction between dinucleotides and mutation status is specified by setting all
lbase1:base2:status¼0, and comparing this against the fully
sat-urated model. The resultingDhas nine degrees of freedom. For a given mutation direction, we perform this analysis for all possible combinations of pairs of sites.
These approaches are further extended to consider inter-actions among three positions, among four positions, and, for comparison of these effects among groups.
Log-linear model of mutation spectra
For analysis of mutation spectra, we evaluate the null hypoth-esis that the distribution of mutations is the same between groups. The opportunity for a specific mutation direction is affected by the total occurrence of the starting base. This quantity can be difficult to ascertain, such as in cancers where there may be major genomic rearrangements (e.g., deletions) relative to a reference group. To avoid this uncertainty, we restrict the analysis to point mutations from a specific base, comparing the relative counts of each of the three possible mutations between groups. This is a test of independence between ending base and group.
For a specific base, the log of the expected frequency is defined as
lnfdg¼lþldirectiond þlgroupg þl
direction:group
dg (4)
where the factorldirection represents the counts of the three different point mutation directions,lgroup the counts in the different groups, and ldirection:group the interaction between
these factors. We specify the null hypothesis of equivalent proportions between the groups by settingldirection:group¼0:
For two groups, comparing against the fully saturated model, theDhas two degrees of freedom.
Visualization
Sequence logos display motifs using the mutual information as the letter stack height, and the fraction contributed to the MI by individual bases is derived from their individual terms in the MI calculation. We adopt a similar approach here. Instead of using MI, we use relative entropy (RE). The log likelihood ratio,D, is converted to RE by dividing by twice the sample size. RE from a log-linear analysis specifies the letter stack height. We use the terms in the RE equation to determine the proportion of the stack height attributable to a specific base. We differ from the conventional sequence logo approach by distinguishing between bases that are under- or over-represented in the mutated class, relative to the unmutated class. Under-represented bases are indicated by a 180°rotation.
Interpretation of the logo is straightforward. A higher RE value indicates that a position(s) has a greater influence on mutation. Support for concluding a stack height reflects a meaningful influence on mutation derives from theP-value, from the log-linear model, that the data arose under the null hypothesis. The magnitudes and orientations of letters further conveys meaning in that ordinary letter orientation is indicative of over-representation in the mutated group, while inverted orientation indicates under-representation. We note here that we make a choice to use residuals from the mutated class for display. Using residuals from the unmutated class would gener-ate an image with the opposite letter orientations.
For multi-position models (e.g., Equation 3), the stack height is equal between the indicated positions. For the two-position model, the characters for the nucleotide pair at the two positions share the same proportion and orienta-tion. For the more complicated analyses involving contrast-ing neighbor effects between groups, the reference category is the one providedfirst to the software.
Differences in mutation spectra are visualized using a grid with rows corresponding to the starting base, and columns to the base resulting from the mutation. Each row corresponds to a single log-linear test for equivalent distribution of the possible point mutations from the base indicated by the row label (seeLog-linear model of mutation spectra). The RE for each row is computed from the deviance of the corresponding spectra test. Letter heights for each base are scaled propor-tional to the corresponding term in the RE equation. The sum of letter heights in a row is the total RE for that test. Bases over-represented in the reference group are oriented in the conventional manner, while under-represented bases are rotated 180°. In the spectral analysis, the largest base in the grid is the dominant mutation product difference between the groups.
Data availability
MutationMotif is a Python 3.5 compatible library for perform-ing the statistical analyses outlined in this work that is freely available under an open source license. The project homepage is at https://bitbucket.org/pycogent3/mutationmotif, and the version employed for the reported work is available in Zenodo (https://zenodo.org/record/166388). It draws on R
(Ihaka and Gentleman 1996) for log-linear modeling, via the glm function, using the rpy2 Python binding to R. Sequence logos are drawn using custom Python code included in Muta-tionMotif. Other dependencies include PyCogent (Knight
et al.2007), pandas, numpy, matplotlib, and scitrack. The scripts performing the data sampling and applying the analyses reported in this work are freely available under the GPL at https://bitbucket.org/gavin.huttley/ analysemutations, and the version employed for the reported work is available in Zenodo (https://zenodo.org/record/ 166387). AnalyseMutations includes the counts data re-quired by MutationMotif, and the complete set of results con-tained in this work. These counts data were produced from data sampled from the Ensembl and COSMIC databases, as described inData sampling. Because the datafiles from which the countsfiles were produced are so large, they are avail-able separately in Zenodo (https://zenodo.org/record/53158
and https://zenodo.org/record/53164) under the Creative Commons Attribution-Share Alike license. Datafiles are typ-ically gzip compressed standard formats; tab delimited text
files, fasta formatted sequencefiles, and serialized data are stored as json or pickle (Python’s native serialized format). Supplemental Material, File S1 contains tables and figures from additional analyses.
Results
Overview of notation and neighbor effect log-linear models
The notation X/Y refers to a point mutation from starting base X to ending base Y, X/Y* refers to a point mutation and its strand symmetric counterpart, e.g., C/T* is C/T or G/A. The sampled region around a mutated base is called a neighborhood, with neighbors being the individual posi-tions within the neighborhood. A mutation motif is a specific neighborhood that is enriched in mutated sequences com-pared to the reference distribution.
The log-linear model of neighbor influence evaluates the null hypothesis that a neighboring base(s)flanking a specific point mutation is the same as thatflanking a random occur-rence of the starting base. For instance, does the distribution of bases at sitesflanking C/T mutations differ from thatfl ank-ing all Cs? As the frequency of bases varies between genomic locations (Karlin 1998; Bernardi 2000; Chor et al. 2009), matching of the mutated and reference locations reduces possible confounding. We achieve this matching by deriving a reference location proximal to each mutated location. The sampling process is shown in Figure 1. We sampled 300 bp of
centered on a random occurrence of the starting base. These counts are used to construct the contingency tables for the log-linear analysis. This approach achieves the objectives of con-trolling for compositional variation across the genome, and controlling for the nonrandom occurrence of bases. See
Determining base countsfor more detail on this procedure. The log-linear models used to examine the effect of neigh-bors on point mutation include parameters that represent an interaction between neighboring base(s) and mutation status (seeLog-linear modeling of neighbor effects). The contribution of this parameter to model fit is measured as a Deviance, which, along with the residual degrees-of-freedom, is used to calculate the correspondingP-value for the null hypothesis. We convert the Deviance to RE, as this measures the informa-tion content of the data under the model in a manner that is robust to sample size, allowing comparisons among analyses. As we are concerned with whetherflanking positions in-dividually or jointly affect mutation process, we describe the influence of neighboring bases as independent or dependent/ joint effects, respectively. The influence of a base at a single neighboring position on a point mutation will be referred to as an“independent”effect. The case when bases at two or more neighboring positions influence a point mutation will be re-ferred to as a“dependent”interactive effect, or the joint
in-fluence of multiple bases. The number of positions involved in a dependent effect is referenced as the“order”of the in-teraction. An independent effect, the influence of a single position on mutation, is a first-order effect, while the joint influence of two positions on mutation is a second-order effect. Flanking locations are indexed relative to the mutated posi-tion. The immediateflanking 59base is at position21 while the immediateflanking 39base is at positionþ1 (see Figure 1). A series of positions are indicated by the relative indices in parenthesese.g.,ð22;21Þ are two positions 59to the mu-tated base. We note here that, in the case of a dependent effect, the actual positions are not necessarily physically adja-cent,e.g.,ð22;2Þ:
Log-linear models recapitulate the CpG effect and reveal higher-order effects
In the analyses reported below, we focus principally on anal-yses of intergenic autosomal data. We also sampled variants from introns and exons. We relegate all results from analysis of other genomic regions toFile S1, as the results are substan-tively the same as those from the intergenic sequence class.
We benchmarked our method by examining the influence of neighboring bases on C/T point mutations in the autoso-mal intergenic sample. (As none of the strand symmetry tests were significant for the intergenic autosomal mutations, we limit our discussion to the“plus”strand directions only.) We expected the influence of methylation-induced deamination at CpG to reveal a strong G effect at the +1 position (Cooper and Youssoufian 1988). This prediction was confirmed in the results of the hypothesis test (Table S1 inFile S1), and visu-ally in the mutation motif logo (Figure 2B). The analysis established that, while all positions made highly significant
independent contributions to mutation (all P-values were estimated as0;Table S1 inFile S1), the magnitude of their influence was small compared to that at the +1 position, and only one of these was evident in the mutation logo, that of A at the21 position (Figure 2B). (Results from the equivalent anal-ysis of autosomal exon data are shown in Figure S1 inFile S1.) Specific combinations of bases at multiple positions also significantly affected C/T mutations. All higher-order inter-actions were statistically significant (allP-values ,10222;
Table S1 inFile S1). A feature of the second- and third-order joint effects was that bases physically adjacent to each other, or to the mutated position, had the strongest association:
ð22;21Þ; ð21;þ1Þ; ðþ1;þ2Þ second-order interactions (Figure 2C and Table S1 inFile S1), and theð22;21;þ1Þ third-order interaction (Figure 2D).
Despite the highly significant associations between com-binations of positions and interactions, the independent position contributions dominated. All effect orders were sig-nificantly associated with mutation status, even when using the sequential Holm-ˇSidák correction for 15 tests (Holm 1979). These results reflect the enormous statistical power resulting from the large sample sizes, e.g., over 1 million C/T intergenic variants. Contrasting the magnitudes of these different effects by displaying the maximum RE value from each effect order (REmax, Figure 2A) provide a useful
indicator of their relative influence; REmaxð1Þ is the
maxi-mum RE score for first position effects across all positions (e.g., +1 in this case), REmaxð2Þthe maximum RE score from
combinations of two positions, and so on for the higher orders. This display established that the 39-G influence dom-inates all other neighboring base effects on C/T mutation. Furthermore, contrasting these values between the point mutations (Table 1) affirms that neighbors have the strongest effect on C/T mutations (Figure S2 inFile S1).
A/G mutations are also strongly affected by neighbors
The A/G transition mutation exhibited the next strongest influence of neighboring bases (Table 1). As for C/T, all effect orders were highly significant after correcting for 15 tests (allP-values ,10247;Table S2 inFile S1). All
posi-tions showed significant first-order influences, but the
22;21;þ1 positions were particularly strong (Figure 3B). Two of these,ð22;21Þ;also exhibited a prominent second-order interaction (Figure 3C), while all three contributed the strongest third-order interaction (Figure 3D). For A/G mu-tations, our analysis indicated that, while first-order effects dominated, higher-order effects were important factors af-fecting this mutation direction (Figure 3A). Again, combina-tions of bases that were physically adjacent were most influential. (Results from the equivalent analysis of auto-somal exon data are shown in Figure S3 inFile S1.)
Transversion mutations are affected by neighbors
transversion mutations showed REmaxð1Þthat were 20-fold
less than for the C/T mutations. However, higher-order ef-fects were typically more pronounced for transversions than transitions. The A/T and C/A transversion mutations showed the greatest influence of neighbors at all levels. The dominant influences were immediately adjacent to the mutating base, except for C/G, where position22 had the strongest effect.
The size of the neighborhood
Our analyses above indicated thatfirst-order effects exerted the strongest influence on mutations. Accordingly, we limited our examination of neighborhood size tofirst-order effects, and sampled intergenic autosomal variants with aflank size of
610 bp for an analysis. After correcting for multiple tests, all 20flanking positions were significant for all point mutations (Table S3 in File S1). This suggests a neighborhood size
$10: The tendency for even very distant positions to be highly significant in this analysis likely reflects the enormous sample sizes employed for this analysis, and does not neces-sarily reflect the magnitude of a positions influence. There-fore, for each mutation, we estimated the most distant position with a RE that was $10% of REmaxð1Þ: For the
transition mutations, the neighborhood size was restricted
to positions within 62 bp (Figure S4 in File S1), while, for transversion mutations, the neighborhood size was within64 bp (Table S3 inFile S1).
Some germline point mutations exhibited different neighboring effects between sequence classes
The operation of transcription-coupled DNA repair processes suggested a possible difference in neighbor effect may exist between transcribed and untranscribed sequences. This pre-dicts a difference in mutation profile between intergenic and intronic sequences. Our analysis of neighbor contributions to mutation established that, forfirst-order effects, every point
Table 1 Summary of neighbor associations with plus strand mutations with an autosomal intergenic location
Direction REmaxð1ÞPos:ð1ÞREmaxð2Þ Pos:ð2Þ REmaxð3Þ Pos:ð3Þ
A/C 0.0039 21 0.0016 (+1, +2) 0.0012 (22,21, +1) A/G 0.0188 +1 0.0030 (22,21) 0.0007 (22,21, +1) A/T 0.0095 +1 0.0051 (21, +1) 0.0023 (21, +1, +2) C/A 0.0091 +1 0.0044 (21, +1) 0.0015 (21, +1, +2) C/G 0.0054 22 0.0025 (+1, +2) 0.0010 (21, +1, +2) C/T 0.0860 +1 0.0006 (21, +1) 0.0002 (22,21, +1)
REmaxð#Þis the maximum RE for order # and Pos:ð#Þthe corresponding position(s). All point mutations had at least one significant test after correcting for 15 tests (see Table S1 inFile S1) using the Holm-ˇSidäk procedure.
Figure 2 Neighbors influence C/T mutations. (A) First order effects are the dominant neighbor influence, REmax
mutation was significantly different between the sequence classes (Table S4 inFile S1). For second-order effects, only the transition mutations showed significant differences. The biggest difference between the regions was for A/T*. While these effects were highly significant, their REmaxð1Þ were
100-fold lower than the overall influence of neighbors on intergenic A/T.
Neighboring effects differ between chromosome classes
Differences in germline biology between males and females predict distinct mutation profiles between sequences located on the autosomes and X-chromosome (Huttleyet al.2000). Our test of the hypothesis of no difference inflanking base effect between autosome and X-chromosome mutations in intergenic sequences was rejected for first-order influences on several of the point mutations, after correcting for 15 tests using the Holm-Sidák procedure (Holm 1979) (Table S5 inˇ
File S1). Interestingly, A/G* and C/T* showed compara-ble differences inflanking base effect between the chromo-some classes (Deviances26:0 and25:4, respectively). In all cases, the effect exists at the same position as that
identi-fied as REmaxð1Þin the intergenic analysis (Table 1). While
the transition mutations were the most statistically significant, their RE lay within the range of the other point mutations
(Table S5 in File S1), indicating their significance reflects greater abundance and thus a greater rate.
Analysis of germline mutation spectra
Our log-linear model for analysis of mutation spectra com-pares counts of point mutations from the same starting base between groups. By considering only mutations from a single base between different locations, differences in the abun-dance of the starting base between groups are controlled for. This approach can be applied to groups representing different strands, different genomic regions, or different bi-ological materials (e.g., germline and somatic).
Our analysis of germline mutation spectra indicated point mutations were uniformly strand symmetric but different between sequence categories. No sequence category exhibited strand asymmetry in mutation spectra for autosomal data. Significant differences in autosomal mutation spectra were evident between intergenic and intronic regions. The major differences were for transversion mutations, specifically C/A and its strand complement (Table S6 inFile S1).
Significant differences between chromosome classes were evident (Figure 4 and Table S7 inFile S1). For the intergenic sequence class, A/G* transition mutations were in strong excess on autosomes compared with X-chromosome (Figure
4). Comparable results were evident for intronic sequences (Table S8 inFile S1).
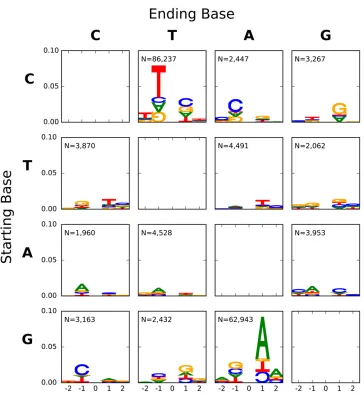
Melanoma mutations exhibit strikingly different neighbor effects and spectra
Mutation processes in malignant melanoma are known to be distinctive, and to include strand asymmetric mutation processes within genes (Pleasanceet al.2010). Our analyses confirm that the profile of point mutations in the malignant melanoma sample was strikingly different to that of germline mutations (Table S12 and Table S13 inFile S1). The grid of all point mutations (Figure 5) demonstrates that neighboring influences were most pronounced for C/T point mutations, and a much stronger influence of neighboring bases on trans-version mutations. The neighbor effects were also signifi -cantly strand asymmetric (Table S9 inFile S1), a distinctive characteristic for melanoma. Only substitutions affecting C were significantly different in spectra between strands, with the C/T direction being over abundant on the plus strand (Figure 6 and Table S10 inFile S1).
Discussion
While it has long been appreciated that sequence neighbor-hoods affect point mutations, statistical methods for disen-tangling how neighbors contribute have been limited. Here, we addressed this using a novel determination of the reference distribution and log-linear models. This methodological
com-bination is robust to complexity in the genomic background of nucleotide composition. It further enables hierarchical hy-pothesis testing for establishing the significance and relative importance of neighbor effects. We illustrated utility of the models by applying them to analyses of mutations from samples reported to exhibit distinctive properties. Our anal-yses recapitulated well-known effects, in terms of neighbor dependence, and in terms of differences between genomic regions and somatic and germline, supporting the accuracy of the methods. The results revealed previously unreported neighbor effects that extends beyond immediate flanking positions. Analyses of mutation spectra complemented the neighbor analyses, confirming known features of point mutations in malignant melanoma, and identifying novel differences in germline point mutation abundance between sex-chromosomes and autosomes.
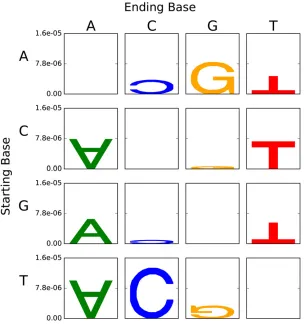
The hypermutability of C/T in CpG dinucleotides is the exemplar of context dependent mutation, and a gold stan-dard that a method of analysis should correctly recover. We established that the conventional sequence logo analysis ap-proach did not recapitulate the dominant influence of a 39-G (Figure 7). As this method shares the assumption of equifre-quent bases with that of Krawczaket al.(1998), the failure suggests that the Euclidean distance approach will also be
flawed. In contrast, as shown in Figure 2 and Table S1 inFile S1, our analysis successfully recapitulated this known effect. The REmax values (Figure 2B) further affirm C/T as most
strongly affected by neighboring bases.
In order to sensibly interpret the results of our analyses, we de-emphasize the importance of statistical significance, and focus instead on effect magnitude. Due to the very large number of inferred mutations, our analyses possess very high power to detect small effects. This is illustrated by the very smallP-values associated with, for example, third-order ef-fects for the C/T mutation (Table S1 inFile S1). Yet, the magnitude of these effects is relatively small in comparison with thefirst-order effects (Figure 2A). Consequently, and, in addition to considering whether effects are statistically sig-nificant according to standard criteria, we contrast RE statis-tics to establish relative importance.
Our analysis identified numerous novel properties of neighboring sequence influence on point mutation in the germline. First, all mutations were significantly affected by neighboring bases, with transition mutations showing a larger influence of neighbors than transversions. Interestingly, as illustrated by the A/G* mutations, these influences did not decay monotonically with distance from the mutation (Figure 3B). This point mutation further illustrated that multiple neigh-boring positions can influence mutation outcome. Comparing
RE values to that for C/T indicates that thefirst-order neigh-bor effects of other point mutations were5- to 20-fold less, with those values corresponding to A/G and A/C mutations, respectively (Table 1). Second, all mutations were significantly affected by higher-order effects (interactions between adjacent bases). These were evident in a manner such that bases contig-uous with each other and the mutated location showed the largest RE. This may reflect the importance of interactions among adjacent bases (base-stacking) in affecting DNA stability (Karlin and Burge 1995; Yakovchuket al.2006). For all point mutations, the RE terms fromfirst-order effects were markedly stronger than those for higher-order effects. These results were replicated in our analysis of intronic variants (Table S11 in
File S1).
The evidence for neighboring influence on mutation raised the important question of how far these effects offlanking sequence extend? While there was strong statistical signifi -cance of positions as far as 10 bp from the mutating base (Table S3 inFile S1), considering the relative magnitude of RE values indicated a very rapid decay away from the mu-tated position. In particular, that the magnitude of the effect
decayed below an order of magnitude within two bases for transition mutations. This trend is illustrated by the mutation motif logo displays (Figure S4 inFile S1). While transversion mutations exhibited a slower decay in effect magnitude, and hence a larger neighborhood, these reflect the smaller REmaxð1Þ of transversions that constitute a less stringent
cut-off.
Our results regarding the importance of higher-order in-teractions indicate that considering 5-mers accounts for the majority of modelfit. The deviances from thefirst-order effects of A/G* and C/T* transition mutations accounted for 81 and 98% of the total deviance, respectively, in the auto-somal intergenic sample. Inclusion of second-order effects increased both these to . 96% (Table S1 and Table S2 in
File S1). Across all point mutations in the autosomal inter-genic sample, combining first- and second-order effects accounted for a median 91% of the total deviance of the 5-mer model. These differences are further illustrated by the motif [C/T]CAAT[C/G/T]N, reported as exhibiting an odds ratio of6000 for enrichment in mutated sequences (Aggarwala and Voight 2016). Our results (Figure 3D and Table S2 inFile S1) identified the CAAT core of this motif as highly significant. However, this is a third-order interaction, and the RE for this specific combination of sites is 28-fold less than the strongest first-order effect, and accounts for only 1.5% the total deviance. We estimated odds ratio for the CAAT mutation motif as4:0, which is less than the5:7 odds ratio we estimated for the 7-mer of Aggarwala and Voight (2016). [We note here that our odds ratios are closer to what Aggarwala and Voight (2016) term“fold change.”]
The profile of somatic mutations is expected to exhibit differences to germline mutations due to requisite defects in DNA repair systems. As reported (Nik-Zainalet al.2012), such defects are characteristic of cancers. Of the characterized cancers, malignant melanoma exhibit the most distinctive mutation signatures. Included in the distinctiveness of malig-nant melanoma is a striking strand asymmetry (Pleasance
et al.2010). This putatively derives from UV light-induced formation of pyrimidine dimers. In transcribed regions, nucleotide excision repair processes, coupled to transcrip-tion-coupled repair mechanism, results in efficient repair of
transcribed strand lesions. As a consequence, mutations are expected to accumulate on the nontranscribed strand. Evi-dence supporting this, with more C/T mutations on non-transcribed strand than on the non-transcribed strand, has been reported (Pleasanceet al.2010).
Our analysis demonstrated that point mutations in mela-noma were dependent on neighbors in a manner strikingly different from that of germline processes discussed thus far (Figure 5 and Table 2). While C/T mutations were again the point mutation most affected by neighboring bases, the motif was markedly different to that from the germline pro-cess with a 59-T showing the greatest influence. This differ-ence indicates that 5mC deamination plays a less prominent role in C/T. Since melanoma arises in part due to defect(s) in DNA repair, the distinctive mutation motifs in melanoma indicate either a very effective masking of neighbor effects on lesion formation, or that the DNA repair mechanisms inacti-vated in melanoma are strongly affected by neighbors. Our melanoma analysis also strongly supported strand asymme-try of mutations, with the effect most pronounced for C/T. A major asset to the log-linear modeling framework is the ease of extension to enable comparisons between samples. The utility of this is illustrated above in comparing somatic to germline processes. The appeal of this capability, however, is much broader, as it further allows evaluation of the processes that contribute to within genome heterogeneity in sequence composition. We have illustrated this application here by considering genomic regions for which the incidence of mu-tation processes are known to differ (X-chromosomevs. au-tosomes) or where DNA repair processes are known to differ (transcribedvs.untranscribed regions).
The notion that there is a systematic tendency for muta-tions to originate in males has been known since Haldane (Haldane 1935, 1946, 1948). The most popular hypothesis to account for male-biased evolution is the mutation-through-DNA-replication hypothesis (Li et al. 2002; Webster et al.
2005). Other, nonreplication-based, differences in mutation between the sexes have also been proposed (Huttley et al.
2000). Included in these is evidence for elevated methylation of DNA in the male germline. This suggests the relative con-tribution of 5mC derived lesions will be greater on the
autosomes compared to the X-chromosome, as the latter spends less time (on average) in males. Our analyses for dif-ferences in neighbor influences did lend support to existence of distinct 5mC affecting mutation processes operating be-tween the X-chromosome and autosomes (Table S5 in File S1), including a reduced magnitude of the +1 influence on the X-chromosome. However, this was not the strongest dif-ference in neighbor effect between the chromosomal classes; A/G showed the strongest statistical significance, while C/G showed the greatest RE. The spectra analyses further emphasized the importance of differences in A/G* point mutations (Figure 4). These results therefore indicate more extensive point mutation differences between these chromo-some classes than previously appreciated, and suggest a cor-responding diversity in mutational processes between male and female germlines.
That differences in operation of DNA repair processes may affect mutation is predicted by the localized influence of transcription coupled DNA repair. This process is known to operate in a manner that is strand asymmetric. Differences in base parity—the frequency of A should equal that of T, G should equal C—support an effect of transcription on point mutation (Touchon et al.2003). Significant differences in neighbor effects for all point mutations were evident between intergenic and intron regions. However, our analysis of strand symmetry for neighbor effects was not significant for intron sequences for any point mutation. This suggests a dis-tinctive mutation profile arising from transcription, rather than the influence of transcription-coupled DNA repair.
We have argued that the matched sampling of the reference distribution in our neighbor analysis is important. Briefly recapitulating that approach, the reference distribution is obtained by randomly selecting a paired reference base within
6300 bp of each observed mutation (Figure 1). An alternate to this strategy is to obtain the reference base by randomly selecting from the full genome sequence. For a given point
mutation direction, only the reference counts can differ be-tween the6300 bp and genome reference approaches,i.e., the observed counts are identical. Consequently, the statisti-cal inferences will likely differ when thek-mer distribution for a sequence class differs from that of the entire genome. An obvious case where this condition arises are protein coding exons. A neighbor analysis of exon sequences where the ref-erence distribution was obtained from the full genome se-quence showed significant differences to the6300 bp one. The relative importance of eachflanking position and/or the identity of bases at those positions differed for all of the point mutation directions (for a subset see Figure S5 inFile S1). These results, and its considerable computational advan-tages, support using the6300 bp reference distribution.
As formulated, the neighbor analysis do not evaluate the relative abundance of mutations between samples. For this purpose, we introduce what we termed the mutation spec-trum analysis. As the opportunity for mutation is affected by the frequency of the starting base, and base frequency differs between genomic locations, we perform spectrum analysis for each nucleotide separately. The null hypothesis is a very simple one,i.e., that the three possible point mutations from a starting base occur in equal frequency between samples. As such, this spectrum approach does not consider neighboring base contributions at all, and is therefore complementary to it. For each of the above analyses comparing groups, we also undertook mutation spectrum analyses. There were no sig-nificant strand differences for autosomal data. Comparisons between the X-chromosome and autosomes revealed highly significant differences in composition for all bases (Figure 4). The most pronounced difference was an excess of A/G* transition mutations on autosomes. Similarly, all point muta-tions showed significantly different mutation spectra be-tween intergenic and intronic regions (Table S6 inFile S1). In this case, however, the dominant differences were an ex-cess of transversions creating A/T base pairs in intergenic regions, while introns were characterized by an excess of C/G base pair creating mutations.
Table 2 Summary of neighbor associations with mutations in malignant melanoma
Direction REmaxð1ÞPos:ð1ÞREmaxð2Þ Pos:ð2Þ REmaxð3Þ Pos:ð3Þ
A/C 0.0167 21 0.0101 (21, +1) 0.0078 (22, +1, +2) A/G 0.0135 21 0.0118 (21, +1) 0.0051 (21, +1, +2) A/T 0.0110 21 0.0039 (22, +1) 0.0033 (22,21, +1)
C/A 0.0319 21 0.0102 (21, +1) — —
C/G 0.0264 +1 0.0035 (21, +1) 0.0041 (22,21, +1) C/T 0.0788 21 0.0130 (21, +1) 0.0006 (22,21, +1) G/A 0.0918 +1 0.0090 (21, +1) 0.0009 (21, +1, +2) G/C 0.0254 21 0.0028 (22, +1) 0.0043 (21, +1, +2) G/T 0.0242 +1 0.0078 (+1, +2) 0.0052 (21, +1, +2) T/A 0.0123 +1 0.0042 (+1, +2) 0.0044 (21, +1, +2) T/C 0.0135 +1 0.0244 (21, +1) 0.0057 (21, +1, +2) T/G 0.0137 +1 0.0118 (21, +1) 0.0074 (22, +1, +2)
REmaxð#Þis the maximum RE for order # and Pos:ð#Þthe corresponding position(s). All point mutations had at least one significant test after correcting for 15 tests (see Table S1 inFile S1) using the Holm-Sidäk procedure. Nonsigniˇ ficant results are indicated by“—.”
The methods we present enable characterization of muta-tional processes affecting samples. For the neighbor analyses, the critical properties of the methods we present derive from the specification of the reference distribution, and utilization of the well established log-linear modeling framework. This combination has considerable potential for detailed interro-gations of mutation properties, and should improve our un-derstanding the mechanism of mutations, both germline and somatic. Our application of the method generated mutation motifs consistent with well known effects. We further revealed a pronounced influence offlanking bases on all point mutation processes. From germline mutations, we have identified a striking dependence of the A/G transition on multiple posi-tions. The mechanistic basis of this mutation motif is unknown. The neighbor and spectral analyses examine complemen-tary aspects of mutational process. The former examines the contribution of neighboring bases to the mutation outcome from a starting base, and the latter considers the breakdown of mutations from a single base. While the P-values from the hypothesis tests are sensitive to sample size, a property that may be proportional to mutation rate, neither approach ex-plicitly considers the rate of mutation.
As with all methods that seek to characterize data arising from unobserved processes, there are challenges of interpre-tation. In both the neighbor and spectral analysis approaches, the data are a composite of mutation events with potentially diverse etiological histories. As a consequence, differences between samples will potentially reflect multiple mechanistic differences. Regardless of these issues, analyses that use measures of genetic distance, such as phylogenetics, cannot rationally rely on models of sequence divergence that assume mutations affect nucleotides independent of their neighbors. Instead, models that accommodate neighbor effects (e.g., Hwang and Green 2004) to at least62 positions will need to be developed in order to reasonably capture the neighbor influences described here.
Acknowledgments
We thank Jeremy Widman for allowing us to use his Python implementation of logo drawing code for visualisation. We thank Ben Kaehler and Stephen Haslett for their comments on versions of this work.
Literature Cited
Aggarwala, V., and B. F. Voight, 2016 An expanded sequence
context model broadly explains variability in polymorphism lev-els across the human genome. Nat. Genet. 48: 349–355. Alexandrov, L. B., S. Nik-Zainal, D. C. Wedge, S. A. Aparicio, S.
Behjatiet al., 2013a Signatures of mutational processes in hu-man cancer. Nature 500: 415–421.
Alexandrov, L. B., S. Nik-Zainal, D. C. Wedge, P. J. Campbell, and M. R. Stratton, 2013b Deciphering signatures of mutational processes operative in human cancer. Cell Rep. 3: 246–259. Bernardi, G., 2000 Isochores and the evolutionary genomics of
vertebrates. Gene 241: 3–17.
Brown, T., 2002 Genomes. Wiley-Liss, New York, NY.
Chor, B., D. Horn, N. Goldman, Y. Levy, and T. Massingham,
2009 Genomic DNA k-mer spectra: models and modalities.
Genome Biol. 10: R108.
Cooke, M. S., M. D. Evans, M. Dizdaroglu, and J. Lunec, 2003 Oxidative DNA damage: mechanisms, mutation, and dis-ease. FASEB J. 17: 1195–1214.
Cooper, D. N., 1995 The nature and mechanisms of human gene
mutation, pp. 259–291 inThe Metabolic and Molecular Bases of Inherited Disease. McGraw-Hill, New York
Cooper, D. N., and H. Youssoufian, 1988 The CpG dinucleotide and human genetic disease. Hum. Genet. 78: 151–155. Coulondre, C., J. H. Miller, P. J. Farabaugh, and W. Gilbert,
1978 Molecular basis of base substitution hotspots inEscherichia coli. Nature 274: 775–780.
Flicek, P., M. R. Amode, D. Barrell, K. Beal, K. Billis et al., 2013 Ensembl 2014. Nucleic Acids Res. 43: D662–D669. Forbes, S. A., D. Beare, P. Gunasekaran, K. Leung, N. Bindalet al.,
2015 Cosmic: exploring the world’s knowledge of somatic mu-tations in human cancer. Nucleic Acids Res. 43: D805–D811. Francioli, L. C., P. P. Polak, A. Koren, A. Menelaou, S. Chunet al.,
2015 Genome-wide patterns and properties of de novo muta-tions in humans. Nat. Genet. 47: 822–826.
Haldane, J. B., 1935 The rate of spontaneous mutation of a hu-man gene. J. Genet. 31: 317–326.
Haldane, J., 1946 The mutation rate of the gene for haemophilia, and its segregation ratios in males and females. Ann. Eugen. 13: 262–271.
Haldane, J., 1948 Croonian lecture: the formal genetics of man. Proc. R. Soc. Lond. B. Biol. Sci. 135: 147–170.
Harris, K., 2015 Evidence for recent, population-specific evolution of the human mutation rate. Proc. Natl. Acad. Sci. USA 112: 3439–3444.
Helleday, T., S. Eshtad, and S. Nik-Zainal, 2014 Mechanisms un-derlying mutational signatures in human cancers. Nat. Rev. Genet. 15: 585–598.
Hodgkinson, A., and A. Eyre-Walker, 2011 Variation in the muta-tion rate across mammalian genomes. Nat. Rev. Genet. 12: 756– 766.
Holm, S., 1979 A simple sequentially rejective multiple test pro-cedure. Scand. J. Stat. 6: 65–70.
Huttley, G. A., 2004 Modeling the impact of DNA methylation on the evolution of BRCA1 in mammals. Mol. Biol. Evol. 21: 1760– 1768.
Huttley, G. A., I. B. Jakobsen, S. R. Wilson, and S. Easteal,
2000 How important is DNA replication for mutagenesis?
Mol. Biol. Evol. 17: 929–937.
Hwang, D. G., and P. Green, 2004 Bayesian Markov chain Monte Carlo sequence analysis reveals varying neutral substitution pat-terns in mammalian evolution. Proc. Natl. Acad. Sci. USA 101: 13994–14001.
Ihaka, R., and R. Gentleman, 1996 R: a language for data analysis and graphics. J. Comput. Graph. Stat. 5: 299–314.
Karlin, S., 1998 Global dinucleotide signatures and analysis of genomic heterogeneity. Curr. Opin. Microbiol. 1: 598–610. Karlin, S., and C. Burge, 1995 Dinucleotide relative abundance
extremes: a genomic signature. Trends Genet. 11: 283–290.
Karlin, S., A. M. Campbell, and J. Mrázek, 1998 Comparative
DNA analysis across diverse genomes. Annu. Rev. Genet. 32: 185–225.
Knight, R., P. Maxwell, A. Birmingham, J. Carnes, J. G. Caporaso
et al., 2007 PyCogent: a toolkit for making sense from se-quence. Genome Biol. 8: R171.
Li, W.-H., S. Yi, and K. Makova, 2002 Male-driven evolution. Curr. Opin. Genet. Dev. 12: 650–656.
Morton, B. R., V. M. Oberholzer, and M. T. Clegg, 1997 The influence of specific neighboring bases on substitution bias in noncoding regions of the plant chloroplast genome. J. Mol. Evol. 45: 227–231. Nik-Zainal, S., L. B. Alexandrov, D. C. Wedge, P. Van Loo, C. D. Greenmanet al., 2012 Mutational processes molding the ge-nomes of 21 breast cancers. Cell 149: 979–993.
Nishino, H., V. L. Buettner, J. Haavik, D. J. Schaid, and S. S. Sommer, 1996 Spontaneous mutation in Big Blue transgenic mice: anal-ysis of age, gender, and tissue type. Environ. Mol. Mutagen. 28: 299–312.
Peltomaki, P., and H. Vasen, 1997 Mutations predisposing to he-reditary nonpolyposis colorectal cancer: database and results of a collaborative study. The international collaborative group on hereditary nonpolyposis colorectal cancer. Gastroenterology 113: 1146–1158.
Pleasance, E. D., R. K. Cheetham, P. J. Stephens, D. J. McBride, S. J. Humphray et al., 2010 A comprehensive catalogue of somatic mutations from a human cancer genome. Nature 463: 191–196.
Schluter, D., 2009 Evidence for ecological speciation and its alter-native. Science 323: 737–741.
Schneider, T. D., and R. M. Stephens, 1990 Sequence logos: a new way to display consensus sequences. Nucleic Acids Res. 18: 6097–6100.
Shannon, C. E., 1948 A mathematical theory of communication. Bell Syst. Tech. J. 27: 379–423.
Shiraishi, Y., G. Tremmel, S. Miyano, and M. Stephens, 2015 A simple model-based approach to inferring and visualizing cancer mutation signatures. PLoS Genet. 11: e1005657.
Touchon, M., S. Nicolay, A. Arneodo, Y. d’Aubenton Carafa, and C. Thermes, 2003 Transcription-coupled TA and GC strand asym-metries in the human genome. FEBS Lett. 555: 579–582. Vinson, C., and R. Chatterjee, 2012 CG methylation. Epigenomics
4: 655–663.
Webster, M. T., N. G. Smith, L. Hultin-Rosenberg, P. F. Arndt, and H. Ellegren, 2005 Male-driven biased gene conversion governs the evolution of base composition in human alu repeats. Mol. Biol. Evol. 22: 1468–1474.
Yakovchuk, P., E. Protozanova, and M. D. Frank-Kamenetskii, 2006 Base-stacking and base-pairing contributions into ther-mal stability of the DNA double helix. Nucleic Acids Res. 34: 564–574.
Ying, H., and G. Huttley, 2011 Exploiting CpG hypermutability to identify phenotypically significant variation within human protein-coding genes. Genome Biol. Evol. 3: 938–949.
Zhang, X., and C. K. Mathews, 1995 Natural DNA precursor pool asymmetry and base sequence context as determinants of rep-licationfidelity. J. Biol. Chem. 270: 8401–8404.
Zhao, Z., and E. Boerwinkle, 2002 Neighboring-nucleotide effects on single nucleotide polymorphisms: a study of 2.6 million poly-morphisms across the human genome. Genome Res. 12: 1679– 1686.