| INVESTIGATION
Risk Prediction Modeling on Family-Based Sequencing
Data Using a Random Field Method
Yalu Wen,*,†,1Alexandra Burt,‡and Qing Lu§,1 *Institute of Cancer Stem Cell, Dalian Medical University, Liaoning, 116044, China,†Department of Statistics, University of Auckland, 1010, New Zealand,‡Department of Psychology, and§Department of Epidemiology and Biostatistics, Michigan State University, East Lansing, Michigan 48824
ABSTRACTFamily-based design is one of the most popular designs in genetic studies and has many unique features for risk-prediction research. It is robust against genetic heterogeneity, and the relatedness among family members can be informative for predicting an individual’s risk for disease with polygenic and shared environmental components of risk. Despite these strengths, family-based designs have been used infrequently in current risk-prediction studies, and their related statistical methods have not been well developed. In this article, we developed a generalized randomfield (GRF) method for family-based risk-prediction modeling on sequencing data. In GRF, subjects’phenotypes are viewed as stochastic realizations of a randomfield in a space, and a subject’s phenotype is predicted by adjacent subjects, where adjacencies between subjects are determined by their genetic and within-family similarities. Different from existing methods that adjust for familial correlations, the GRF uses this information to form surrogates to further improve prediction accuracy. It also uses within-family information to capture predictors (e.g., rare mutations) that are homogeneous in families. Through simulations, we have demonstrated that the GRF method attained better performance than an existing method by considering additional information from family members and accounting for genetic heterogeneity. We further provided practical recommenda-tions for designing family-based risk prediction studies. Finally, we illustrated the GRF method with an application to a whole-genome exome data set from the Michigan State University Twin Registry study.
KEYWORDSfamily-based studies; genetic heterogeneity; high-dimensional data; randomfield theory
T
HE concept of treating diseases with precise interventions,designed rationally from a detailed understanding of the disease etiology and individual differences, has been widely accepted as the future goal of precision medicine (Collins and Varmus 2015). Toward that end, there is an expectation that
human genome discoveries and otherfindings (e.g.,
environ-mentalfindings) will revolutionize the current trial-and-error
practice of medicine by enabling more accurate disease pre-diction and precise prevention/treatment strategies (Collins
et al.2003; Collins and Varmus 2015). The use of emerging
genomicfindings and other existing knowledge to predict
disease risk is an essential step toward precision medicine
(Rogowskiet al.2009). The hope is that formed risk-prediction
models can successfully identify high-risk subpopulations so that appropriate prevention/treatment strategies can be used to reduce morbidity and mortality. While there has been suc-cess in predicting certain diseases, risk-prediction models for
most diseases lack sufficient accuracy for clinical use because
currently known predictors are insufficient for accurately
predicting disease risk (Kraft and Hunter 2009).
One possible explanation of the low accuracy of existing models is that complex diseases are likely driven by many yet-to-be discovered genetic variants, which include common genetic variants with small marginal effects and rare variants, but the current genetic studies are not powerful enough to detect all these variants (Goldstein 2009; Golan and Rosset 2014). In light of this theory, the traditional approach of
using only the significant common variants to form genetic
risk scores is expected to perform poorly because it overlooks the lion’s share of causal variants that fail to reach statistical
significance, either due to small effect sizes or minor allele
frequencies (Allen et al.2010; Yanget al.2010; Chatterjee
Copyright © 2017 by the Genetics Society of America doi:https://doi.org/10.1534/genetics.117.199752
Manuscript received January 9, 2017; accepted for publication June 27, 2017; published Early Online July 5, 2017.
Supplemental material is available online atwww.genetics.org/lookup/suppl/doi:10. 1534/genetics.117.199752/-/DC1.
et al.2013). Recent efforts in improving the prediction accu-racy have attempted to include a large number of genetic variants by applying more lenient inclusion criteria. Alterna-tive approaches have also been proposed, among which best linear unbiased prediction (BLUP) is one of the most widely used methods to predict complex traits in both animal
breed-ing and human genetics (Meuwissenet al.2001; VanRaden
2008; Yanget al.2011; de los Camposet al.2013). The basic
premise is that instead of estimating the effects for each in-dividual genetic variant, it attempts to estimate their cumu-lative effects. The genetic variance component is estimated based on a genetic relationship matrix, which gives high
val-ues for those sharing similar genetic profiles and low values
for those with different genetic profiles. In animal breeding,
the genetic variance component can be estimated using
avail-able pedigree information (Meuwissenet al.2001; VanRaden
2008), and in human genetic research the genetic variance component can be based on the genetic relationship matrices
from whole-genome data (Yanget al.2011; de los Campos
et al.2013). The implicit assumption for BLUP in human
ge-netic studies is that all common gege-netic variants have the same effect-size distribution, which can be subject to the sub-optimal performance when effects are heterogeneous (Speed and Balding 2014).
The advent of whole-genome sequencing studies has dem-onstrated that rare variants can play an important role in many common complex diseases, such as type 1 diabetes, coronary
heart disease, and drug dependence (Nejentsevet al.2009;
Cirulli and Goldstein 2010; Yanget al.2015; Zanoniet al.
2016). Recent rare variants could also be more deleterious than the common variants as they are under less selection pressures according to the evolutionary theory. While inte-grating rare mutations into a risk-prediction model can po-tentially lead to improved accuracy, few methods have been developed for risk prediction on sequencing data. The con-ventional statistical methods are not designed for sequencing data and could have been subject to low performance due to the high dimensionality of the sequencing data and low fre-quency of rare variants. Recently, gene-based approaches have been proposed for association analyses of sequencing
data, and they have led to promising findings (Neale and
Sham 2004; Wuet al.2011; Heet al.2014). Compared with
the single-variant method, gene-based methods have several advantages. The gene is the functional unit of the human genome, and jointly evaluating all genetic variants within a gene can aggregate the signal from each variant and increase the detection power. A similar idea can also be used in pre-diction analysis, where the contribution of rare variants to
disease risk can be accumulated at the gene level (Wenet al.
2016).
It is well known that family history can provide important information for disease risk prediction. Correlations among relatives can explain unmeasured polygenic and shared en-vironmental variations, and thus contribute additional infor-mation, beyond the measured genetic and environmental
data, for risk prediction (Ruderferet al.2010). Furthermore,
affected members from the same family tend to have homo-geneous genetic causes. Therefore, family-based genetic studies can provide robustness against genetic heterogeneity
(Mihaescu et al. 2013), which is important for predicting
diseases with heterogeneous underlying genetic causes
(McClellan and King 2010; Morriset al.2010). Despite these
advantages, family-based studies have been used infre-quently in current risk prediction research and their related statistical methods have not been well developed. With the emerging genetic data from family-based studies, there is a great need for new statistical methods for family-based risk prediction analysis. Existing family-based risk-prediction
methods, such as GEE-GS (Meigset al.2008), are designed
for risk prediction on a limited number of known predictors and thus are not suitable for high-dimensional genetic data. In this article, we describe a statistical approach for risk-prediction modeling using high-dimensional data from family-based genetic studies. The new method is robust against genetic heterogeneity and has the capacity of using relatedness among family members as a surrogate for unmeasured genetic and shared environmental predictors to further increase
predic-tion accuracy. Our method is built within the randomfield
framework (Cressie 1993; Adler and Taylor 2007). Moti-vated by the idea used in spatial statistics that adjacent points share similar outcomes (Cressie 1993; Cressie and
Johannesson 2008; Wu et al. 2011; He et al. 2014), we
assume genotypic similarity will lead to phenotypic
similar-ity and this assumption has been widely used in the field.
Instead of adjusting for correlations between family
mem-bers (Meigset al.2008; Chenet al.2013; Svishchevaet al.
2014), we use this information to construct within-family similarities, which is then used to form a surrogate for un-measured risk predictors. We estimate the effects of the selected genes and family information through solving gen-eralized estimating equations. Simulation studies were con-ducted to assess the effects of family information and genotypic heterogeneity on risk-prediction modeling, and further give practical recommendations for designing fam-ily-based risk-prediction studies. Finally, we illustrate the proposed method through an application to a whole-genome exome data set from the Michigan State University Twin Reg-istry (MSUTR) (Burt and Klump 2012).
Methods
A fundamental concept in quantitative genetics is to link
genetic profiles with disease outcomes through genetic
sim-ilarity among individuals (Wright 1921), and this concept has
been recently exploited using spatial models (Heet al.2014;
Wheeleret al.2014; Wenet al.2016). Spatial autocorrelation
is a common phenomenon in geospatial and ecological data, because observations from nearby locations tend to be more similar than would be expected on a random basis. The dis-ease outcomes of subjects can be viewed as observations from
specific locations in a space, and they form a stochastic
analogy with spatial statistics motivates the use of random
field models for genetic risk-prediction modeling. Specifi
-cally, we assume the outcome of a new subject cannot only be predicted by their own environmental and clinical risk factors but also adjacent subjects, where neighborhood struc-tures between subjects are determined by the genetic simi-larities of subjects and the closeness of subjects in the family. Because correlation between family members is informative for unmeasured genetic and shared environmental factors
(Ruderferet al.2010), this additional information is
incorpo-rated into generalized randomfield (GRF) to further improve
the model’s prediction accuracy. We form our GRF risk pre-diction model as
E
Yi;jY2ði;jÞ
¼ mi;jþ X
ði;jÞ6¼ðm;lÞ
lði;jÞ;ðm;lÞYm;l2mm;l
þXKkgk X
ði;jÞ6¼ðm;lÞ
skði;jÞ;ðm;lÞ
Ym;l2mm;l
;
whereY2ði;jÞdenotes the phenotypic values for all
individ-uals excluding thejth subject in theith family i.e.,Yði;jÞ;
mi;j¼fðXT
i;jbÞ denotes the mean function as defined in a
generalized linear model,bis a vector of regression
coef-ficients for covariatesX, fðxÞ is a link function he.g., for
binary outcomes, we use logit link,fðxÞ ¼1þexpexpðxðÞxÞi;gk
mea-sures the genetic effect of thekth gene on the phenotype,K
is the total number of genes,sk
ði;jÞ;ðm;lÞmeasures the genetic
similarity of thekth gene between subjectjin familyiand
subjectlin familym, andlði;jÞ;ðm;lÞmeasures the
contribu-tion of family informacontribu-tion to predictYi;jfrom subjectlin
family m. The genetic similarity between two
sub-jects based on the kth gene
h
i.e., skði;jÞ;ðm;lÞ
i
is defined as
sk
ði;jÞ;ðm;lÞ¼
Pnk
h vkh
22gki;;jh2g k;h m;l
;wheregki;;jhdenotes the
genotype of thehth marker on thekth gene for thejth
sub-ject in familyi,nkis the total number of markers on thekth
gene, andvk
his the weight used to reflect the effects of rare
variants and is commonly defined based on minor allele
frequency. The genetic similarity for the same subject is
set at zero [i.e.,sk
ði;iÞ;ðl;lÞ¼0], and thus the phenotype of a
subject does not contribute to his/her own phenotype pre-diction. When two subjects come from different families,
we assume there is no family information and thuslði;jÞ;ðm;lÞ
is set at zero. For subjects from the same family, we assume that the correlation between family members are mainly due to the shared environmental factors and genetic
relat-edness. Therefore, we modellði;jÞ;ðm;lÞas a linear
combina-tion of shared environmental effects and the theoretical correlation between family members due to genetic relatedness,
lði;jÞ;ðm;lÞ¼gwFði;jÞ;ðm;lÞþgsIði¼mandj6¼lÞ;
whereFði;jÞ;ðm;lÞis the kinship coefficient betweenjth
individ-ual in family i and lth individual in family m, and
Iði¼mandj6¼lÞ is an indicator function with
Iði¼mandj6¼lÞ ¼1 if two different subjects are from the
same family (i.e., i¼m and j6¼l), and 0 otherwise. The
Fði;jÞ;ðm;lÞ for the same subject is set at zero [i.e.,
Fði;jÞ;ði;jÞ¼0], and thus the phenotype of a subject does not
contribute to his/her own phenotype prediction.gwandgs
respectively measure predictive effects of unmeasured genet-ic variants and shared environmental factors. While here we use a kinship matrix and compound symmetric matrix to model genetic relatedness and shared environmental factors,
the model can be easily modified by using other types of
matrices and considering other factors (e.g., spouse
correlation).
For the purpose of derivation, we write the GRF model in matrix format:
EðYjY2Þ ¼mþ ðgwFþgsIeÞðY2mÞ þ
XK
k
gkSkðY2mÞ;
(1)
where Y2¼ ðY92ð1;1Þ;Y92ð1;2Þ;. . .;Y2ðM;NMÞ9Þ9; M is the total
number of families,Niis the number of individuals in family
i,Ntis the total number of subjects (i.e.,Nt¼PMi Ni), andSk
is an Nt3Nt genetic similarity matrix with sk
ði;jÞ;ðm;lÞ as its
element and zeros on the diagonal.F andIeare two block
diagonal matrices where each block represents a family. The
ðj;lÞelements of blockiforFandIeare kinship coefficient
between subjectjand subjectlin familyi[i.e.,Fði;jÞ;ði;lÞ] and 1,
respectively. Theðj;jÞelements of blockiforFandIeare set at
zero, so that the same individual does not contribute to his/ her own phenotype prediction.
LetG¼ ðg1;g2;. . .;gKÞ9denote the genetic effects
associ-ated with K genes. The parameters ðG;gw;gsÞ in Equation
1 can be estimated by solving the following unbiased gener-alized estimating equations:
Ugkðb;G;gw;gsÞ ¼
@EðYjY2Þ9
@gk
½Y2EðYjY2Þ
¼ ðY2mÞ9Sk
I2PKkgkSk2gwF2gsIe
ðY2mÞ ¼0
Ugwðb;G;gw;gsÞ ¼
@EðYjY2Þ9 @gw
½Y2EðYjY2Þ
¼ ðY2mÞ9FI2PkKgkSk2gwF2gsIe
ðY2mÞ ¼0
Ugsðb;G;gw;gsÞ ¼
@EðYjY2Þ9
@gs
½Y2EðYjY2Þ
¼ ðY2mÞ9Ie
I2PKkgkSk2gwF2gsIe
ðY2mÞ ¼0:
0 B B B B B B B B B B B B B B B B B B B B B B B B @
The regression coefficients (b) are usually unknown, and can
assumption of G¼0 andgw¼gs¼0: With the estimated parameters, the predicted value of a new subject’s phenotype is
^
yf;p¼m^f;pþ
X
ðm;lÞ h
^
gwFðf;pÞ;ðm;lÞþg^sIðf ¼mÞ
i
Ym;l2m^m;l
þX
K
k ^
gkX ðm;lÞ
skðf;pÞ;ðm;lÞ
Ym;l2m^m;l
:
(2)
It is worth noting that when the new subject is not from the families in the training data, ^gwFðf;pÞ;ðm;lÞþg^sIðf ¼mÞ ¼0 and its predicted value only relies on the demographic and
genetic predictors (i.e., the family information does not
con-tribute to the prediction). When the new individual comes from the families in the training data set, the GRF method not only uses the demographic and genetic predictors, but also uses the additional information provided by family members to capture the unmeasured genetic and shared environmen-tal predictors, and thus further improves prediction accuracy. While different measurements can be used to evaluate the discriminative ability of the model, we here use the Pearson correlation and the area under the receiver operating
character-istic curve (AUC) to evaluate the model’s performance for
contin-uous and binary outcomes, respectively. TheAUCis calculated as
AUC¼X
ND t
i¼1 XND
t
j¼1 cyib;yjb
NtDNDt
;
whereND
t andNtDare the total number of cases and controls,
respectively. The kernel functioncis defined as
cðyi;yjÞ ¼
8 < :
1 if yi.yj
0:5 if yi¼yj
0 if yi,yj
:
Data availability
The R codes for the algorithm can be found athttps://github.
com/YaluWen/FRF.
Results
Simulations
Simulation studies were conducted to evaluate the perfor-mance of the new method by considering additional informa-tion from family members and predictors that are homogeneous in families but heterogeneous across families. To illustrate, we compared the performance of the proposed method (GRF) with
another randomfield-based risk-prediction method (RF) in which
family correlation was adjusted for and only genetic information
was used to predict phenotypes (Wen et al.2016). In all the
simulations described below, the genotypes of the founders were drawn from the 1000 Genome Project and the genotypes of off-spring were generated using the gene-dropping method. In par-ticular, we randomly selected a 2-Mb region from the genome
(i.e., chromosome 1: 9,411,243–11,411,242) and randomly
chose 20-kb segments, which have200 single nucleotide
variants (SNVs). The Pearson correlation/AUC of the two
methods were compared based on 1000 replicates under various disease models with different contributions of shared environmental and unmeasured genetic factors.
We further evaluated the methods’ performance when
causal variants have heterogeneous effects on the pheno-types. Finally, we evaluated the effects of pedigree struc-tures on family-based risk prediction and provided practical recommendations for designing a family-based risk-prediction study.
Scenario I:In this set of simulations, we varied the effects of unmeasured shared environmental and genetic risk factors,
and evaluated their impacts on methods’performance. We
considered two pedigree structures, two generations with two offspring (Supplemental Material, Figure S1a in File S1) and three generations with two offspring per
gen-eration (Figure S1b inFile S1). We used 1092 individuals
from the 1000 Genome Project as the founders. Therefore, they formed 546 families and 273 families for the
two-generation scenario (i.e., two founders per family) and
three-generation scenario (i.e., four founders),
respec-tively. The genotypes for all offspring in each generation were generated using the gene-dropping method. We
sim-ulated two disease-associated genes (i.e., we selected two
nonoverlapped 20-kb segments from the genome), on which 33% of SNVs were causal. The phenotypes were simulated based on causal variants under the following additive models:
wherebk;his the genetic effect for thehth causal variant on
genek(k¼1 or 2),nkis the total number of causal variants
for thekth gene,hiNð0;f
2Þ
is the shared environmental
effect, andei;j
iid
Nð0;s2Þis the random error. For
quantita-tive phenotypes, the intercept awas set to be zero. For
binary phenotypes, a was adjusted to ensure that the
case/control ratio was1:1:
We setb1;1¼b1;2¼. . .¼b1;n1¼b1¼0:2 for all the
sim-ulations we considered. To mimic the situation where some
(Yi
;j¼aþPnh1b1;hg1i;;jhþ
Pn2
hb2;hgi2;;jhþhiþei;j for a quantative outcome
logitpYi;j¼1
¼aþPn1
h b1;hg1i;;jhþ
P
h n2
of the genetic predictors were not measured, we dropped one
of causal genes (i.e., gene 2 with effectsb2;h) from ourfinal
data set to be analyzed. For simplicity and without loss of generality, we set the effects of all the causal variants on the
dropped gene the same (b2;1¼b2;2¼. . .¼b2;n2¼b2). We
varied the effects of the dropped gene (i.e.,b2 varied from
zero to two) and shared environmental factors (i.e.,uranges
from zero to four) to evaluate the effects of unmeasured ge-netic and environmental risk factors on the performance of the method. The proportions of variations explained by mea-sured genetic factors, unmeamea-sured genetic factors, and shared environmental factors are summarized in Table S1 inFile S1. We randomly chose two-thirds of the data from each family to serve as the training data set and used the remaining data as the testing data set. The performance of the two models was assessed based on the testing samples
using the Pearson correlation andAUCs for quantitative and
binary outcomes, respectively.
The results of scenario I are summarized in Table 1. Given a
fixed level of unmeasured genetic effects, the performance of
GRF increased with the increase of the variation of the shared environmental effects, whereas the performance of RF de-creased. This indicates that when shared environmental fac-tors contribute to the disease risk, considering correlation between family members can increase the prediction accu-racy. Because correlations between family members are ad-justed, the RF model cannot account for the risk due to shared environmental factors, and this thus reduces the
pre-diction accuracy. Similarly, given afixed level of shared
envi-ronmental effects, the performance of GRF increased with the increase of unmeasured genetic effects, whereas the
perfor-mance of RF decreased. Intuitively, an individual from a fam-ily with many affected individuals tends to have a higher chance of getting the disease, and this could be either due to the shared environmental and/or shared genetic attributes.
The kinship coefficient measures the genetic relationship
be-tween two individuals, and thus could be used as a surrogate for unmeasured genetic risk factors to improve the accuracy of the prediction. As shown in Table 1, for diseases with polygenic and shared environmental components of risk, the genotypes and phenotypes of family members can be informative for an individual’s disease risk. Ignoring such information and predict-ing an individual’s disease risk solely based on his/her own genotypes may be subject to low prediction accuracy.
Scenario II:Converging evidence suggests the inherited pre-disposition to most cancers and spectrum disorders are
het-erogeneous in nature because biological pathways can be modulated by various cellular components, and any nonsy-nonymous mutations could ultimately lead to disease
devel-opment (McClellan and King 2010; Warde-Farleyet al.2012;
Wen and Lu 2013, 2016). However, most existing risk-prediction methods assume that the disease under study has homogeneous genetic/environmental causes, which can attenuate the predictive accuracy if genetic etiology
of a disease is heterogeneous (Warde-Farleyet al.2012;
Wen and Lu 2013). Compared with population-based stud-ies, family-based genetic studies offer an advantage of being robust against genetic heterogeneity. Individuals within the same family tend to share similar environmental risk factors and be more genetically related, and thus the affected individ-uals within the same family tend to have the same underlying causes. Therefore, a model built on within-family informa-tion can be formed to capture predictors that are homoge-neous in families, and provides robustness against genetic heterogeneity.
In this set of simulations, we evaluated the performance of the proposed method when the phenotypes were affected by different sets of genetic variants across families. We started with the case where the disease was caused by the same set of
genetic variants for all individuals (i.e., homogeneous
causes). We then gradually increased the number of hetero-geneous groups, with each group having its own underlying genetic causes. For simplicity, we did not consider the effects of shared environment, and the disease models were simu-lated according to Equation 4, which involves two disease-associated genes with 33% of SNVs on each gene being causal:
where bi
1;h is the genetic effect of a causal variant on gene
1 for familyi, which could vary across different families. To
be specific, let H represent the number of heterogeneous
groups, Mrepresent the total number of families, and the
function½xrepresent the integer part ofx. Thebi1;h was set
according to the following criterion:
bi
1;h¼
2; if i21
M=H
* n1
H
,h#
i21
M=H
þ1
!
* n1
H
0; otherwise
:
8 > > < > > :
For example, when two heterogeneous underlying causes were considered, the simulated families were split into two
groups, with thefirstn1=2 variants on gene 1 being causal to
thefirst family group, and the remaining variants on gene
(
Yi;j¼aþ
Pn1 hb
i
1;hg
1;h i;j þ
Pn2
h b2;hgi2;;jhþei;j for a quantative outcome logitpYi;j¼1
¼aþPn1
hb i
1;hg
1;h i;j þ
Pn2
hb2;hg2i;;jh for a binary outcome
1 being causal to the second family group. To mimic the situation where some of the causal variants were not
mea-sured, we dropped the second gene (i.e., gene 2 with effects
b2;h¼0:01) from the data set to be analyzed. Similarly to
scenario I, we also considered two pedigree structures
(Fig-ure S1, a and b, inFile S1). Individuals from the 1000
Ge-nome Project served as the founders and the genotypes of the offspring were generated based on the gene-dropping permu-tation. We randomly chose two-thirds of the data from each family to train the model and used the remaining data to test the performance of the GRF and RF methods. Pearson
corre-lations andAUCs were calculated for continuous and binary
outcomes, respectively.
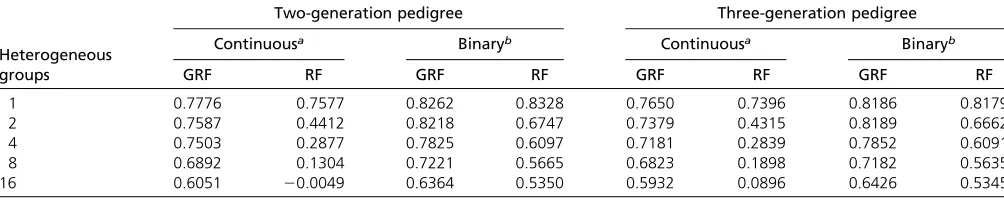
The results of scenario II are summarized in Table 2. As expected, the performance of both methods decreased as the number of heterogeneous groups increased. However, the prediction accuracy of the GRF method was much more ro-bust against the genetic heterogeneity than the RF method. For example, for continuous outcomes with the three-generation family structure, the Pearson correlation of GRF dropped from 0.7650 to 0.5932, whereas that of RF dropped from 0.7396 to 0.0896. This trend was preserved regardless of pedigree struc-tures and types of phenotypes. In the presence of genetic
het-erogeneity, the effects of risk predictors associated with a specific
group of individuals are attenuated in the entire sample and thus results in a low accuracy model. GRF uses within-family
information to capture genetic variants that are homogeneous in subgroups, and thus it can partially capture the residual effects
of the risk factors contributing specificity to individuals within a
family. This makes the GRF method more robust against genetic heterogeneity.
Scenario III: In this set of simulations, we evaluated the effects of pedigree structures on the performance of the method and provided practical recommendations for
design-ing a family-based risk-prediction study. Wefirst considered
the situation where the total number of individuals isfixed,
and then considered the case where the total number of families is predetermined. For all the above settings, we
considered the sibling design (Figure S1c in File S1), the
two-generation pedigree design (Figure S1d in File S1),
and the three-generation pedigree design (Figure S1b inFile
S1). The details of the settings are summarized in Table S2 in
File S1. Genotypes of the founders were drawn from the 1000 Genome Project, and the genotypes of the offspring were generated using the gene-dropping method. The phe-notypes were simulated using Equation 3. We considered
three situations: (1) both measured (b1;h) and unmeasured
(b2;h) genetic causes contributed to disease risk (i.e.,
b1;h¼0:3;b2;h¼0:4;hi¼0); (2) only measured genetic
and shared environmental factors affected the outcomes
[i.e.,b1;h¼0:3;hiNð0;1Þ;b2;h¼0]; and (3) both measured
Table 1 The accuracy performance of GRF and RF with different unmeasured genetic and shared environmental effects for two-generation and three-two-generation families
f2a
b2¼0b b2¼0:4 b2¼0:8 b2¼1:2 b2¼2
GRF RF GRF RF GRF RF GRF RF GRF RF
Continuous outcomes with the two-generation pedigreec
0 0.4716 0.5711 0.6336 0.1805 0.6449 0.0840 0.6482 0.0440 0.6496 0.0125
1 0.6555 0.4715 0.6487 0.1661 0.6495 0.0781 0.6498 0.0409 0.6499 0.0133
2 0.7426 0.4128 0.6648 0.1678 0.6550 0.0803 0.6526 0.0445 0.6512 0.0105
4 0.8272 0.3419 0.6896 0.1523 0.6635 0.0742 0.6567 0.0411 0.6521 0.0143
16 0.9408 0.2021 0.7753 0.1227 0.7062 0.0668 0.6803 0.0376 0.6626 0.0109
Binary outcomes with the two-generation pedigreed
0 0.6850 0.6900 0.7624 0.5790 0.7866 0.5492 0.7943 0.5378 0.7979 0.5297
1 0.7079 0.6673 0.7717 0.5768 0.7920 0.5484 0.7980 0.5388 0.8018 0.5303
2 0.7394 0.6522 0.7776 0.5757 0.7924 0.5480 0.7984 0.5380 0.8012 0.5300
4 0.7848 0.6322 0.7912 0.5724 0.7984 0.5481 0.8005 0.5378 0.8029 0.5302
16 0.8818 0.5859 0.8331 0.5614 0.8155 0.5444 0.8098 0.5367 0.8064 0.5299
Continuous outcomes with the three-generation pedigreec
0 0.5293 0.5544 0.6903 0.1825 0.7045 0.0915 0.7089 0.0538 0.7114 0.0248
1 0.7053 0.4553 0.7017 0.1710 0.7072 0.0882 0.7094 0.0544 0.7105 0.0265
2 0.7864 0.3967 0.7163 0.1708 0.7131 0.0880 0.7129 0.0537 0.7128 0.0251
4 0.8606 0.3268 0.7349 0.1567 0.7179 0.0848 0.7139 0.0536 0.7116 0.0261
16 0.9538 0.1920 0.8071 0.1283 0.7524 0.0775 0.7333 0.0500 0.7209 0.0246
Binary outcomes with the three-generation pedigreed
0 0.6820 0.6838 0.7933 0.5775 0.8249 0.5503 0.8340 0.5415 0.8397 0.5342
1 0.7309 0.6620 0.8031 0.5774 0.8270 0.5516 0.8352 0.5418 0.8402 0.5349
2 0.7739 0.6470 0.8108 0.5739 0.8298 0.5496 0.8362 0.5416 0.8409 0.5342
4 0.8264 0.6274 0.8245 0.5718 0.8336 0.5505 0.8384 0.5416 0.8412 0.5345
16 0.9203 0.5819 0.8701 0.5603 0.8546 0.5459 0.849 0.5392 0.8458 0.5341
aThe effects of shared environmental factors. b
The effects of causal variants from the dropped gene.
and unmeasured genetic causes, as well as shared
envi-ronmental factors contributed to disease risk [i.e.,
b1;h¼0:3;hiNð0;1Þ;b2;h¼0:4]. We randomly chose
two-thirds of the data from each family to serve as the train-ing data set and used the remaintrain-ing data as the testtrain-ing data set. The performance of the GRF model was assessed based on the testing samples using the Pearson correlations and
AUCs for continuous and binary outcomes, respectively.
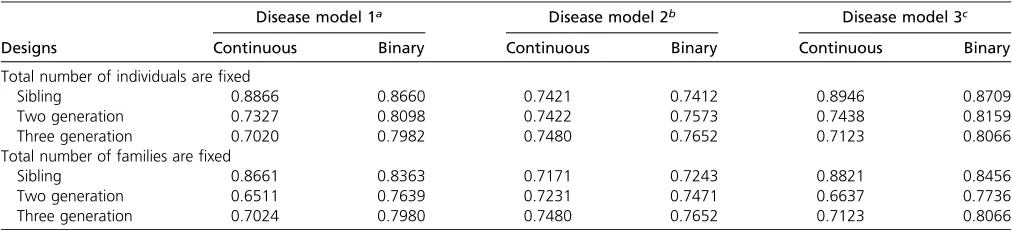
The results of scenario III are summarized in Table 3. With
the total sample size fixed, the sibling design achieved the
highest prediction accuracy while the three-generation de-sign had the lowest accuracy when unmeasured genetic fac-tors contributed to disease risk. This could be explained by the fact that kinship correlation between adjacent genera-tions tended to be larger as compared to that for generagenera-tions that are far apart. Similarly, the average kinship correlation in the sibling design is larger than that in the two-generation designs with unrelated founders. When only shared environ-mental factors contributed to disease risk, the three designs tended to perform similarly, among which the three-generation design attained the highest accuracy. This is mainly due to the fact that correlation between family members is treated the same as when only shared environmental factors contributed
to disease risk. Given thefixed sample size, larger pedigrees
have more related individuals, and thus contribute more infor-mation to disease-risk prediction.
When the total number of families wasfixed, the
conclu-sions were similar to those when the total sample sizes were
fixed. One exception is that the two-generation design tended
to perform worse than the three-generation design when unmeasured genetic factors contributed to disease risk. With
afixed number of families, a three-generation design has more
samples than a two-generation design, and thus attained better performance. It is worth noting that the sibling design tends to achieve a higher prediction accuracy than the three-generation design when unmeasured genetic factors contrib-uted to disease risk, even when the total sample size in sibling design is smaller than that in the three-generation design. This is mainly due to the fact that, on average, the genetic corre-lation between siblings within a family is larger than that in a three-generation design. Therefore, the sibling design is more informative to capture unmeasured genetic factors.
In summary, when a substantial amount of disease risk is due to unmeasured genetic factors, a study design that aims at recruiting individuals that are highly genetically related can help to build an accurate risk-prediction model. On the other hand, when shared environmental factors play key roles in the disease development, the risk-prediction model built from a study with large pedigrees tends to have higher prediction accuracy.
Real data application
We applied the GRF method to whole-genome exome data from the Twin Study of Behavioral and Emotional Develop-ment in Children (TBED-C), a study within the MSUTR (Burt and Klump 2012). The TBED-C is a population-based twin
study investigating genetic–environmental interactions that
contribute to conduct problems in children. A total of 1000 twins aged between 6 and 10 years old (500 twin fam-ilies and 50% monozygous twins) in Michigan were recruited. DNA samples were collected from each pair of twins, and they were genotyped using the Illumina Human Core Exome chip that includes common variants, rare vari-ants, mitochondrial DNA, and indels. We applied relatively stringent quality-control criteria, where samples with call
rate ,97% or missing rate larger than 3% were excluded.
The exclusion criteria for SNVs were (1) call rate,98%, (2) a
P-value for Hardy–Weinberg equilibrium test of,1025;and
(3) a missing rate .2%. After the quality assessment,
957 samples and 513,886 SNVs remained for the analysis. Parents completed the child behavior checklist (CBCL) separately for each twin, and they rated the extent to which a series of statements describing their children’s behavior (three point scale with 0 = never and 2 = mostly true) (Achenbach and Rescorla 2003; Burt and Klump 2012). Teacher(s) of each twin also completed the teacher report form, whose scales were fully comparable to those on the
CBCL. The well-known aggressive scales (e.g.,“bullies,” “gets
infights,” “attacks people”; 18 items) were used (Burt and
Klump 2012). Children’s aggressive behavior was summarized based on the recommended approach that the data were
aver-aged across parental informant and the teachers’reports and
the analyses were conducted on the raw scale scores
(Achenbachet al.1987; Achenbach and Rescorla 2003).
Table 2 Accuracy performance of GRF and RF with different underlying heterogeneous causes for two-generation and three-generation families
Heterogeneous groups
Two-generation pedigree Three-generation pedigree
Continuousa Binaryb Continuousa Binaryb
GRF RF GRF RF GRF RF GRF RF
1 0.7776 0.7577 0.8262 0.8328 0.7650 0.7396 0.8186 0.8179
2 0.7587 0.4412 0.8218 0.6747 0.7379 0.4315 0.8189 0.6662
4 0.7503 0.2877 0.7825 0.6097 0.7181 0.2839 0.7852 0.6091
8 0.6892 0.1304 0.7221 0.5665 0.6823 0.1898 0.7182 0.5635
16 0.6051 20.0049 0.6364 0.5350 0.5932 0.0896 0.6426 0.5345
Before the risk-prediction analysis, wefirst conducted the Fisher’s exact test on each of the common variants (minor
allele frequencies .5%) and only included those variants
with a P-value less than a relatively lenient prespecified
threshold (i.e.,P= 0.1) for the risk-prediction analysis. The
selected markers that were within 50,000 bp were grouped into one group. We applied both the GRF and RF methods to the data. To account for the contribution of rare variants, we
specified the weight for each variant asvkh¼ ½1=
ffiffiffiffiffiffiffiffiffiffiffiffiffiffiffiffiffiffiffiffi
fk hð12fhkÞ
q
;
wherefk
h is the minor allele frequency for thehth marker on
thekth gene. The Pearson correlation for the risk-prediction
models built by GRF and RF are 0.594 and 0.186,
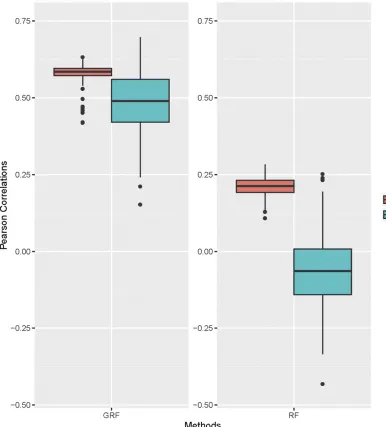
respec-tively. To avoid overfitting and the chancefinding problems,
we randomly split the data into training and testing sets with 100 individuals in the testing set. We repeated this process 500 times. For each replicate, we used the training data to train the model and calculated the Pearson correlations for both the training data and the testing data. The mean Pear-son correlations in the training data sets for GRF and RF are 0.582 and 0.212, respectively. The mean Pearson correlations in the testing data sets for GRF and RF are 0.485 and 0.067,
respectively. The RF method had significantly lower accuracy
than the GRF method (Figure 1), which indicates that incor-porating family information into the risk-prediction model can potentially improve the model’s performance.
Discussion
The recent successes made through large-scale association studies have stimulated interest in the genomic prediction of disease risk, which may potentially enable risk prediction at the individual level and ultimately facilitate precision medi-cine. Although risk-prediction methods use similar genetic data to those from association studies, their main goal is different. While association studies focus on detecting re-producible disease-associated signals, the main aim of risk-prediction research is to maximize the predictive power. Validity and robustness are the two key concerns for a pre-diction model, and a causal interpretation is not absolutely necessary for a good predictive model (Abraham and Inouye
2015). Therefore, family-based genetic studies are appealing for risk-prediction research, because family information can be used to form surrogates to capture genetic heterogeneity as well as unmeasured polygenic and/or shared environmental factors so that prediction accuracy can be further improved.
In this article, we proposed a GRF method within the
random field framework for risk prediction research using
high-dimensional genetic data from family-based studies, where the correlations between family members have been explicitly modeled and incorporated into the prediction model to improve the model’s performance. Through simulation studies and an application to real data, we demonstrated that familial correlation can serve as a surrogate for unmeasured genetic and environmental risk factors, and can be used to improve prediction accuracy. Indeed, it has long been recog-nized that family history alone can help identify people at high risk. Family information remains an important factor in the prediction of many complex diseases with a substantial amount of heritability due to a combination of genetic fac-tors, shared familial environmental conditions, and lifestyle choices. Despite its clinical importance, few methods fully use this information when building a risk-prediction model from
high-dimensional genomic data. A common practice is tofirst
estimate the genetic effects with family correlation being ad-justed, and then build the risk-prediction model based on the
estimated genetic effects (Meigset al.2008). Although this
strategy allows researchers to evaluate the role of disease-associated variants in family-based risk-prediction studies, ignoring family information can lead to a less accurate model if there are unmeasured genetic and/or shared environmen-tal factors. There is a connection between GRF and the com-mon practice. If an individual is not related to anyone in the training data, then the prediction is solely determined by his/ her genotypes, which is exactly the same as the common practice. However, for individuals that are from the families in the training set, their predictions are determined not only
based on their own genotypes, but also risk profiles from their
family members. By using extra information from the family, the model’s performance can be further improved.
Converging evidence suggests that diseases with the same or similar clinical manifestations may have different Table 3 Accuracy performance of GRF given different pedigree structures and underlying causes
Designs
Disease model 1a Disease model 2b Disease model 3c
Continuous Binary Continuous Binary Continuous Binary
Total number of individuals arefixed
Sibling 0.8866 0.8660 0.7421 0.7412 0.8946 0.8709
Two generation 0.7327 0.8098 0.7422 0.7573 0.7438 0.8159
Three generation 0.7020 0.7982 0.7480 0.7652 0.7123 0.8066
Total number of families arefixed
Sibling 0.8661 0.8363 0.7171 0.7243 0.8821 0.8456
Two generation 0.6511 0.7639 0.7231 0.7471 0.6637 0.7736
Three generation 0.7024 0.7980 0.7480 0.7652 0.7123 0.8066
aBoth measured and unmeasured genetic causes contributed to disease risk.
bMeasured genetic factors and shared environmental factors contributed to disease risk.
underlying causes (McClellan and King 2010; Morris et al.
2010). Treating the disease under study as one unified
phe-notype with homogeneous genetic and environmental causes will likely attenuate the predictive power and results in a low-accuracy prediction model if heterogeneity presents. Com-pared with population-based studies, family-based studies offer a unique opportunity for considering genetic heteroge-neity. Family members tend to share similar environmental risk factors and they are genetically more related than the general population. Therefore, the affected individuals in the family tend to have more homogeneous underlying causes. Indeed, the idea of using the family to model genetic hetero-geneity can be traced back to the era of linkage analyses. In our proposed GRF method, we used the within-family simi-larities to capture the potential genetic heterogeneity. Through simulation studies, we demonstrated that such a strategy can substantially improve the model’s accuracy.
Random field models have long been used for mining
massive geospatial and imaging data (Cressie and Johannes-son 2008). Spatial autocorrelation is a common phenomenon in these data because observations from nearby locations tend to be more similar than would be expected on a random basis. Motivated by this idea, in our proposed GRF, we view
phenotypes of subjects as a randomfield in a space spanned
by their genotypes and family information, and thus the out-come of a new subject can be predicted by adjacent subjects in this space, where adjacencies between subjects are deter-mined by their genetic and family relatedness. As evidenced by association studies, rare variants can play an important role in the underlying mechanism of human diseases, and thus they hold great promise in improving prediction accu-racy. In our proposed method, we captured the effects of rare
variants by the weight function that is defined according
BLUP-type methods, in our proposed GRF we allowed different genes to have different directions and magnitudes of effect
sizes (gk). In this article, we also provide practical
recommen-dations for designing a family-based risk-prediction study. When a substantial amount of disease risk is due to unmea-sured genetic factors, the study that aims at recruiting more genetically correlated individuals tends to have greater pre-dictive power. On the other hand, when shared environmen-tal factors play key roles in the disease etiology, recruiting a large pedigree could lead to increased accuracy.
In the real data application, we built risk-prediction models for aggressive behavior using whole-genome exome data from TBED-C. On average, the Pearson correlations for GRF and RF are 0.485 and 0.067, respectively. This sug-gests that incorporating family information into the risk-prediction model can substantially improve risk-prediction
accuracy. The formed risk-prediction model is one of thefirst
prediction models for aggressive behavior, which explains
24% of the variations in the children’s aggressive behavior.
Further studies from independent samples are also needed to fully test the validity and robustness of our proposed model.
Acknowledgments
The authors thank all participating twins and their families. The Project was supported by the National Natural Science
Foundation of China (award no. 81502887); the Scientific
Research Foundation for the Returned Overseas Chinese Scholars, State Education Ministry; the National Institute of Dental and Craniofacial Research under award number R03 DE-022379; and the National Institute on Drug Abuse under award number K01 DA-033346. The Twin Study of Behav-ioral and Emotional Development in Children data collec-tion was supported by R01 MH-081813 from the Nacollec-tional Institute of Mental Health. The content is solely the re-sponsibility of the authors and does not necessarily
repre-sent the official views of the National Institute of Mental
Health or the National Institutes of Health.
Literature Cited
Abraham, G., and M. Inouye, 2015 Genomic risk prediction of complex human disease and its clinical application. Curr. Opin. Genet. Dev. 33: 10–16.
Achenbach, T. M., and L. A. Rescorla, 2003 Manual for the ASEBA School-Age Forms & Profiles. University of Vermont, Research Center for Children, Youth, and Families, Burlington, VT. Achenbach, T. M., S. H. McConaughy, and C. T. Howell,
1987 Child/adolescent behavioral and emotional problems: implications of cross-informant correlations for situational spec-ificity. Psychol. Bull. 101: 213–232.
Adler, R. J., and J. E. Taylor, 2007 Random Fields and Geometry (Springer Monographs in Mathematics). Springer-Verlag, New York.
Allen, H. L., K. Estrada, G. Lettre, S. I. Berndt, M. N. Weedonet al., 2010 Hundreds of variants clustered in genomic loci and biological pathways affect human height. Nature 467: 832–838.
Burt, S. A., and K. L. Klump, 2012 Etiological distinctions between aggressive and non-aggressive antisocial behavior: results from a nuclear twin family model. J. Abnorm. Child Psychol. 40: 1059–1071.
Chatterjee, N., B. Wheeler, J. Sampson, P. Hartge, S. J. Chanock et al., 2013 Projecting the performance of risk prediction based on polygenic analyses of genome-wide association stud-ies. Nat. Genet. 45: 400–405.
Chen, H., J. B. Meigs, and J. Dupuis, 2013 Sequence kernel asso-ciation test for quantitative traits in family samples. Genet. Epi-demiol. 37: 196–204.
Cirulli, E. T., and D. B. Goldstein, 2010 Uncovering the roles of rare variants in common disease through whole-genome se-quencing. Nat. Rev. Genet. 11: 415–425.
Collins, F., and H. Varmus, 2015 A new initiative on precision medicine. N. Engl. J. Med. 372: 793–795.
Collins, F., E. Green, A. Guttmacher, and M. Guyer, 2003 A vision for the future of genomics research. Nature 422: 835–847. Cressie, N., and G. Johannesson, 2008 Fixed rank kriging for very
large spatial data sets. J. R. Stat. Soc. Series B Stat. Methodol. 70: 209–226.
Cressie, N. A. C., 1993 Statistics for Spatial Data(Wiley Series in Probability and Mathematical Statistics Applied Probability and Statistics), revised edition. Wiley, New York.
de los Campos, G., A. I. Vazquez, R. Fernando, Y. C. Klimentidis, and D. Sorensen, 2013 Prediction of complex human traits using the genomic best linear unbiased predictor. PLoS Genet. 9: e1003608.
Golan, D., and S. Rosset, 2014 Effective genetic-risk prediction using mixed models. Am. J. Hum. Genet. 95: 383–393. Goldstein, D. B., 2009 Common genetic variation and human
traits. N. Engl. J. Med. 360: 1696–1698.
He, Z., M. Zhang, X. Zhan, and Q. Lu, 2014 Modeling and testing for joint association using a genetic random field model. Bio-metrics 70: 471–479.
Kraft, P., and D. Hunter, 2009 Genetic risk prediction–are we there yet? N. Engl. J. Med. 360: 1701–1703.
McClellan, J., and M. C. King, 2010 Genetic heterogeneity in hu-man disease. Cell 141: 210–217.
Meigs, J. B., P. Shrader, L. M. Sullivan, J. B. McAteer, C. S. Foxet al., 2008 Genotype score in addition to common risk factors for prediction of type 2 diabetes. N. Engl. J. Med. 359: 2208–2219. Meuwissen, T. H. E., B. J. Hayes, and M. E. Goddard, 2001 Prediction of total genetic value using genome-wide dense marker maps. Genetics 157: 1819–1829.
Mihaescu, R., M. J. Pencina, A. Alonso, K. L. Lunetta, S. R. Heckbert et al., 2013 Incremental value of rare genetic variants for the prediction of multifactorial diseases. Genome Med. 5: 76. Morris, A. P., C. M. Lindgren, E. Zeggini, N. J. Timpson, T. M.
Frayling et al., 2010 A powerful approach to sub-phenotype analysis in population-based genetic association studies. Genet. Epidemiol. 34: 335–343.
Neale, B. M., and P. C. Sham, 2004 The future of association studies: gene-based analysis and replication. Am. J. Hum. Genet. 75: 353–362.
Nejentsev, S., N. Walker, D. Riches, M. Egholm, and J. A. Todd, 2009 Rare variants of IFIH1, a gene implicated in antiviral re-sponses, protect against type 1 diabetes. Science 324: 387–389. Rogowski, W., S. Grosse, and M. Khoury, 2009 Challenges of
translating genetic tests into clinical and public health practice. Nat. Rev. Genet. 10: 489–495.
Ruderfer, D. M., J. Korn, and S. M. Purcell, 2010 Family-based genetic risk prediction of multifactorial disease. Genome Med. 2: 2.
Svishcheva, G. R., N. M. Belonogova, and T. I. Axenovich, 2014 FFBSKAT: fast family-based sequence kernel association test. PLoS One 9: e99407.
VanRaden, P. M., 2008 Efficient methods to compute genomic predictions. J. Dairy Sci. 91: 4414–4423.
Warde-Farley, D., M. Brudno, Q. Morris, and A. Goldenberg, 2012 Mixture model for sub-phenotyping in GWAS. Pac. Symp. Biocomput. 2012: 363–374.
Wen, Y., and Q. Lu, 2013 A multiclass likelihood ratio approach for genetic risk prediction allowing for phenotypic heterogene-ity. Genet. Epidemiol. 37: 715–725.
Wen, Y., and Q. Lu, 2016 A clustered multiclass likelihood-ratio ensemble method for family-based association analysis account-ing for phenotypic heterogeneity. Genet. Epidemiol. 40: 512– 519.
Wen, Y., Z. He, M. Li, and Q. Lu, 2016 Risk prediction modeling of sequencing data using a forward randomfield method. Sci. Rep. 6: 21120.
Wheeler, H. E., K. Aquino-Michaels, E. R. Gamazon, V. V. Trubetskoy, M. E. Dolanet al., 2014 Poly-omic prediction of complex traits: OmicKriging. Genet. Epidemiol. 38: 402–415.
Wright, S., 1921 Systems of mating. i. the biometric relations be-tween parent and offspring. Genetics 6: 111–123.
Wu, M. C., S. Lee, T. Cai, Y. Li, M. Boehnke et al., 2011 Rare-variant association testing for sequencing data with the se-quence kernel association test. Am. J. Hum. Genet. 89: 82–93. Yang, J., B. Benyamin, B. P. McEvoy, S. Gordon, A. K. Henderset al., 2010 Common SNPs explain a large proportion of the herita-bility for human height. Nat. Genet. 42: 565–569.
Yang, J., S. H. Lee, M. E. Goddard, and P. M. Visscher, 2011 GCTA: a tool for genome-wide complex trait analysis. Am. J. Hum. Genet. 88: 76–82.
Yang, J., S. Wang, Z. Yang, C. A. Hodgkinson, P. Iarikovaet al., 2015 The contribution of rare and common variants in 30 genes to risk nicotine dependence. Mol. Psychiatry 20: 1467–1478.
Zanoni, P., S. A. Khetarpal, D. B. Larach, W. F. Hancock-Cerutti, J. S. Millaret al., 2016 Rare variant in scavenger receptor BI raises HDL cholesterol and increases risk of coronary heart dis-ease. Science 351: 1166–1171.