LOAD TIME FUNCTION DEFINITION FOR LARGE COMMERCIAL
AIRCRAFT IMPACT: PARAMETRIC STUDY
Marin Kostov1, Alexander Iliev2, and Anton Andonov3
1 Professor, Earthquake Engineering Department, Bulgarian Academy of Sciences, Sofia, Bulgaria 2 Specialist, Risk Engineering Ltd., Sofia, Bulgaria
3 Chief Expert, Risk Engineering Ltd., Sofia, Bulgaria
ABSTRACT
After the terrorist attacks on the WTC in 2001 the impact of a large commercial airplane has become important for the design of nuclear power plants but also for the evaluation of the safety and emergency preparedness of existing critical facilities. There are, meanwhile, many guidelines how to perform such evaluations. All of them emphasize that the approaches and assumptions used as well as the acceptance criteria applied should be “realistic”. Obviously it is quite difficult to characterize what is a realistic assumption for a malevolent act. Hereafter, we will use simple engineering approaches for assessing the most important uncertainties involved in the evaluation of the load time function (LTF) due to a large commercial aircraft impact. The study is performed with statistical data for a Boeing 747-400 and Riera’s formulation of the impact force; however, it is applicable to any other large commercial aircraft and complete missile-target interaction. We have assumed that the mass of the aircraft, the eventual impact speed and the impinging force are log-normally distributed. The Latin Hypercube Generation is used for creating a sample of load time functions that is correspondingly analyzed, i.e. best estimate values as well as LTF with different confidence levels are presented.
The results show that the most probable LTF are with much smaller intensity than those used for design. The usual design LTF corresponds to confidence levels of 95% or higher. A graded approach for selection of a suitable LTF with a corresponding lower confidence level when performing safety analysis of existing facility could be used on the basis of the presented results.
INTRODUCTION
The load case – aircraft impact – is not new in the nuclear power plant design. One important starting point was the request of the US National Regulatory Commission in 1968 for safety evaluation of the Three-Mile Island nuclear power plant station against accidental aircraft impact. As part of this project, a method for calculation of the load time function for an aircraft impact on a rigid target has been developed, Riera (1968). The work is considered a pioneering study of the aircraft impact problem and the developed method for a load time function calculation, known later as Riera’s method, is still used today. The September 11, 2001 attacks on the WTC and the Pentagon prompted new research activities shifting the focus towards malicious aircraft impact of a large commercial l aircraft. This, together with the new software and hardware capabilities, led to the introduction and broader application of more advanced methods for an aircraft impact loading definition via nonlinear finite element analysis of the complete dynamic interaction of missile and target.
When discussing the loads due to a malevolent crash of a large commercial airplane we consider only the biggest passenger airplanes that are in operation nowadays; those are the Boeing 747, Boeing 767 and Airbus 380. These airplanes were developed at significantly different points in time, with a considerable difference in concept and materials used. All of these factors inevitably lead to a difference in the load time functions. There are a great number of structural and non-structural factors influencing the load time functions. The structural differences of basic parts of the airplane, such as fuselage, wings, central wing box, engines etc. are essential for the modeling and the final outcomes. Furthermore, some of the non-structural components, such as the quantity and distribution of fuel as well as the payloads influence the load time function characteristics. Despite the variety of all those characteristics there are some basic assumptions and criteria that are valid for all cases and they are contained in the simple Riera’s formulation of the impact load. These basic features that are influencing the load function are also valid for a finite element formulation of impact and complete missile-target interaction analysis. Obviously, those basic characteristic that are most important for the definition of the load time functions are the speed, the mass, and the crushing strength of the missile. For simplicity, we will use in the further analysis only the Riera’s formulation, although the reasoning is applicable and valid also for complete missile-target models. We will exemplify the uncertainty assessment using only the airplane data of Boeing 747. The methods applied, however, are valid for all the above mentioned large commercial planes which we have also analyzed.
The basic idea is that the main source of uncertainties of the loads due to aircraft impact are due to uncertainties of the mass definition of the airplane, the uncertainty of the speed at impact and the uncertainty of the crushing strength. There are for sure many other uncertainties involved, e.g. angle of impact, deformability of target, characteristics of contacts, etc. that we will, however, not consider. We would like to quantify those uncertainties in order to assess the impact loads with a certain level of confidence as it is usual in the engineering practice. For that purpose, we will analyze the statistics and properties of the weight characteristics of the commercial planes, the possible ranges and most probable impact speeds, as well as the variation of the crushing strength.
MASS STATISTICS
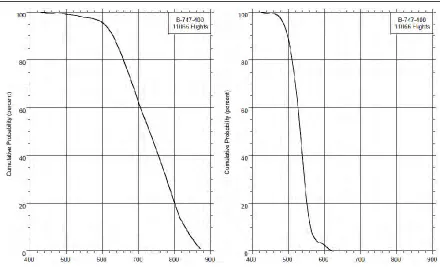
Fortunately, the statistics of the take-off and landing weight of the commercial planes is a well studied parameter by the Federal Aviation Administration (2005) and we will take advantage of that. Statistics of the take-off and the landing weights are available for many types of aircrafts. As an example the cumulative probability distributions of gross weight during take-off and landing for B747-400 are presented in Figure 1. The occurrences of take-off gross weight show a wide variation as one would expect due to differing fuel weights for different length flights and variable passenger and cargo loading. The maximum take-off weight is reached at very few of the flights, below 2%. The landing weight distribution shows some tendency to group within a narrower range that could clearly indicate the goal to land at a planned landing weight. It is noteworthy that some landing gross weights observed were close to the maximum design landing gross weight.
Figure 1. Cumulative probability of take-off and landing gross weight (klb)
Our assumption is that the variable weight of the airplane is log-normally distributed. The variable weight is added to the constant dry operational weight which usually is less than 50% of the maximum take-off weight of the large passenger airplanes. This is not necessarily the case for smaller aircrafts.
IMPACT SPEED
The impact speed is the parameter with highest uncertainty but also, unfortunately, with highest importance. This is caused mainly due to the fact that the impact speed is highly dependent on human factors.
After the 9/11 terroristic attacks, the National Transportation Safety Board (NTSB) published a report “Radar Data Impact Speed Study” , Bower (2002), which contains the impact speed of American Airlines Flight 11 (Boeing 767) which crashed into WTC 1, United Airlines Flight 175 (Boeing 767) crashed into WTC 2. NTSB (2002) published another separate report for American Airlines Flight 77 (Boeing 757) which crashed into the Pentagon.
These documents provide a brief description of the flight path of the aircraft based on information obtained from various sources of recorded radar of the subject aircraft. Information from the Flight Data Recorder (FDR) recovered on scene is also used to develop the description of the flight-path.
Flight AA11 descended from 6000 to 5000 feet with speed near 290 knots (149 m/s). During the final 15 seconds of flight, the aircraft descends to 1000 feet altitude and impacts WTC 1 at approximately 430 knots (221 m/s) groundspeed.
During the descent from 12000 to 6000 feet, flight UAL 175 maintained groundspeed between 500-520 knots (257-267 m/s). As the aircraft made its final descent to 1000 feet it accelerated and impacted WTC 2 at approximately 510 knots (262 m/s) groundspeed.
“Pilots For 9/11 Truth” (2009) have analyzed data provided by the NTSB in terms of a "Radar Data Impact Speed Study" in which the NTSB concludes 510 knots and 430 knots for United 175 (WTC 2) and American 11 (WTC 1), respectively. A benchmark has been set by the October 1999 crash of Egypt Air 990, a 767 which exceeded its maximum operating limits causing in-flight structural failure, of which data is available to compare to the WTC Attack Aircraft.
Egypt Air 990 (EA990) is a 767 which was reported to have entered a dive and accelerated to a peak speed of .99 Mach at 22,000 feet. Boeing sets maximum operating speeds for the 767 as 360 knots and .86 Mach. The reason for two airspeed limitations is due to air density at lower vs. higher altitudes. To understand equivalent dynamic pressures on an airframe of low vs. high altitude, there is an airspeed appropriately titled "Equivalent Airspeed" or EAS. EAS is defined as the airspeed at sea level which produces the same dynamic pressure acting on the airframe as the true airspeed at high altitudes.
“Pilots For 9/11 Truth” (2009) has calculated the Equivalent Airspeed for EA990 peak speed of .99 Mach at 22,000 feet as the equivalent dynamic effects of 425 knots at or near sea level. This airspeed is 65 knots over max operating for a 767, 85 knots less than the alleged United 175, and 5 knots less than the alleged American 11. Although it may be probable for the alleged American 11 to achieve such speed as 430 knots is only 5 knots over that of EA990 peak speed, it is unlikelyfor the alleged United 175 to achieve the speeds reported by the NTSB using EA990 as a benchmark.
Much controversy has surrounded the speeds reported for the World Trade Center attack aircraft. However, none of the arguments for either side of the debate have been properly based on actual data, until now.
Another possibility to define the impact speed is to use a flight simulator provided by the airplane's manufacturer or others. Flight simulation is used extensively in the aviation industry to train pilots and other flight crew for both civil and military aircraft. In the past years, flight simulators are intensively developed and their reliability and robustness provide behavior which is extremely close to the real airplane operation. Even a PC flight simulator could be part of training programs conducted by the US Navy, Flight Safety International, and Embry-Riddle Aeronautical University.
Nevertheless, the development of a complete statistical survey on impact speed based on the use of flight simulators requires excessive time resources and has not been conducted yet. However, the limited experience for trial application lead to preliminary conclusions:
The impact speed is inversely proportional to the size and weight of the airplane (large airplanes are likely to impact the target with lower speed). Large airplanes, such as the B 747-400 are less maneuverable than smaller airplanes, thus making it more difficult to impact the intended target with peak speed.
Impact speed is highly dependent on pilot training. A trained “pilot” is having much higher chances for success (i.e. crushing the target).
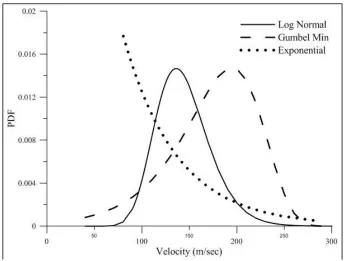
For the current study several probabilistic definitions of the impact speed are being discussed. The majority of the speeds at touchdown for B 747-400 are between 140 and 155 knots, FAA (2005). At this speed, there is very high probability that the pilot will hit the intended target (in general this is the runway). Based on this fact, we assume that the probability distribution of impact speed will be a log-normal distribution with high probability at touchdown speed (80 m/s) and with the increase of speed, the probability of success will decrease, where at maximum operating speed (260 m/s) there will be a low probability of success. If we assume that there is 99.9% chance of having impact speed higher than 80 m/s and only 0.1% chance of having impact speed higher than 260 m/s the characteristics of the log-normal distribution are easily defined, see Figure 2.
Another possibility is to use an exponential distribution of impact speed. With very low probability that speed at impact is going to be higher than 260 m/s (i.e.0.1%) or with high probability that the crushing speed is higher than 80 m/s (i.e. 99.9%) the parameters of the corresponding exponential distribution are defined, Figure 2.
Figure 2. Log-normal, Exponential and Gumbel distribution of impact speed
PROBABILISTIC DEFINITION OF CRUSHING STRENGTH
The stiffness of the aircraft can be represented as a sum of stiffness of the individual aircraft's components, e.g. fuselage, wings, stabilizers, engines, etc.
The structure of wings and stabilizers is composed of densely distributed ribs and beams. Therefore, this structure can be categorized as “stiff” and the crushing force that acts on these sections can be calculated as multiplication of the cross section by the yielding stress of the material.
The engines of the aircraft consist of a longitudinal shaft and the disks (blades) of the turbine and compressor. In most cases, the engine is assumed to be a rigid body.
Most modern large aircraft are built using a fuselage with semi-monocoque structure. This is the preferred method of constructing an all-aluminum fuselage. First, a series of frames in the shape of the fuselage cross sections are held in position on a rigid fixture. These frames are then joined with lightweight longitudinal elements called stringers. These are in turn covered with a skin of aluminum attached by riveting or by bonding with special adhesives.
An aircraft fuselage can be simplified as a thin-walled tubular missile. Axially loaded thin-walled tubular structures deform in the form of progressive buckling. In progressive buckling, hinges form progressively starting from the loaded end of the structure. The structure folds and the crushing resistance is unstable. The progressive buckling phenomenon is presented in Figures 3. It is evident that the tube exhibits an unstable behavior after reaching the first peak load at point A (Figure 3).
It is evident from Figure 3 that the load-displacement behavior exhibits a repeated (cyclic) pattern. In fact, each pair of peaks in Figure 3 is associated with the development of a wrinkle (buckling). Usually, these wrinkles develop sequentially from one end of a tube so that the phenomenon is known as progressive buckling.
In the used Riera formulation, the progressive dynamic buckling of the missile is taken into account with the crushing force value. The mean value of the crushing force Pm is used. Thus, the
Figure 3. Axial crushing behavior of a thin-walled mild steel circular tube. Axial force versus axial crushing distance
There are several formulations that may allow the estimation of the mean value of the crushing force (with buckling) of a thin-walled tube, e.g. Jones (1989). We should expect only a very small percentage of the total crushing force of the fuselage to participate (contribute) to the acting force at impact. On the contrary – the wings and the engine will participate with their full strength and only relatively small random variation of the crushing strength could be expected.
Our assumption for these analyses is that most probable crushing strength of the fuselage (considering buckling) is about 10% of the simple crushing strength determined by yield stress times the cross section with coefficient of variation 50%. The most probable crushing strength of the wings and the engines is assumed without reduction, i.e. 100% with variation 5%.
LHCED SIMULATION OF IMPACT FORCE
We use Riera’s formulation of the impact force assuming that mass, speed, and impinging force (mechanical strength of the aircraft) are log-normally distributed. The computational procedure is based on an advanced Monte Carlo method (Latin Hypercube) for simulation, Imam et al. (1981). The procedure consists of multiple deterministic analyses with input data sets that are prepared to represent (to match) the distribution of the input variables. We use 30 generations, i.e. there are 30 impact velocities, masses and strength generated that are randomly combined and evaluated.
As discussed above, the mass of the aircraft is presented by a constant part (dry operational weight) and a variable part (fuel and payload). There are discussions on how to use the mass for deceleration of the aircraft. Generally, only the structural mass may decelerate the aircraft while the fuel and the payloads will soon after impact detach and fly independently. Our analyses are showing that those effects are of minor importance for the overall impact force evaluation.
The impinging force is also varied differently for the fuselage and for wings and engines (the latter being varied only with 5%).
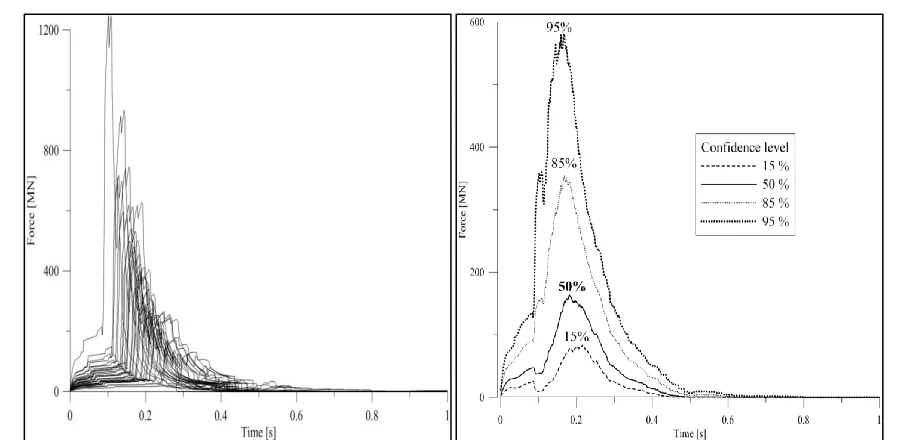
Figure 4. LHED 30 generated LTF for B747-400 Figure 5. LTF for B747-400 with different confidence levels
Each one of the shown LTFs are computed by the formulation of Riera with randomly generated and combined mass, impact speed and impinging force. The mean values and the variations of the LTF sample are determined for each time step of analysis. The LTF with different confidence levels shown in Figure 5 is generated assuming that the LTF values for each time step are log-normally distributed.
SENSITIVITY ANALYSIS
Our experience is that the sample size of 30 generation is sufficient to have stable results for mean and variation estimation. On Figure 6 results are shown for sample size generated with 40 and 50 LTF, respectively. The results presented there are stable and sufficient for an engineering application.
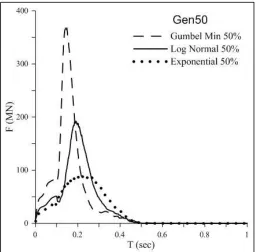
One major assumption made is the log-normal distribution of the speed at impact. As the speed of impact is of primary importance and influencing the impact force heavily, we have applied also exponential distribution and Gumbel I type (minima) distribution. The parameters of both distributions are estimated with boundary conditions that there is 99.9% chance for having impact speed higher than 80 m/s and only 0.1% chance for impacting speed higher than 260 m/s. We assume that those two distributions represent two bounding cases. The exponential distribution reflects the high confidence for success of impact at lower velocities. On the other edge is the Gumbel distribution that may represent the subjective effort for impact at highest possible speed but also the chance for missing the target at those high velocities. The results for the LTF with confidence level 50% are shown in figure 7. As expected, the highest loads are for the hypothesis of Gumbel I type distribution.
Figure 7. Sensitivity analyses: Comparison between LFT generated for Gumbel, log-normal and exponential distribution of the speed at impact.
CONCLUSION
We have shown that there are considerable uncertainties when assessing the impact force caused by the crash of a large commercial airplane on a rigid target. We studied three sources of variation, i.e. the mass, the structure strength and the speed at impact. Of the highest importance for the final assessment of the impact force is, logically, the speed at impact. Our analyses show that the values of the impact force with 50% confidence are less than 400 MN. The frequently used values for design of new containments are having confidence levels greater than 95%.
ACKNOWLEDGEMENT
The authors are thankful for the friendly technical assistance of Mrs. Nina Koleva and Mr. Ivaylo Klecherov.
These analyses have been performed with the partial financial support of the European Commission under Project “Risk Protection of Critical Infrastructure” – HOME/2010/CIPS/AG/045.
REFERENCES
Bower, D. R. (2002) “Radar Data Impact Speed Study; American Airlines Flight 11; United Airlines Flight 175”, National Transportation Safety Board, Washington.
FAA (2005) “Statistical Data for the Boeing 747-400 Aircraft in Commercial Operations”, U.S. Department of Transportation, Federal Aviation Administration, Final Report.
Iman, R. L., Helton. J.C. and Campbell J. E. (1981) “An approach to sensitivity analysis of computer models, Part 1. Introduction, input variable selection and preliminary variable assessment”, Journal
of Quality Technology 13 (3), 174–183.
Jones, N. (1989) “Structural Impact”, Cambridge University Press, 385-430.
Riera, J. D. (1968) “On the stress analysis of structures subjected to aircraft impact forces”, Nuclear
Engineering and Design, vol.8, 415-426.
(2002) “Flight Path Study – American Airlines Flight 77”, National Transportation Safety Board, Washington.