HIGHLIGHTED ARTICLE
| INVESTIGATION
Accurate Pro
fi
ling of Gene Expression and
Alternative Polyadenylation with Whole
Transcriptome Termini Site Sequencing (WTTS-Seq)
Xiang Zhou,*,1Rui Li,*,1Jennifer J. Michal,*,1Xiao-Lin Wu,* Zhongzhen Liu,†Hui Zhao,†Yin Xia,†
Weiwei Du,‡Mark R. Wildung,‡Derek J. Pouchnik,‡Richard M. Harland,§and Zhihua Jiang*,2
*Department of Animal Sciences and Center for Reproductive Biology, Washington State University, Pullman, Washington 99164-7620,†School of Biomedical Sciences, Faculty of Medicine, The Chinese University of Hong Kong,‡Laboratory for Biotechnology and Bioanalysis, Center for Reproductive Biology, Washington State University, Pullman, Washington 99164-7520, and §Department of Molecular and Cell Biology, University of California Berkeley, California 94720-3200
ORCID ID: 0000-0003-1986-088X (Z.J.)
ABSTRACTConstruction of next-generation sequencing (NGS) libraries involves RNA manipulation, which often creates noisy, biased, and artifactual data that contribute to errors in transcriptome analysis. In this study, a total of 19 whole transcriptome termini site sequencing (WTTS-seq) and seven RNA sequencing (RNA-seq) libraries were prepared from Xenopus tropicalisadult and embryo samples to determine the most effective library preparation method to maximize transcriptomics investigation. We strongly suggest that appropriate primers/adaptors are designed to inhibit amplification detours and that PCR overamplification is minimized to maximize transcriptome coverage. Furthermore, genome annotation must be improved so that missing data can be recovered. In addition, a complete understanding of sequencing platforms is critical to limit the formation of false-positive results. Technically, the WTTS-seq method enriches both poly(A)+ RNA and complementary DNA, adds 59- and 39-adaptors in one step, pursues strand sequencing and mapping, and profiles both gene expression and alternative polyadenylation (APA). Although RNA-seq is cost pro-hibitive, tends to produce false-positive results, and fails to detect APA diversity and dynamics, its combination with WTTS-seq is necessary to validate transcriptome-wide APA.
KEYWORDS39-termini sequencing; amplification detours; transcriptome distribution; missing data; Bayesian model
N
EXT-generation sequencing (NGS) technologies are used routinely for transcriptome investigation. Libraries for NGS can be prepared to sequence full transcripts or just their 59or 39ends depending on project goals (Jianget al.2015). RNA sequencing (RNA-seq) uses NGS to collect short reads that cover full transcripts (59to 39ends) (Morinet al.2008). Given current capabilities in gene expression profiling, splic-ing form detection, and expressed polymorphismcompila-tion, the method has gradually become the gold standard in transcriptome analysis (Wang et al. 2009; Wilhelm and Landry 2009; Costa et al.2010; Nagalakshmi et al.2010). However, the RNA-seq assay is not always cost-effective be-cause random sequencing of full-length transcripts is not nec-essary to determine gene abundance. In addition, short reads generated by RNA-seq might make it difficult to reconstruct full-length isoforms of transcripts (Steijgeret al.2013). Fur-thermore, profiling alternative transcript ends is problematic because 59- and 39-end biases are introduced during RNA-seq library preparation (Wang et al. 2009; Jiang et al. 2015). However, profiling only the 59ends of transcripts is not fea-sible because the library preparation involves many steps, which increases the possibility of errors (Takahashiet al.2012).
As such, effort has been focused largely on the development of methods to profile 39ends of transcripts. Functionally, the 39-untranslated regions (UTRs) are important because they Copyright © 2016 by the Genetics Society of America
doi: 10.1534/genetics.116.188508
Manuscript received February 21, 2016; accepted for publication March 17, 2016; published Early Online April 18, 2016.
Available freely online through the author-supported open access option.
Supplemental material is available online atwww.genetics.org/lookup/suppl/doi:10. 1534/genetics.116.188508/-/DC1.
1These authors contributed equally to this work.
2Address for correspondence: Department of Animal Sciences and Center for
harbor regulatory elements that play essential roles in the stabilization, localization, translation, and degradation of messenger RNA (mRNA) (Matoulkovaet al.2012). Techni-cally, the poly(A) tails are used frequently in reverse tran-scription to convert RNA to complementary DNA (cDNA) that can be sequenced. The 39-termini of transcripts have been collected in two ways: by digestion of mRNA with re-striction enzymes and by random fragmentation. The reverse serial analysis of gene expression (rSAGE) technique (Richards
et al.2006) and the poly(A) tags (PATs) (Wuet al.2011) with restriction endonuclease cut are two examples of the former strategy. There are several challenges associated with these methods (Jianget al.2015). None of the currently available restriction endonucleases can effectively fragment an entire transcriptome because some transcripts may lack recognition sites. To overcome this limitation, the PATs with restriction endonuclease cut method incorporates a specific enzyme rec-ognition site into cDNA and ensures that every transcript can be cut by a distinct restriction enzyme. Unfortunately, this strategy also may increase the length of some products, which can subsequently decrease PCR amplification effi -ciency and introduce artificial biases in whole transcriptome profiling (Jianget al.2015).
As for profiling 39-termini using random fragmentation, the 39 poly(A) site mapping using cDNA circularization (3PC) (Mata 2013), 39-region extraction and deep sequenc-ing (39READS) (Hoqueet al.2013), and PATs with RNA frag-mentation methods (Maet al.2014) all enrich fragmented poly(A)+ RNA, while the 39T-fill (Pelechano et al. 2012; Wilkeninget al.2013) and expression profiling through ran-dom sheared cDNA tag sequencing (EXPRSS) techniques (Rallapalliet al.2014) enrich fragmented cDNA. In compar-ison, the poly(A) site sequencing (PAS-seq) (Shepard et al.
2011; Yao and Shi 2014) and polyadenylation sequencing (PolyA-seq) approaches (Derti et al. 2012) use custom oligo(dT) primers to collect and sequence 39-termini regions. These poly(A) site sequencing methods are not without drawbacks. When Maet al.(2014) compared three different methods, for example, they found that 47.2–98.2% of reads could not be mapped to the 39-UTRs.
The aforementioned difficulties in producing clean, usable data from NGS platforms clearly provide evidence that library construction for 39-termini sequencing methods can and should be improved. In this study, we developed a procedure that we call whole transcriptome termini site sequencing
(WTTS-seq). Our WTTS-seq approach starts with total RNA, followed by chemical fragmentation and enrichment of both poly(A)+ RNA and poly(A)+ cDNA. During assay development, we tested three types of primers used in PCR for synthesis of second-strand cDNA to complete construction of the NGS libraries. We found that primer design is a very important factor for accurate coverage of the entire transcrip-tome. By using poly(A)-anchored primers, we reduced noisy data to,0.1%. We also discovered that reduced PCR cycle numbers and lower primer concentrations improved tran-scriptome coverage. Moreover, we analyzed the same
sam-ples using traditional RNA-seq and examined WTTS-seq data of biological and technical replicates to reveal their strengths and weaknesses. Overall, our WTTS-seq method successfully collected poly(A) sites as signatures for global profiling of gene expression and examination of APA with one pipeline.
Materials and Methods
Experimental design
Animals and RNA extraction: Three adult male and three adult female frogs (Xenopus tropicalis) (.6 months of age)
were purchased from Nasco (Fort Atkinson, WI). Immedi-ately on arrival, frogs were humanely killed, rinsed briefly with deionized water, wrapped in aluminum foil, immersed in liquid nitrogen until all tissues were completely frozen, and stored at280°. Later the frogs were removed from stor-age and placed in a bath of liquid nitrogen, and tissues were broken into smaller pieces with a hammer. All tissue pieces were kept in liquid nitrogen and subsequently ground into a powder with a mortar and pestle. Ground tissues were thoroughly mixed, and a subsample was removed for total RNA extraction with Trizol reagent according to the manu-facturer’s instructions. Contaminating DNA was removed by treating total RNA with DNase (AM1906, Ambion). RNA quantity and quality were assessed by NanoDrop spectropho-tometer (Thermo Scientific, Wilmington, DE) and nondena-turing agarose gel electrophoresis, respectively. Equal amounts of total RNA from each frog were subsequently pooled and used for RNA-seq and WTTS-seq. In addition, total RNA from one of the female frogs was used as a technical replicate to test the variability of our WTTS-seq method.
WTTS-seq assay development:We conducted seven trials to develop and improve our WTTS-seq method. As shown in Supplemental Material,File S1A, these trials mainly differed in (1) primers [OP, outer primer; IP, ion primer; and PAAP, poly(A)-anchored primer], (2) number of cDNA synthesis runs (twovs. one run) and PCR cycles (variable), (3) size selection (variable), and (4) amount of total RNA starting material (10, 5, or 2mg). Oligo(dT20) was used only in trial
1, while the remaining trials used oligo(dT10) for reverse
transcription. Oligo sequences are listed inFile S1B.
RNA. The poly(A)+ RNA was eluted from the oligo(dT) cel-lulose with an aliquot of the warm solution provided with the kit. A second round of oligo(dT) selection was subsequently performed, and poly(A)+ RNA was recovered by precipita-tion, as described previously. Thefinal poly(A)+ RNA pellet was resuspended in the solution provided with the kit. An RNA-seq library was constructed using the Ion Total RNA-Seq Kit v2 (Thermo Fisher Scientific) and sequenced on the Ion PGM Sequencer at Washington State University.
Five stages of X. tropicalis embryos as biological repli-cates:X. tropicalisembryos were produced using two pairs of parents at The Chinese University of Hong Kong to test the repeatability of our WTTS-seq method. The embryos were cultured in 0.13MMR at 25°and staged according to Khokha
et al.(2002). Fifty embryos were collected and pooled from each parent family at stages 6 [before midblastula transition (MBT)], 8 (during MBT), 11 (gastrula), and 15 (neurula), while 30 embryos per family were pooled at stage 28 (tailbud). Once collected, these samples were immediately stored in 5 ml of Trizol reagent and then delivered directly to the Beijing Genome Institute (BGI), Hong Kong, for RNA extrac-tion and quality control. RNA-seq libraries were prepared at BGI with in-house kits from 6 of the 10 pooled embryo sam-ples and sequenced on an Illumina HiSeq 2000 with single 50-bp reads. All 10 pooled embryo samples also were used to construct WTTS-seq libraries by the Jiang Laboratory, which were sequenced on the Ion PGM Sequencer at Washington State University.
WTTS-seq library preparation
Fragmentation of total RNA and enrichment of poly(A)+ RNA:The required amount of DNase I–treated total RNA (File S1A) was removed from storage at280°and diluted to 9ml with DNase/RNase-free water. Then 1ml of 103RNA frag-mentation buffer (AM8740, Ambion) was added, and the sample was mixed and incubated for 15 min at 70°. The fragmentation reaction was terminated by adding 1ml of stop solution (AM8740, Ambion), and the mixture was placed on ice until use. Next, Dynabeads Oligo(dT)25(75mg of beads;
61002, Ambion) were washed and prepared according to the manufacturer’s instructions. The fragmented total RNA was heated to 65°for 2 min to disrupt secondary structures, im-mediately placed on ice, added to the washed Dynabeads, and mixed thoroughly. The mixture then was rotated contin-uously for 5 min at room temperature to allow binding of the poly(A)+ RNA to the beads. Bead-bound poly(A)+ RNA was eluted with 10ml of elution buffer (10 mM Tris-HCl, pH 7.5) as directed. The sample was incubated with Dynabeads an additional 5 min and eluted as described earlier to further enrich poly(A)+ RNA. The concentration of fragmented poly(A)+ RNA was measured with a NanoDrop spectropho-tometer (Thermo Scientific, Wilmington, DE).
Incorporation of 59- and 39-adaptors intofirst-strand cDNA with reverse transcription:Fragmented poly(A)+ RNA was
mixed with 1 ml each of 59-adaptor (switching primer, 100mM) and 39-adaptor [containing oligo(dT10), 100mM]
(File S1B). The mixture was heated at 65° for 5 min and chilled on ice for 2 min to disrupt RNA secondary structure and repeated. After that, 4ml of 53First-Strand Buffer, 2.5ml dNTPs (10 mM), 1 ml DTT (0.1 M), 1 ml RNase OUT (100 units/ml), and 1 ml SuperScript III Reverse Transcrip-tase (200 units/ml) (18080, Invitrogen) were added and the mixture incubated at 40°for 90 min. The reverse transcrip-tion reactranscrip-tion was terminated by heating the mixture to 70° for 15 min.
Optimization of second-strand cDNA synthesis by PCR: First-strand cDNA was used as a template to synthesize second-strand cDNA. Base PCR conditions were initial de-naturation at 98°for 30 sec; PCR cycles of 98°for 10 sec, 50° for 30 sec, and 72°for 30 sec; andfinal extension at 72°for 10 min. The total PCR volume was 50ml and contained size-selected cDNA-RNA, DNase/RNase-free water, 53HF buffer, forward and reverse primers, dNTPs, and Phusion DNA Po-lymerase (M0530, New England Biolabs). Specific sizes of first- or second-strand cDNA fragments were selected by ex-cision from agarose gels after electrophoresis or with solid-phase reversible immobilization beads (AMPure XP; A63880, Beckman Coulter). Final library quality determined the best preparation method and led to our conclusive procedures for WTTS-seq library construction, as shown in Figure 1.
Data analysis
Read processing: We trimmed all T nucleotides or T-rich stretches located at the 59end of each WTTS-seq raw read using in-house scripts (File S1C), as described by Shepardet al.
(2011), but with modification. After T-trimming, sliding-window quality trimming was performed with Trimmomatic-0.33 (Bolgeret al.2014). Window size was set to 4 bp, and the minimum average quality score was set to 10. Next, only clean reads with sizes$16 bp were retained for further anal-ysis (File S1A). While the T-trimming step was not conducted on RNA-seq reads, quality trimming was performed in the same manner.
X. tropicalis genome reference preparation: X. tropicalis
genome with the parameters –min-trimmed-coverage=0.8– min-identity=0.95 (Wu and Watanabe 2005). The mapping result was transformed into Gene Transfer Format (GTF) with script written in Perl, resulting in afile named mRNA.gtf. Sec-ond, the GTFfile was combined with the Xentr7_2_Stable.gff3 annotationfile, and a new genome annotationfile (combined. gtf) was generated using Cuffmerge (Trapnell et al. 2012). Sequences in the combined.gtffile were then annotated with Cuffcompare (Trapnellet al.2012) based on information from the Xentr7_2_Stable.gff3 and mRNA.gtffiles. These data are shown inFile S2.
Read mapping:The CLC Genomics Workbench, v8.0.1 (CLC bio, a QIAGEN Company, Boston, MA), was used to process both WTTS-seq and RNA-seq data for read mapping and gene expression quantification. The workflow is illustrated inFile S3A. Reads were first mapped to the X. tropicalis genome assembly (v7.1). The combined.gtffile described earlier then was used as reference for gene annotation with Joint Genome Institute (JGI) Gene_IDs as well as with NCBI gene symbols. After nuclear genome mapping, unmapped reads were aligned to the mRNA sequences described earlier. Finally, all remaining unassigned reads were used as inputs for ade novo assembly. Read mapping parameters were set to 95% similarity and 80% coverage for thefirst two mapping steps, while 92% similarity and 50% coverage were used as criteria for thede novoassembly step.
Gene annotation and quantification:Genome and mRNA mapping results were combined to improve both the annota-tion rate of clean reads and quantification of gene expression. When reads were mapped to the nuclear genome, we calcu-lated“unique gene reads”for each Gene_ID. In order to an-notate NCBI mRNA sequences with Gene_ID, they were first mapped to the nuclear genome with GMAP (Wu and Watanabe 2005) and then annotated to sequences in the combined.gtffile using the tmapfile generated by Cuffcompare (v2.2.1) (Trapnell et al. 2012) and Perl scripts. Afinal gene
expression value was calculated by combining genome and mRNA gene expression data based on Gene_ID.
Estimation of gene expression means: Gene/locus expres-sion was either quantified as a raw count of reads expressed or adjusted as reads per million (RPM). The former measure-ment was used to count the number of genes with evidence of at least one read, whereas the latter served as expression levels for determination of minimum cutoff points. However, counts are intrinsically linked to the library (status) size, which are not exactly comparable, and on the laboratory-observable scale, detecting no sequence (i.e., frequency rate = 0) for a specific gene does not necessarily indicate that its expression level is truly zero. Hence, to bypass this“frequentist dilemma,” the underlying expression mean of each gene was estimated with a Bayesian model setting. Let xi be a count of reads
expressed, say, in theith sample (or statuses), fori¼1;. . .;K, where K is the total number of samples (or statuses). This gene expression can be modeled as a Poisson event (variable)
pðxijliÞ ¼l xie2li
xi!
(1)
where the parameterliis a positive integer that corresponds
to the expectation and variance of the variablexi. Under the
heterogeneity assumption (m16¼m2 6¼⋯6¼mK), each gene
expression has its own intrinsic mean. Letli¼Nimi, where
miis the unobservable gene expression mean. Then Equation
1 can be rearranged as
pðxijmiÞ}ðmiÞxie2Nimi
In the Bayesian inference, a gamma prior distribution formiis
assumed: pðmiÞ ¼Gammaða;bÞ, where a and b are two
hyperparameters with their values given arbitrarily. It can be shown that the posterior distribution ofmiis also gamma:
pðmijxiÞ}ðmiÞxie2Nimi3ðmiÞða21Þe2bmi }Gammaðaþxi;bþNiÞ
Figure 1 Illustration of ourfinalized WTTS-seq library preparation procedures. Total RNA serves as the start-ing material, followed by fragmentation and poly(A)+ RNA enrichment. Reverse transcription synthesizes the
and the posterior mean and variance are given as
EðmijxiÞ ¼ aþ
xi
bþNi
VðmijxiÞ ¼ aþxi
ðbþNiÞ2
Under the homogeneity assumption (m1 ¼m2¼⋯¼mK¼m),
a common overall meanmcan be inferred instead by pooling the counts of all the samples:
pðmjx1;x2;. . .;xKÞ}pðx1;x2;. . .;xKjmÞpðmÞ
GammaaþX K
i¼1
xi;bþX
K
i¼1
Ni
and
Eðmjx1;x2;. . .;xKÞ ¼
aþX
K
i¼1
xi
bþX
K
i¼1
Ni
Vðmjx1;x2;. . .;xKÞ ¼
aþX
K
i¼1
xi
bþX
K
i¼1
Ni
!2
The edgeR program (Robinsonet al.2010) was used to de-termine the number of differentially expressed genes (DEGs) in embryos at different developmental stages. Genes with greater than twofold changes were classified as upregulated genes, while genes with fold changes that were less than22 were designated as downregulated genes. An online Venn diagram tool (http://bioinformatics.psb.ugent.be/webtools/ Venn/) was used to draw Venn diagrams.
Data availability
The raw WTTS-seq and RNA-seq data for this study have been submitted to the NCBI Gene Expression Omnibus (GEO) (http://www.ncbi.nlm.nih.gov/geo/) under accession no. GSE74919. The authors state that all data necessary for con-firming the conclusions presented in the article are repre-sented fully within the article.
Results
A brief workflow of WTTS-seq
Our WTTS-seq library preparation involved four major steps: fragmentation, poly(A)+ RNA enrichment,first-strand cDNA synthesis by reverse transcription, and second-strand cDNA synthesis by PCR (Figure 1). We conducted seven trials, but they were not initially designed based on any prior knowledge.
In fact, techniques gradually evolved to solve problems with library quality and quantity. Library preparation conditions, read mapping outputs, and transcriptome parameters and coverage for each trial are listed inFile S1A. By merging both theX. tropicalisgenome assembly (v7.2) and the NCBI mRNA entries (58,275 as of August 27, 2015), the Cuffmerge pro-gram (Trapnellet al.2012) identified a total of 27,836 loci (File S2), which served as a reference of genes/transcripts for all data analyses in this study.
Primer types and troubleshooting
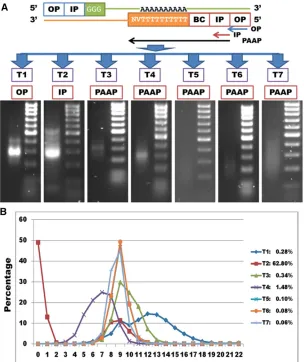
In trial 1, a library with afinal concentration of660 ng was constructed by PCR using OPs (Figure 2A andFile S1B), but a regular full Ion PGM Sequencer run in which 50–100 pg was loaded generated only 13,309 reads. As such, two more runs were conducted, yielding 31,186,220 raw reads from the entire library (File S1A). A good library preparation should generate an average of 60–80 million reads per regular run. The low yield of reads indicated that most constructs gener-ated with OP lacked an Ion adaptor sequencing region.
The library in trial 2 used IPs (File S1B) with two rounds of PCR including 20 and 35 cycles, respectively, to increase read yield. This library had an adequate number of constructs (Figure 2A), and thus two regular, full Ion PGM Sequencer runs yielded 141,543,418 raw reads (File S1A), which im-plied that the IPs significantly enhanced sequencing effi -ciency. However, at least 49% (69,361,559/141,543,418) (Figure 2B) of the raw reads had no T’s at the 59ends, in-dicating that they were spurious products.
The library in trial 3 was constructed with PAAPs (File S1B) and reduced PCR cycles (2 and 20 in rounds 1 and 2, respec-tively) to minimize amplification of specious products. An initial survey of the data showed that 99.66% of the raw reads started with four or more T’s (Figure 2B), indicating that PAAPs efficiently anchored the poly(A) sites. However, read mapping revealed only 14,905 loci with evidence, which was fewer than the 15,961 and 19,242 loci discovered in trials 1 and 2, respectively (File S1A).
PCR runs and troubleshooting
To address the low transcriptome coverage issue encoun-tered in trial 3, the library in trial 4 was constructed with one round of PCR with 25 cycles and the forward and reverse primer concentrations reduced from 25 to 5mM and from 25 to 2.5mM, respectively (File S1A). These modifications led to discovery of 17,289 loci with evidence and 15,544 loci with RPM$0.2, which was a significant improvement in transcriptome coverage compared to trial 3 (14,905 loci with evidence and 11,118 loci with RPM$0.2) but notably lower than coverage in trial 2 (19,242 loci with evidence and 16,679 loci with RPM$0.2) (File S1A).
improved transcriptome coverage (19,695 loci with evidence and 17,339 loci with RPM$0.2).
The same strategy then was applied to library construction in trials 6 and 7, which examined the effects of less total RNA and different product size-selection methods on transcrip-tome coverage (File S1A). In both trials, 2mg of total RNA was used to prepare libraries. First-strand cDNA products between 200 and 500 bp were selected by excision after gel electrophoresis, and second-strand cDNA products between 200 and 500 bp were selected with SPRI beads in trial 6. First-and second-strFirst-and cDNA products between 200 First-and 500 bp were selected with SPRI beads in trial 7, which resulted in a library with the best transcriptome coverage: 20,690 loci with evidence and 17,740 loci with RPM $0.2 (File S1A). Therefore, procedures used in trial 7 were adopted as our finalized WTTS-seq library preparation method and used in technical and biological replicate tests.
IPs and noisy/biased reads
In this study,“noisy”reads were defined as reads that were not derived from the 39-end regions, while “biased”reads were overamplified 39-end reads. There were 15 and 8 genes
in trial 2 that produced the majority of noisy and biased reads, respectively, which accounted for 89.4% of the total mapped reads (File S4). In contrast, reads for the same set of genes accounted for only 0.72% (159,428/21,772,746) of the total mapped reads in trial 7 (File S4). Inclusion and exclusion of these noisy/biased reads in trial 2 significantly influenced transcriptome coverage: 11,073 and 16,679 loci, respectively, with RPM$0.2 (File S1A).
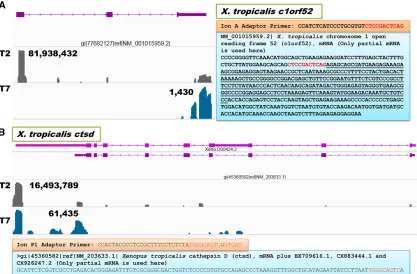
Of the 15 genes in trial 2 that produced noisy reads, 14 are well annotated in the currentX. tropicalisgenome assembly (v7.1) (File S4). Examination of sequence features revealed that half these genes had 8–12 internal nucleotide sequences identical to the Ion A Adaptor or the sequencing primer (59-CCA TCT CAT CCC TGC GTG TCT CCG ACT CAG-39), and the remaining genes contained mismatched sequences. The X. tropicalis c1orf52gene is shown in Figure 3A to explain how noisy reads were generated. All eight genes with biased reads were created because they had internal nucleotide sequences that were highly similar to the Ion P1 Adaptor (59-CCA CTA CGC CTC CGC TTT CCT CTC TAT GGG CAG TCG GTG AT-39). TheX. tropicalis ctsd(cathepsin D) gene is illustrated in Figure 3B as an example of a gene that produced biased reads in trial 2.
Figure 2Effect of adaptor design used for synthesis of second-strand cDNA in seven trials (T) on library quality and number of T nucleotides at the beginning of raw reads. (A) Adaptor design included OP (outer primer), IP (ion primer), BC (barcode), and PAAP [poly(A)-anchored primer] regions. T1 used OPs, T2 used IPs, and T3–T7 tested PAAPs in PCR reactions. Gel images are shown for library outputs (from concentrated bands to smooth distributions). Ladder was the ACTGene DNA marker 100 bp, including 100, 200, 300, 400, 500, 600, 700, 800, 900, and 1000 bp, respectively. (B) Poly(T) length distributions at the beginning of raw reads are plotted for T1–T7. Only T1 used an adaptor containing oligo(dT20)
rather than oligo(dT10) for synthesis of thefirst-strand
Library size selection and read length distribution
Product size selection (200–300 bp in trial 1, 300–500 bp in trial 2, 250–450 bp in trials 3 and 4, and 200–500 bp in trials 5–7) was not uniform among the seven trials (File S1A). We observed that library product sizes were not necessarily as-sociated with read sizes compiled by the Ion PGM Sequencer (File S3B). Based on clean reads ($16 bp in length), we found that size distribution patterns were similar among tri-als, with the exception of trial 2 (File S3B). As described earlier, trial 2 had a few significant noisy and biased reads, which contributed to a high proportion of large fragment sizes.
RNA-seq and technical replicate tests
Gene abundances in the pooled total RNA sample also were profiled by RNA-seq. After data were normalized with the Bayesian model, we observed that the standard errors (SEs) for WTTS-seq trials 6 and 7 were similar but slightly higher (1.24- and 1.33-fold, respectively) than the SEs observed in the RNA-seq analysis (File S1A). In trials 1 and 5, SE esti-mates were 2.07- and 2.51-fold greater in WTTS-seq libraries than in RNA-seq libraries. In comparison, SEs in WTTS-seq libraries from trials 2–4 were 16.05-, 13.61-, and 11.48-fold
higher, respectively, than SEs observed in RNA-seq, reflecting the noisy and biased data and PCR overamplification issues observed earlier. Despite the differences in transcriptome var-iations, Spearman’s rank correlations of estimated locus ex-pression means between WTTS-seq trials and the RNA-seq library were well retained (File S3C). In particular, trial 7 had the highest Spearman’s rank correlation (r= 0.912) with the RNA-seq data set when all 27,836 loci were involved in the calculation.
Here we focus on a comparison between trial 7 and RNA-seq data sets. Both revealed that at least 2751 of 27,836 reference loci were not expressed in the pooled sample (File S1E). The trial 7 library had 7345 loci expressed at levels of 0#RPM,0.2. Of these, 4694 (63.9%), 2454 (33.4%), and 197 (2.7%) were present at levels of 0#RPM,0.2, 0.2# RPM,10, and 10#RPM,250 in the RNA-seq data set, respectively. These results indicated that an RNA-seq library with over 100 million reads improves the likelihood that transcripts with low expression levels are detected. Actually, the same principle also can be applied to WTTS-seq libraries. When we combined reads from all seven trials, the number of loci detected with evidence increased from 20,690 with evi-dence and 17,740 with RPM$0.2 (trial 7 alone) (File S1A) to 22,889 with evidence and 21,002 with RPM$0.2 (sum of
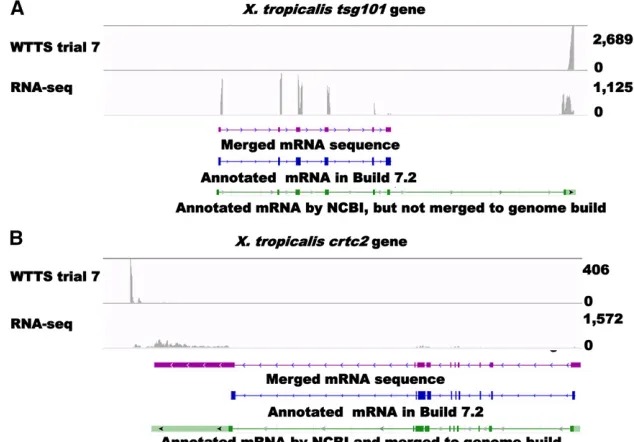
all 7 trials) (File S5). However, 452 loci expressed at RPM$ 0.2 were detected in the trial 7 WTTS-seq library but were expressed at RPM,0.2 in the RNA-seq analysis (File S1E). We selected 37 genes (File S6) to determine why we found significant discrepancies in gene expression between libraries created by WTTS-seq and RNA-seq methods. Of these genes, 33 were expressed at 50#RPM,250 in RNA-seq but at 0# RPM , 0.2 in WTTS-seq (trial 7). These differences were caused by problems related to either incomplete genome se-quencing/assembly (17 genes) or incomplete transcriptome annotations (16 genes) (File S6). The X. tropicalis tsg101
(Xetro.K02827 and NM_203935.1) andcrtc2(Xetro.K02136) (File S1F) genes are illustrated in Figure 4, A and B, to explain how genes can be detected in an RNA-seq library but missed in WTTS-seq libraries.
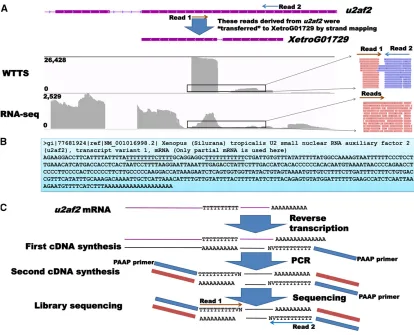
Among 37 genes, four genes were expressed at 50 # RPM,1100 in WTTS-seq but 0#RPM,0.2 in RNA-seq owing to the artifacts produced during preparation of the WTTS-seq libraries (File S6). These artifacts were caused by overlapping loci oriented in opposite directions. The over-lapped regions contained poly(T) stretches that were con-verted to poly(A) stretches after reverse transcription that were subsequently targeted by PAAPs. Different anchored PAAPs amplified those regions for sequencing because the sequencing primer was included at both 59and 39ends of the amplified products (Figure 5). After strand mapping, the reads were assigned to the overlapped genes without expres-sion rather than to those with expresexpres-sion. These cases oc-curred only with the overlapped genes in the WTTS-seq library but not in the RNA-seq analysis.
We also tested the repeatability of ourfinalized WTTS-seq protocol by preparing two technical replicates (rep 1 and rep 2) with a total RNA sample derived from a female frog. The
replicates had different numbers of mapped reads: 11,403,853 for rep 1 and 22,287,985 for rep 2, representing 19,278 and 20,967 genes with evidence, respectively (File S7). Of these, 16,681 and 17,311 loci in rep 1 and rep 2 were retained, re-spectively, when RPM$0.2. Although the number of reads in rep 2 was almost twofold higher than the total reads collected in rep 1, the number of genes with evidence and RPM$0.2 in-creased by 1689 and 630, respectively. As such, the replicates had a Spearman’s rank correlation of 0.965, indicating that our method is very reproducible and stable (File S3C).
Biological replicate test
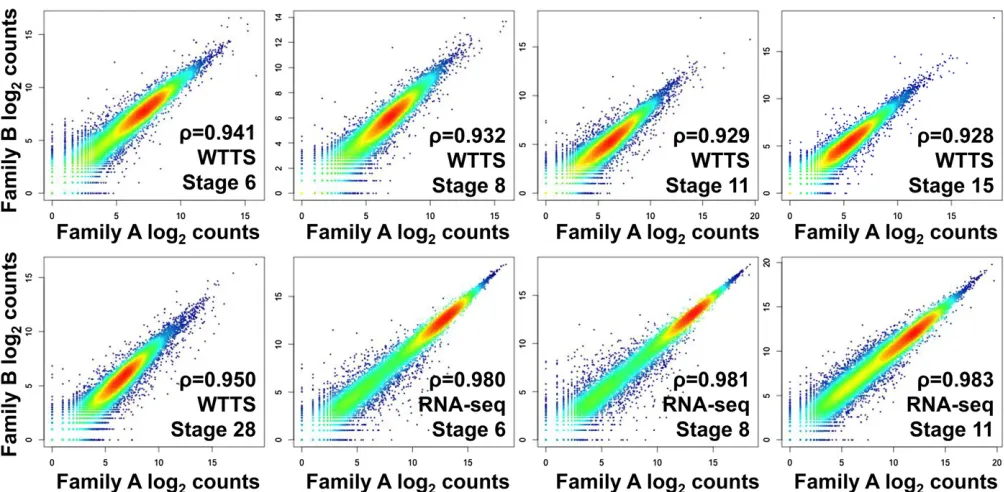
Ten pooled embryo samples ofX. tropicalisfrom two families representingfive developmental stages (6, 8, 11, 15, and 28) served as biological replicates in this study. For comparison, we also downloaded publicly available RNA-seq data for five similar developmental stages collected on an Illumina platform (NCBI Gene Expression Omnibus accession no. GSE37452) (Tanet al.2013). Total raw reads, clean reads, combined mapped reads with annotation, numbers of genes with evidence and with RPM$0.2, and transcriptome means and SEs are summarized inFile S1G. The number of genes detected with evidence ranged from 17,074 to 19,641 in our WTTS-seq libraries, from 20,599 to 23,400 in our RNA-seq libraries, and from 14,283 to 19,307 in Tan’s RNA-seq libraries. These results clearly indicated that the number of genes detected with evidence is highly correlated with the number of reads collected per library. However, when RPM$0.2 was employed, the number of genes collected de-creased to 17,074–19,002, 14,570–17,979, and 12,980–17,708 for these three data sets, respectively. Further, Spearman’s rank correlations between replicates at allfive stages ranged from 0.928 to 0.950 for WTTS-seq libraries (Figure 6). In
comparison, the Spearman’s rank correlations between rep-licates of the first three stages were greater than 0.980 for RNA-seq libraries (Figure 6).
The number of DEGs in embryos at different developmen-tal stages was determined in both WTTS-seq and RNA-seq data sets with the edgeR program (Robinsonet al.2010) (File S3D, A–I). No DEGs were detected between stages 6 and 8, but 1094 and 890 DEGs were found between stages 6 and 11 and between stages 8 and 11, respectively, in the WTTS-seq data sets (Bonferroni adjustedP,0.05;File S3D, J). The numbers of DEGs between other pairs of stages also were compared and are presented inFile S3D, J. Only three DEGs were detected between stages 6 and 8. However, between stages 6 and 11 and between stages 8 and 11, the numbers of DEGs increased dramatically to 4811 and 4662 (Bonferroni adjustedP,0.05), respectively, in RNA-seq data sets. When pairwise data were combined, the WTTS-seq libraries con-tained 1158 DEGs, while the RNA-seq libraries had 5204 DEGs among the first three stages (File S3D, K). As such, 111 DEGs were exclusively identified by the former method,
while 4157 DEGs were revealed by the latter method alone. Both methods shared a common set of 1047 DEGs, account-ing for over 90% of total WTTS-seq DEGs but only approxi-mately 20% of total RNA-seq DEGs (File S3D, K).
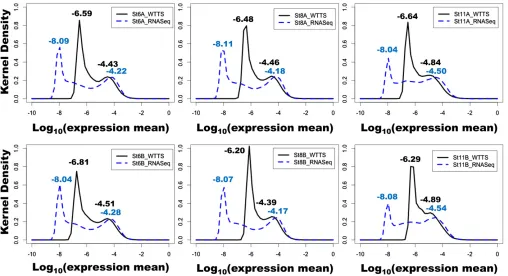
Why RNA-seq detected so many more DEGs than WTTS-seq prompted further investigation. As shown inFile S8, the transcriptome means normalized by the Bayesian model were not dramatically different between WTTS-seq and RNA-seq data sets for embryos of two families at stages 6, 8, and 11. In contrast, the distributions of gene expression means were distinct (Figure 7). Kernel density plots clearly indicated that RNA-seq analysis resulted in much wider tran-scriptome distributions than WTTS-seq analysis. For RNA-seq data sets, the distances between abundantly and rarely expressed gene peaks spanned 3.54–3.93 log10units (gene
expression means). However, the same distances only varied from 1.40 to 2.30 units in WTTS-seq data sets (Figure 7). These results imply that the greater the distance between peaks, the greater is the chance that upregulated or down-regulated genes reach statistical significance.
We also examined potential relationships between tran-script length and number of detectable DEGs, particularly associated with RNA-seq analysis. We focused on four sets of genes: 27,836 loci representing the wholeX. tropicalis tran-scriptome, 111 DEGs exclusively identified by WTTS-seq, 4157 DEGs exclusively collected by RNA-seq, and 1047 DEGs commonly discovered by WTTS-seq and RNA-seq (File S3D, B). Kernel density plots against transcript lengths clearly in-dicate that the length distributions of 111 DEGs detected by WTTS-seq and the whole transcriptome of 27,836 loci were similar, while DEGs detected by RNA-seq tended to be longer transcripts (File S3E). This provided evidence that expres-sion levels of longer transcripts are somehow magnified by RNA-seq analysis. Such magnification even made it possible for RNA-seq to predict 1106 DEGs that were detected by WTTS-seq with data derived from the developmental stages 15 and 28 (File S3D, K).
As shown inFile S3D, B, WTTS-seq uniquely revealed 111 DEGs inX. tropicalisembryos from stages 6–11. Examination of the data set helped us to classify these DEGs into three major groups based on transcript properties. First, WTTS-seq can detect alternative poly(A) sites with different abundance levels that are specific to developmental stages (see an ex-ample in Figure 8). Second, unlike RNA-seq, WTTS-seq was able to detect short-transcript DEGs. Because RNA-seq is gen-erally biased against both 59and 39ends (Wanget al.2009), the numbers of reads for short transcripts are most likely underrepresented in an RNA-seq library (see an example in Figure 9). Third, overlapping genes complicate RNA-seq read mapping. Currently, the Illumina RNA-seq platform pro-duces pair-end (PE) reads in one amplicon. Without strand
restriction, PE reads derived from overlapped genes cannot be mapped correctly. However, this problem does not exist in WTTS-seq because all reads start from the 39end of the tran-script (see an example in Figure 10).
Discussion
Basic features of thefinalized WTTS-seq method
WTTS-seq enriches both poly(A)+ RNA and poly(A)+ cDNA: Currently available 39-end sequencing methods en-rich either poly(A)+ RNA or poly(A)+ cDNA during library preparation (Pelechano et al. 2012; Hoque et al. 2013; Wilkeninget al.2013; Mata 2013; Maet al.2014; Rallapalli
et al. 2014). In our WTTS-seq assay, poly(A)+ fragments were enriched using oligo(dT25) beads (Figure 1). After first-strand cDNA synthesis, we removed single-stranded RNAs and RNA-DNA hybrids with RNases I and H. Second-strand cDNA was made during PCR using the PAAP. As such, ourfinalized WTTS-seq method involves enrichment of both poly(A)+ RNA and poly(A)+ cDNA (Figure 1). Unlike the poly(A) tail length profiling by sequencing (PAL-seq) method (Subtelny et al. 2014), our WTTS-seq technique was not designed to measure the length of poly(A) tails.
WTTS-seq simultaneously adds full-length 59- and 39 -adaptors: Generally speaking, reverse transcription and ligation are the two strategies employed to add 59- and 39-adaptors to library constructs. Internal priming issues may be responsible for up to 12% of the noisy data encountered in libraries prepared with the former strategy (Nam et al.
Figure 6 Biological replicate test. Spearman’s rank correlations of WTTS-seq between estimated log2counts in embryos collected from family A and
family B atfive developmental stages (6, 8, 11, 15, and 28) and RNA-seq between estimated log2counts in embryos collected from family A and family B
2002). To overcome this problem, a long oligo(dT20) primer
was recommended (Shepard et al. 2011); however, others found the long-T stretch caused problems in the sequencing reaction (Wilkeninget al.2013). When libraries are sequenced with the Ion Torrent platform in particular, long homopoly-mers may increase the deletion error rate (Laehnemannet al.
2016). Ligation could successfully avoid internal priming (Janet al.2011; Hoqueet al.2013), but reaction efficiency and time required for the process can be challenging. As shown in Figure 1, we adapted the former strategy in our library preparation but used a short oligo(dT10) primer.
We are currently reviewing the data generated in this study to further examine internal priming issues related to our WTTS-seq method.
WTTS-seq directs 39-end sequencing: In this study, the WTTS-seq libraries were sequenced with an Ion PGM Se-quencer. As shown inFile S1B, the reverse transcription adap-tor included the Ion Torrent read sequence, a barcode sequence, and dT10VN. This design directed sequencing of
the 39 ends of transcripts because the adaptor anchored poly(A) junction sites. For instance, more than 99.9% of the reads derived from the trial 7 library began with four or more T’s (Figure 2B). Care must be taken to avoid creation of a“low-diversity library”when Illumina platforms are used for sequencing because they require libraries with equal propor-tions (25%) of A, C, G, and T at each base position (http:// www.illumina.com/). Certainly, there are several strategies to ensure that a library will meet the Illumina requirements,
such as using a custom primer for sequencing (Shepardet al.
2011; Derti et al. 2012; Yao and Shi 2014) or filling the T-stretch before sequencing (Pelechanoet al.2012; Wilkening
et al.2013). In comparison, the Ion PGM Sequencer has no requirements for library diversity.
Transcriptome analysis: challenges
There are two types of amplification detours:In this study, we observed that inappropriate primer design resulted in both recessive and dominant “amplification detours” that pro-duced noisy and biased reads. The recessive amplification detour occurred in the trial 1 library that was prepared with OPs, while the dominant detour occurred in the trial 2 library that was constructed with IPs. A noisy read issue also was reported by Ma et al. (2014) and Shepard et al. (2011). Therefore, ourfinalized method used adaptors that contain an IP region with a buffer zone added to the 59-adaptor and a barcode (BC) + a PAAP region added to the 39-adaptor to minimize both noisy and biased reads.
Overamplification of sequencing libraries may reduce transcriptome coverage: Generally speaking, preparation of NGS libraries involves either exponential or linear ampli-fication (Tanget al.2009; Gertzet al.2012; Hashimshony
et al.2012; Bhargavaet al.2013; Houet al.2015; Panet al.
2013). Most 39-end sequencing methods are based on the former strategy. However, results from trial 3 clearly showed that overamplification by PCR favors a subset of abundantly expressed transcripts in sequencing libraries, resulting in
reduced representation of the remaining transcripts and fail-ure to detect genes expressed at low levels (File S1A). To address the issue, we used only one round of PCR in combi-nation with a low concentration of primers to synthesize and amplify second-strand cDNA. The modifications were very successful. Linear amplification of transcripts most likely would yield a library with an extremely low quantity of prod-ucts, particularly when only 39ends are collected as profiling targets. As such, we favor exponential amplification by PCR at the moment.
Incomplete genome sequencing and incomplete gene annotation jeopardize transcriptome analysis:No doubt the genome assembly of X. tropicalis has improved signifi -cantly from v4.1 (Hellsten et al. 2010) to v7.1 (http:// www.xenbase.org/entry/). Unfortunately, Gilchrist (2012) estimated that 4610 transcripts did not contain UTR se-quences and that 3396 transcripts did not have an annotated 39-UTR in the latter assembly. Indeed, we had difficulties (Figure 4) assigning poly(A) sites to genes in this study when assembly v7.1 was used as a reference genome. Therefore, we plan to use v9.0 (http://www.xenbase.org/entry/) as the reference genome to improve transcriptome analysis of this and future research.
WTTS-seq vs. RNA-seq
Transcriptome profiles derived from WTTS-seq and RNA-seq are highly correlated:In this study, the same pooled total RNA sample was used for both WTTS-seq and RNA-seq analyses. The Pearson correlation coefficient between two types of libraries was 0.80 (File S3F), while the Spearman ranking correlation coefficient was 0.91 (File S3C), indicat-ing that the transcriptome profiles derived from WTTS-seq were more highly related to RNA-seq than other 39-end se-quencing methods. For instance, Pearson correlations were 0.7185 between 39T-fill and RNA-seq and 0.7860 between PAT-seq and RNA-seq (Wilkeninget al.2013; Harrisonet al.
2015). The high correlation between WTTS-seq and RNA-seq that we observed strongly indicates that WTTS-seq is a pow-erful and efficient tool that can be used for profiling tran-scriptomes and characterizing their diversities or dynamics among different biological samples or at physiologic time points.
RNA-seq detects more DEGs than WTTS-seq, but some of them are probably false positives: When the 39T-fill pro-tocol was developed, Wilkeninget al.(2013) extracted total RNA from Saccharomyces cerevisiae strain SLS045 cultured with either YPG (1% yeast extract, 2% peptone, and 1% glucose) or YPGal (1% yeast extract, 2% peptone, and 1% galactose). The authors observed that unlike RNA-seq, 39T-fill captured a greater number of short transcripts, thus preventing size-biased counts of gene expression abundance. Interestingly, the number of DEGs detected between the two culture conditions were 2441 and 3401 for 39T-fill and RNA-seq, respectively (adjusted P,0.1). Our data also clearly showed that the WTTS-seq method is capable of capturing shorter transcripts (Figure 9). Moreover, we found that RNA-seq“exaggerates”DEG identification (File S3D, J and K) be-cause it widens the distribution of transcriptomes and thus magnifies the fold changes for more DEGs (Figure 7). The correlation plots between biological replicates (Figure 6) provide further evidence that RNA-seq libraries had wider transcriptome distributions than WTTS-seq. That is, the cen-tralized zones were usually below 10 (in log2 counts) for
WTTS-seq libraries but ranged from 10 to 15 (log2counts)
in the RNA-seq libraries.
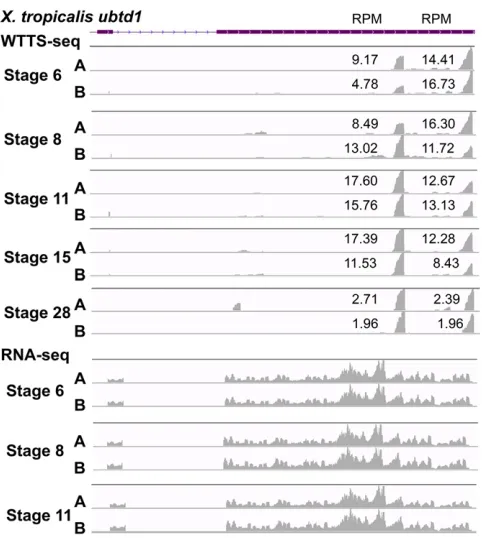
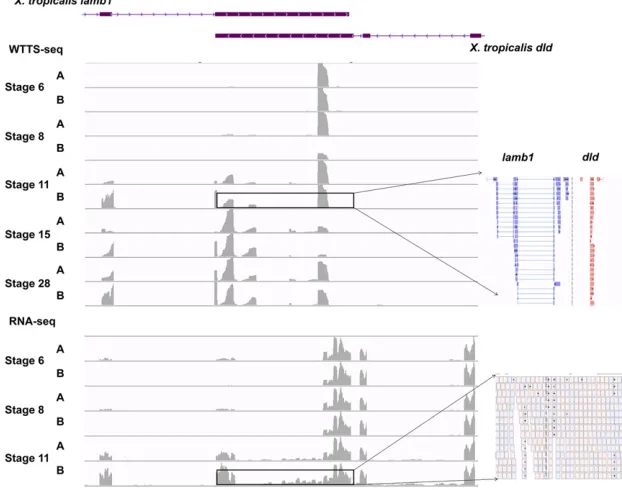
WTTS-seq, but not RNA-seq, can easily detect alternative polyadenylations: In this study, we used the X. tropicalis ubtd1gene as an example to demonstrate how the WTTS-seq method can determine APA patterns across diverse devel-opmental stages. Both proximal and distal polyadenylation signals of the gene were used from stages 6–28 during em-bryo development (Figure 8). While the distal APA site was dominant at stage 6, usage switched to the proximal site at stage 11. At stage 28, however, both sites were used equally. In addition, there was no switching harmony between the two families at stages 8 and 15. Unfortunately, RNA-seq failed to reveal any differences in usage of proximal or
distal APA sites (Figure 8) during embryo development at these stages.
WTTS-seq is more cost-effective than RNA-seq:Thefinalized procedures for construction of a WTTS-seq library (Figure 1) are not much different from those used for preparation of a library for RNA-seq, so library construction expenses should be similar. Therefore, the method that produces the greatest number of usable reads for accurate analysis can be classified as the most cost-effective. Our RNA-seq libraries produced an average of 143,163,201 reads per library, while Tan’s RNA-seq data averaged 11,685,268 per library (File S1G) (Tan
et al.2013). In comparison, our WTTS-seq libraries had only an average of 7,348,281 reads per library. As such, our RNA-seq runs identified the highest number (21,666 on average) of expressed genes with evidence, which was 3359 and 4236 more genes than those identified by WTTS-seq and Tan’s RNA-seq libraries, respectively. When RPM$0.2 was employed as a cutoff point, the average number of expressed genes in both RNA-seq libraries was similar (15,731 from our RNA-seq compared to 15,734 from Tan’s RNA-seq). In con-trast, our WTTS-seq yielded an average of 17,930 genes
expressed at RPM$0.2 (File S1G). These results imply that RNA-seq libraries with over 140 million reads are not re-quired for gene detection but also demonstrate that 10 mil-lion reads per RNA-seq library may not be adequate. Wang
et al. (2011) found that RNA-seq with 10 million (75-bp) reads per library detected up to 80% of annotated chicken genes but required at least 30 million (75-bp) reads to suffi -ciently cover all the genes in the chicken transcriptome. Re-sults presented in Files S1, A and G, suggest that 5 to 10 million reads per WTTS-seq library should be sufficient for transcriptome analysis. Therefore, the cost of sequencing a library prepared by our WTTS-seq method is at least 67% cheaper than RNA-seq.
Both WTTS-seq and RNA-seq should be used together in transcriptome analysis: Transcriptome analysis often re-quires verification and validation of DEGs using an inde-pendent method such as real-time quantitative reverse transcription PCR (qRT-PCR). After reviewing challenges in assay development, statistical analyses, reagents, and opera-tor variability, however, Bustin (2002) concluded:“In reality, it is very difficult to answer the question of how quantitative,
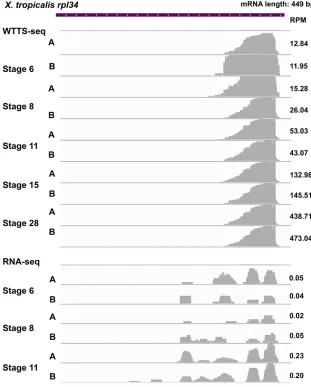
Figure 9 Expression of short transcript is well de-tected by WTTS-seq but biased by RNA-seq. The X. tropicalis rpl34gene has an mRNA sequence of 449 bp in the genome. WTTS-seq revealed that expression ofrpl34increased from stage 6 to stage 28 based on RPM values. However,rpl34was not fully covered due to biases in RNA-seq libraries (see RPM values in the
reproducible or informative real-time RT-PCR is” (p. 36). In addition, while there is no question that qRT-PCR can validate gene expression, the time and expense needed to verify all DEGs revealed by a whole transcriptome analysis would be insurmountable. Furthermore, extra challenges ex-ist when qRT-PCR is used to validate alternative transcripts of a given gene revealed by WTTS-seq. In this study, six samples derived fromX. tropicalisembryos at stages 6, 8, and 11 were profiled using both WTTS-seq and RNA-seq methods. Al-though RNA-seq cannot effectively detect APA sites, it can provide solid evidence to show that they are expressed within introns or that they switch from proximal to distal or from distal to proximal sites (see an example inFile S3G for the intron case). Furthermore, RNA-seq can show initiation of distal site usage when the proximal site is consistently expressed. In the near future, we will examine cases where the proximal site is newly initiated, while the distal site is consistently expressed. Therefore, our data strongly suggest that both WTTS-seq and RNA-seq be used together to avoid further validation using other methods. The expression dy-namics of alternative polyadenylated transcripts within a gene across developmental stages also can serve as mutual validation in addition to RNA-seq confirmation.
Conclusion
After serial adjustment and refinement with primer types and amount, PCR runs and cycles, and RNase types and combi-nations, we have successfully developed a WTTS-seq method that can be used to profile both gene expression and APA by sequencing the 39ends of transcripts. NGS library prepa-ration, in fact, involves many steps, which, in turn, can pro-duce biases, noisy data, and artifacts. Ourfinalized WTTS-seq assay radically addresses these challenges and serves as a
powerful tool for the research community to investigate tran-scriptomes and reveal poly(A) site usages specific to complex phenotypes, disease stages, or biological processes in hu-mans, animals, and plants.
Acknowledgments
We thank James Coulombe, National Institutes of Health/ National Institute of Child Health and Human Development; Jay Shendure, University of Washington; Oliver Hobert, Columbia University; and two anonymous reviewers for their insightful comments and suggestions for improving the man-uscript. WTTS-seq and RNA-seq were carried out on the Ion PGM Sequencer at the Genomics Core Laboratory, Washington State University, and the Illumina platforms at the Beijing Genome Institute (BGI), China. BGI, Hong Kong, extracted total RNA fromX. tropicalisembryos and measured RNA qual-ity, quantqual-ity, purqual-ity, and integrity. This work was supported by the Eunice Kennedy Shriver National Institute of Child Health and Human Development of the National Institutes of Health under award no. R21-HD076845 and the National Institute of Food and Agriculture, United States Department of Agri-culture, under award no. 2016-67015-24470 to ZJ. The authors declare no conflict of interest.
Literature Cited
Bhargava, V., P. Ko, E. Willems, M. Mercola, and S. Subramaniam,
2013 Quantitative transcriptomics using designed
primer-based amplification. Sci. Rep. 3: 1740.
Bolger, A. M., M. Lohse, and B. Usadel, 2014 Trimmomatic: a
flexible trimmer for Illumina sequence data. Bioinformatics 30: 2114–2120.
Bustin, S. A., 2002 Quantification of mRNA using real-time reverse transcription PCR (RT-PCR): trends and problems. J. Mol. Endo-crinol. 29: 23–39.
Costa, V., C. Angelini, I. De Feis, and A. Ciccodicola, 2010 Uncovering the complexity of transcriptomes with RNA-Seq. J. Biomed. Biotechnol. 2010: 853916.
Derti, A., P. Garrett-Engele, K. D. Macisaac, R. C. Stevens, S. Sriram et al., 2012 A quantitative atlas of polyadenylation in five mammals. Genome Res. 22: 1173–1183.
Gertz, J., K. E. Varley, N. S. Davis, B. J. Baas, I. Y. Goryshinet al., 2012 Transposase mediated construction of RNA-seq libraries. Genome Res. 22: 134–141.
Gilchrist, M. J., 2012 From expression cloning to gene modeling: the development ofXenopusgene sequence resources. Genesis 50: 143–154.
Harrison, P. F., D. R. Powell, J. L. Clancy, T. Preiss, P. R. Boaget al., 2015 PAT-seq: a method to study the integration of 39-UTR dynamics with gene expression in the eukaryotic transcriptome. RNA 21: 1502–1510.
Hashimshony, T., F. Wagner, N. Sher, and I. Yanai, 2012 CEL-Seq: single-cell RNA-Seq by multiplexed linear amplification. Cell Reports 2: 666–673.
Hellsten, U., R. M. Harland, M. J. Gilchrist, D. Hendrix, J. Jurka et al., 2010 The genome of the Western clawed frogXenopus tropicalis. Science 328: 633–636.
Hoque, M., Z. Ji, D. Zheng, W. Luo, W. Liet al., 2013 Analysis of alternative cleavage and polyadenylation by 39region extraction and deep sequencing. Nat. Methods 10: 133–139.
Hou, Z., P. Jiang, S. A. Swanson, A. L. Elwell, B. K. Nguyenet al., 2015 A cost-effective RNA sequencing protocol for large-scale gene expression studies. Sci. Rep. 5: 9570.
Jan, C. H., R. C. Friedman, J. G. Ruby, and D. P. Bartel, 2011 Formation, regulation and evolution of Caenorhabditis elegans39UTRs. Nature 469: 97–101.
Jiang, Z., X. Zhou, R. Li, J. J. Michal, S. Zhanget al., 2015 Whole transcriptome analysis with sequencing: methods, challenges and potential solutions. Cell. Mol. Life Sci. 72: 3425–3439. Khokha, M. K., C. Chung, E. L. Bustamante, L. W. Gaw, K. A. Trott
et al., 2002 Techniques and probes for the study ofXenopus tropicalisdevelopment. Dev. Dyn. 225: 499–510.
Laehnemann, D., A. Borkhardt, and A. C. McHardy, 2016 Denoising DNA deep sequencing data-high-throughput sequencing errors and their correction. Brief. Bioinform. 17: 154–179.
Ma, L., P. K. Pati, M. Liu, Q. Q. Li, and A. G. Hunt, 2014 High throughput characterizations of poly(A) site choice in plants. Methods 67: 74–83.
Mata, J., 2013 Genome-wide mapping of polyadenylation sites in
fission yeast reveals widespread alternative polyadenylation. RNA Biol. 10: 1407–1414.
Matoulkova, E., E. Michalova, B. Vojtesek, and R. Hrstka, 2012 The role of the 39untranslated region in post-transcriptional regulation of protein expression in mammalian cells. RNA Biol. 9: 563–576. Morin, R., M. Bainbridge, A. Fejes, M. Hirst, M. Krzywinskiet al.,
2008 Profiling the HeLa S3 transcriptome using randomly
primed cDNA and massively parallel short-read sequencing. Biotechniques 45: 81–94.
Nagalakshmi, U., K. Waern, and M. Snyder, 2010 RNA-Seq: a
method for comprehensive transcriptome analysis. Curr. Protoc. Mol. Biol. 11: 11–13.
Nam, D. K., S. Lee, G. Zhou, X. Cao, C. Wanget al., 2002 Oligo(dT) primer generates a high frequency of truncated cDNAs through internal poly(A) priming during reverse transcription. Proc. Natl. Acad. Sci. USA 99: 6152–6156.
Pan, X., R. E. Durrett, H. Zhu, Y. Tanaka, Y. Liet al., 2013 Two methods for full-length RNA sequencing for low quantities of cells and single cells. Proc. Natl. Acad. Sci. USA 110: 594–599. Pelechano, V., S. Wilkening, A. I. Jarvelin, M. M. Tekkedil, and L.
M. Steinmetz, 2012 Genome-wide polyadenylation site
map-ping. Methods Enzymol. 513: 271–296.
Rallapalli, G., E. M. Kemen, A. Robert-Seilaniantz, C. Segonzac, G. J. Etherington et al., 2014 EXPRSS: an Illumina based high-throughput expression-profiling method to reveal transcrip-tional dynamics. BMC Genomics 15: 341.
Richards, M., S. P. Tan, W. K. Chan, and A. Bongso, 2006 Reverse serial analysis of gene expression (SAGE) characterization of orphan SAGE tags from human embryonic stem cells identifies the presence of novel transcripts and antisense transcription of key pluripotency genes. Stem Cells 24: 1162–1173.
Robinson, M. D., D. J. McCarthy, and G. K. Smyth, 2010 edgeR: a bioconductor package for differential expression analysis of dig-ital gene expression data. Bioinformatics 26: 139–140. Shepard, P. J., E. A. Choi, J. Lu, L. A. Flanagan, K. J. Hertelet al.,
2011 Complex and dynamic landscape of RNA
polyadenyla-tion revealed by PAS-Seq. RNA 17: 761–772.
Steijger, T., J. F. Abril, P. G. Engstrom, F. Kokocinski, T. J. Hubbard et al., 2013 Assessment of transcript reconstruction methods for RNA-seq. Nat. Methods 10: 1177–1184.
Subtelny, A. O., S. W. Eichhorn, G. R. Chen, H. Sive, and D. P. Bartel, 2014 Poly(A)-tail profiling reveals an embryonic switch in translational control. Nature 508: 66–71.
Takahashi, H., T. Lassmann, M. Murata, and P. Carninci, 2012 59 end-centered expression profiling using cap-analysis gene expres-sion and next-generation sequencing. Nat. Protoc. 7: 542–561. Tan, M. H., K. F. Au, A. L. Yablonovitch, A. E. Wills, J. Chuanget al.,
2013 RNA sequencing reveals a diverse and dynamic
reper-toire of theXenopus tropicalistranscriptome over development. Genome Res. 23: 201–216.
Tang, F., C. Barbacioru, Y. Wang, E. Nordman, C. Lee et al., 2009 mRNA-Seq whole-transcriptome analysis of a single cell. Nat. Methods 6: 377–382.
Trapnell, C., A. Roberts, L. Goff, G. Pertea, D. Kimet al., 2012 Differen-tial gene and transcript expression analysis of RNA-seq experi-ments with TopHat and Cufflinks. Nat. Protoc. 7: 562–578. Wang, Y., N. Ghaffari, C. D. Johnson, U. M. Braga-Neto, H. Wanget al.,
2011 Evaluation of the coverage and depth of transcriptome by RNA-Seq in chickens. BMC Bioinformatics 12(Suppl. 10): S5. Wang, Z., M. Gerstein, and M. Snyder, 2009 RNA-Seq: a
revolu-tionary tool for transcriptomics. Nat. Rev. Genet. 10: 57–63.
Wilhelm, B. T., and J. R. Landry, 2009 RNA-Seq-quantitative
measurement of expression through massively parallel RNA-sequencing. Methods 48: 249–257.
Wilkening, S., V. Pelechano, A. I. Jarvelin, M. M. Tekkedil, S. Anders et al., 2013 An efficient method for genome-wide polyadenylation site mapping and RNA quantification. Nucleic Acids Res. 41: e65.
Wu, T. D., and C. K. Watanabe, 2005 GMAP: a genomic mapping
and alignment program for mRNA and EST sequences. Bioinfor-matics 21: 1859–1875.
Wu, X., M. Liu, B. Downie, C. Liang, G. Jiet al., 2011 Genome-wide landscape of polyadenylation in Arabidopsis provides evi-dence for extensive alternative polyadenylation. Proc. Natl. Acad. Sci. USA 108: 12533–12538.
Yao, C. G., and Y. S. Shi, 2014 Global and quantitative profiling of polyadenylated RNAs using PAS-seq. Methods Mol. Biol. 1125: 179–185.
GENETICS
Supporting Information
www.genetics.org/lookup/suppl/doi:10.1534/genetics.116.188508/-/DC1
Accurate Pro
fi
ling of Gene Expression and
Alternative Polyadenylation with Whole
Transcriptome Termini Site Sequencing (WTTS-Seq)
Xiang Zhou, Rui Li, Jennifer J. Michal, Xiao-Lin Wu, Zhongzhen Liu, Hui Zhao, Yin Xia, Weiwei Du, Mark R. Wildung, Derek J. Pouchnik, Richard M. Harland, and Zhihua Jiang
Supplemental Data File 1A. Library preparation, sequencing outputs and data analysis
Trials
WTTS-seq libraries
RNA-seq library Trial 1 Trial 2 Trial 3 Trial 4 Trial 5 Trial 6 Trial 7
Library parameters
Type and amount of RNA
Total 10 µg
Total 10 µg
Total 10 µg
Total 10 µg
Total 5 µg
Total 2 µg
Total 2 µg
PolyA+ RNA
Oligo (dT) for reverse transcription 20 10 10 10 10 10 10 N/A
Primer typesa OP IP PAAP PAAP PAAP PAAP PAAP N/A
Primer concentration (For/Rev, µM) 25/25 25/25 25/25 5/2.5 0.8/0.4 0.8/0.4 0.8/0.4 N/A
Second-strand cDNA synthesis (PCR cycles) 10 20 2 25 20 20 20 N/A
Size selection - method Gel Gel Gel Gel Gel Gel Beads N/A
Size selection - range (in bp) 200 - 300 300 - 500 250 - 450 250 - 450 200 - 500 200 - 500 200 - 500 N/A
Second-strand cDNA amplification (PCR cycles) 25 35 20 N/A N/A N/A N/A N/A
RNases No H H H I+H I+H I+H N/A
Library purification No Gel Gel Gel Beads Beads Beads N/A
Library outputs
Number of raw reads 31,186,220 141,543,418 23,672,332 15,369,758 21,560,536 21,201,174 35,414,112 103,995,719
Average size (bp) of raw reads with range in bracket 117 (8-389) 184(8-389) 131(8-389) 105 (8-375) 115 (8-373) 112 (8-375) 118 (8-375) 92 (8-361)
Clean reads including 23,652,339 136,885,636 21,500,209 12,613,564 19,838,876 19,581,691 32,275,048 97,545,846
Mapped to genome assembly 20,254,715 45,224,464 17,476,311 9,034,118 13,760,187 16,694,739 26,793,636 78,949,909
Mapped to NCBI mRNA 935,866 767,057 351,035 250,694 603,981 981,210 1,528,260 4,581,601
Unmapped reads for de novo assembly 2,461,758 90,894,115 3,672,863 3,328,752 5,474,708 1,905,742 3,953,152 14,014,336
Mapped reads with loci assigned 18,867,535 42,424,000 16,231,660 8,364,595 11,785,988 14,918,058 23,922,835 73,522,777
Transcriptome Parameters
Mean 3.60E-05 3.59E-05 3.60E-05 3.60E-05 3.60E-05 3.60E-05 3.60E-05 3.59E-05
As RNA-seq% 100.11% 100.03% 100.13% 100.29% 100.20% 100.15% 100.08% 100.00%
Standard error 2.09E-06 0.0000162 0.0000137 0.0000116 2.52E-06 1.25E-06 1.33E-06 1.01E-06
As RNA-seq% 207.33% 1605.21% 1361.44% 1147.54% 250.51% 124.31% 132.51% 100.00%
Transcriptome Coverage
Total loci combined 27,836 27,836 27,836 27,836 27,836 27,836 27,836 27,836
Total loci with evidence 15,961 19,242 14,905 17,289 19,695 19,366 20,690 24,927
Total loci with RPM≥0.2 11,398 16679 11,118 15,544 17,339 17,116 17,740 19,939
Supplemental Data File 1B. Adaptor/primer design and sequences
Term/function
Sequences (5’ – 3’)
Switching
oligo/5’ adaptor
CAAGCAGAAGACGGCATACGAGATCCACTACGCCTCCGCTTTCCTCTCTATGGGCAGTCGG TGAT(GrGrGr)(Gr:guanosine 5′-triphosphate)
Reverse
transcription
oligo/3’ adaptor
AATGATACGGCGACCACCGAGATCTACACCATCTCATCCCTGCGTGTCTCCGACTCAGXXX XXXXXXX(dT20 or dT10)VN (XXXXXXXXXX: barcode sequences;
V:A/C/G; and N: A/T/C/G)
Outer primers
(OP)/PCR for 2
ndstrand cDNA
synthesis
Forward: AGAAGACGGCATACGAGATCCACTAC Reverse: CACCGAGATCTACACCATCTCATCC
Ion primers (IP)/
PCR for 2
ndstrand
cDNA synthesis
Forward: CCACTACGCCTCCGCTTTCCTCTCTATGGGCAGTCGGTGAT Reverse: CCATCTCATCCCTGCGTGTCTCCGACTCAG
PolyA anchored
primers (PAAP)/
PCR for 2
ndcDNA synthesis
Forward: CCACTACGCCTCCGCTTTCCTCTCTATGGGCAGTCGGTGAT
Reverse: CCATCTCATCCCTGCGTGTCTCCGACTCAGXXXXXXXXXX(dT20 or
dT10)VN (XXXXXXXXXX: barcode sequences; V:A/C/G; and N:
Supplemental Data File 1C. Processing script that trims Ts or T-rich regions from the
5’-ends of reads
#!/usr/bin/perl
use strict; use warnings; #[email protected]
print STDERR "usage: <pl> <*.fastq> <outname> <min-len>
trim TTTTTTTT in the head of reads and discard trimmed-reads < mini_len bp\n";
die "command err\n" unless @ARGV == 3; my $mini_len = $ARGV[2];
open(IN,$ARGV[0]) or die "err reading fastq\n"; open(OUT,">$ARGV[1]") or die "err writing output\n"; my$count =0;
my$read_count=0;
my$failed_reads = 0;my$passed_reads = 0; my$fastq = "";
while(<IN>) { $count ++; $fastq .= $_;
if($count > 1 && $count % 4 == 0){ $read_count++;
if($fastq !~ /^\@/) {die "$fastq wrong input format!!!\n"} my $trimTTT = TrimTFastq($fastq);
if(length$trimTTT >= $mini_len){ $passed_reads++;
print OUT "$trimTTT"; }
$fastq = ""; }
}
close IN; close OUT;
print"
for $ARGV[0]";
print"there are $read_count reads parsed\n"; print"there are $passed_reads reads passed\n"; print $passed_reads/$read_count,"\n";
sub TrimTFastq{ $_ = shift;
my($id,$seq,$plus,$score) = split "\n", $_;
# print "$id;\n$seq;\n$plus;\n$score;\n\n";
my($polyT) = $seq =~ m/(^T*).*/;
if( (length($seq) - length($polyT)) < $mini_len) {return ""}
my$score_trimmed = substr ($score, length $polyT);
my$trimmed_fastq = "$id\n$seq_trimmed\n$plus\n$score_trimmed\n"; return $trimmed_fastq;
}
sub TrimCTTTFastq{ $_ = shift;
my($id,$seq,$plus,$score) = split "\n", $_;
# print "$id;\n$seq;\n$plus;\n$score;\n\n";
my($polyT) = $seq =~ m/(^CT+).*/; unless (defined $polyT){$polyT = ""}
if( (length($seq) - length($polyT)) < $mini_len) {return ""}
my$seq_trimmed = substr ($seq,length $polyT); my$score_trimmed = substr ($score, length $polyT);
my$trimmed_fastq = "$id\n$seq_trimmed\n$plus\n$score_trimmed\n"; return $trimmed_fastq;