Studies on Waste Heat Recovery Using Matrix
Heat Exchanger and Alternate Fuel
Vinothkumar. P.T
1, Sunderasen.S
2Prasath.S
3PG Student, Dept. of Mechanical Engineering, Knowledge Institute of Technology, Salem, Tamilnadu, India1 Assistant Professor, Dept. of Mechanical Engineering, Knowledge Institute of Technology, Salem, Tamilnadu, India2,3
ABSTRACT: The increasing demand for power has led to considerable fossil fuels burning which has in turn had an adverse impact on environment. It is seen that approximately, 30 to 40% of heat is only converted into useful mechanical work and the remaining heat is emitted into atmosphere as waste heat. Efficient use of energy and its conservation assumes even greater importance in view of the fact that one unit of energy saved at the consumption level reduces the need for fresh capacity creation by 2.5 times to 3 times. The economic development of a country is often closely linked to its consumption of energy. Although India ranks sixth in the world as far as total energy consumption is concerned, it still needs much more energy to keep pace with its development objectives. It can be seen that there is growing momentum behind energy recovery innovation among legislative leaders at the local, state and federal level.
Energy recovery includes any process that converts waste material into energy. The Recovery technique reduces the amount of waste heat being emitted into the atmosphere. The study shows the availability and possibility of waste heat from internal combustion engine using Matrix Heat Exchanger, also describe loss of exhaust heat energy as waste heat. Waste heat recovery system leaves a pathway for recycling and conserving fuel for future generations.
KEYWORDS: Waste Heat, Matrix Heat Exchanger, Alternate Fuel
I. INTRODUCTION
Waste heat is the heat, which is generated in the process of combustion of fuel in the Internal Combustion Engine. Exhaust gas immediately leaving the engine can have temperatures as high as [450°C-600°C].
Waste heat is by necessity emitted by IC engines in the form of exhaust and cooling systems. Heat Transfer is a process by which internal energy from one substance transfers to another substance. There are three modes of heat transfer namely, Conduction, Convection and Radiation. Heat transfer can be made through Heat Exchanger. Heat Exchanger is a device built for efficient heat transfer from one medium to another. Here in this paper we are using Matrix Heat Exchanger for the recovery of waste heat through exhaust by heat transfer process.
Matrix Heat Exchanger consists of large number of identical tube passages. The set of tube channels are arranged to adopt the flow of fluid in counter flow direction. The rectangular cross section of tube is 2×2cm and length equals to 25cms. The density of Matrix Heat Exchanger is 6600m3/m2.
A. Design Model:
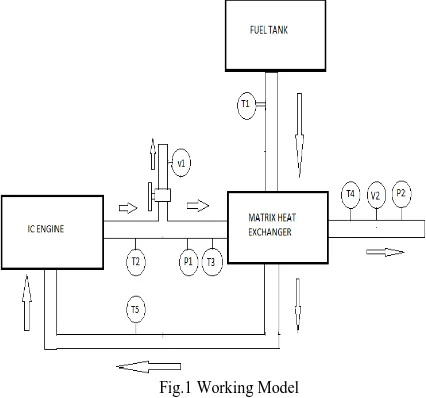
The design model of the waste heat recovery system is shown in Figure It consists of following parts,
Fuel supply unit
Matrix heat exchanger
Fig.1 Working Model
B. Neem Oil:
Neem oil is a vegetable oil pressed from the fruits and seeds of the Neem tree. Neem oil is in golden yellow, yellowish brown, reddish brown, dark brown, greenish brown or bright red. It has a strong odour. It is composed mainly of triglyceride and triterpenoid compounds that are responsible for the bitter taste. It is hydrophobic in nature.
TABLE 1
` PROPERTIES OF NEEM OIL AND DIESEL
Properties Neem oil Diesel
Calorific value 39900 kJ/kg 44000 kJ/kg
Density 938 kg/m3 (at 30°C) 835 kg/m3
Viscosity 98.68 cpi 3.59 cpi
Flash point 180 °C 50°C
Fire point 210°C 55°C
Cetane number 38 52
C. Engine Specification:
TABLE 2
SPECIFICATIONS OF AN IC ENGINE
Engine Type Kirloskar, Single cylinder, four stroke, water cooled
Bore & Stroke 80×110 mm
Rated Power 3.75 KW at 1500 rpm
Compression ratio 16:1 to 25:1
D. Working Principle:
Matrix heat exchanger contains large number of identical tube passages. The set of tube channels are arranged to adopt the flow of fluid in counter flow direction. The matrix density ratio of heat exchanger is 6600m3/m2. The rectangular cross section of each tube is 2x2 cm and length is equal to 25cm. The hot gases are passed through the tubes of the MHE and increase the temperature of the cold fluid which flows in semi elliptical tube. Here the restrictions of the hot fluid are totally neglected because the semi elliptical profile will support the deviation phenomenon. Therefore free flow of the hot fluid is achieved in tube passage of MHE. Since the heat exchanger was placed in the exhaust manifold of the engine. Here the hot gases of IC are passed to heat exchanger on alternate chamber containing the working fluid. The heat transfer takes place between the exhaust gas and the diesel and neem oil blend which decrease the viscosity of the working fluid.
E. Observed Tabulation:
Table 3 10N90D
S.no Load
Time Seconds
Inlet fuel °C
Ex gas °C
MHE °C
Out fuel °C
Velocity m/s
Speed rpm
Kgf N t1 t2 T1 T2 T3 T4 T5 V1 V2 N
1 0 0 17.21 17.09 28 230 128 80 45 4.4 4.1 1513
2 5 49.05 14.17 14.21 28 304 156 85 45 4.8 4.3 1472
3 10 98.1 9.51 9.47 30 404 186 98 46 5.1 4.7 1445
4 15 147.2 7.11 7.19 30 515 211 106 47 5.3 5.0 1407
The above Table 3 shows the observation readings for 10N90D using normal matrix heat exchanger for corresponding load conditions.
Table 4 20N80D
S.no Load
Time Seconds
Inlet fuel °C
Ex gas °C
MHE °C
Out fuel °C
Velocity m/s
Speed rpm
Kgf N t1 t2 T1 T2 T3 T4 T5 V1 V2 N
1 0 0 20.13 20.21 28 252 145 79 44 4.1 3.7 1533
2 5 49.05 17.42 17.58 28 309 156 84 45 4.0 3.6 1496
3 10 98.1 12.13 12.06 28 403 172 99 47 4.4 4.3 1463
The above Table 4 shows the observation readings for 20N80D using normal heat exchanger for corresponding load conditions.
Table 5 30N70D
S.no Load
Time Seconds
Inlet fuel °C
Ex gas °C
MHE °C
Out fuel °C
Velocity m/s
Speed rpm
Kgf N t1 t2 T1 T2 T3 T4 T5 V1 V2 N
1 0 0 19.57 19.46 28 247 139 82 43 3.3 3.8 1556
2 5 49.05 16.51 16.47 28 302 160 88 44 3.9 3.9 1463
3 10 98.1 11.27 11.13 29 390 190 98 45 4.5 4.1 1447
4 15 147.2 8.45 8.41 30 459 204 107 47 4.5 4.3 1417
The above Table 5 shows the observation readings for 30N70D using normal heat exchanger for corresponding load conditions.
Table 6 40N60D
S.no Load
Time Seconds
Inlet fuel °C
Ex gas °C
MHE °C
Out fuel °C
Velocity m/s
Speed rpm
Kgf N t1 t2 T1 T2 T3 T4 T5 V1 V2 N
1 0 0 18.33 18.27 28 235 127 81 44 4.3 3.1 1532
2 5 49.05 15.22 15.41 29 305 158 86 44 4.7 3.6 1494
3 10 98.1 10.31 10.27 30 403 185 97 45 5.0 3.8 1469
4 15 147.2 8.02 8.03 30 511 207 103 46 5.2 4.0 1414
The above Table 6 shows the observation readings for 40N60D using normal heat exchanger for corresponding load conditions.
Table 7 50N50D
S.no Load
Time Seconds
Inlet fuel °C
Ex gas °C
MHE °C
Out fuel °C
Velocity m/s
Speed rpm
Kgf N t1 t2 T1 T2 T3 T4 T5 V1 V2 N
1 0 0 17.21 17.09 28 230 128 80 45 4.4 4.1 1513
2 5 49.05 14.17 14.21 29 304 156 85 45 4.8 4.3 1472
3 10 98.1 9.51 9.47 29 404 186 98 46 5.1 4.7 1445
4 15 147.2 7.11 7.19 30 515 211 106 47 5.3 5.0 1407
F. Resultant Tabulation:
Table 8 ENGINE PERFORMANCE IN 10N90D
S.no Tavg S
Pressure
x10 -2
bar TFC BP SFC
Total fuel
power average Brake thermal efficiency
P2 P1 Kg/hr kW Kg/kWh kW %
1 21.07 0.826 0.345 1.431 0 ∞ 17.209 0
2 18.46 0.826 0.345 1.634 1.511 1.081 19.65 7.68
3 14.08 0.826 0.345 2.143 2.979 0.719 25.75 11.56
4 10.07 0.897 0.345 2.99 4.41 0.678 35.94 12.27
The above Table 8 shows the brake thermal efficiency of 10N90D for normal heat exchanger for the corresponding load conditions.
Table 9 ENGINE PERFORMANCE IN 20N80D
S.no Tavg S
Pressure
x10-2 bar
TFC BP SFC Total fuel
power average Brake thermal efficiency
P2 P1 Kg/hr kW Kg/kWh kW %
1 20.17 0.827 0.345 1.502 0 ∞ 17.67 0
2 17.42 0.827 0.345 1.731 1.536 1.126 20.37 7.54
3 12.09 0.897 0.345 2.506 3.005 0.833 29.49 10.18
4 9.05 0.897 0.345 3.336 4.419 0.754 39.26 11.25
The above Table 9 shows the brake thermal efficiency of 20N80D for normal heat exchanger for the corresponding load conditions.
Table 10 ENGINE PERFORMANCE IN 30N70D
S.no Tavg S
Pressure TFC BP SFC Total fuel
power average Brake thermal efficiency
P2 P1 Kg/hr kW Kg/kWh kW %
1 19.51 0.827 0.345 1.559 0 ∞ 17.95 0
2 16.49 0.827 0.345 1.844 1.502 1.227 21.24 7.07
3 11.12 0.827 0.345 2.735 2.973 0.919 27.36 10.89
4 8.43 0.897 0.413 3.608 4.367 0.826 41.56 9.51
Table 11 ENGINE PERFORMANCE IN 40N60D
S.no Tavg S
Pressure
x10-2 bar
TFC BP SFC Total fuel
power average Brake thermal efficiency
P2 P1 Kg/hr kW Kg/kWh kW %
1 18.3 0.827 0.345 1.66 0 ∞ 18.71 0
2 15.31 0.827 0.345 1.99 1.54 1.297 622.42 8.84
3 10.29 0.897 0.413 2.96 3.018 0.9807 33.35 9.05
4 8.025 0.897 0.413 3.805 4.357 0.873 42.88 10.16
The above Table 11 shows the brake thermal efficiency of 40N60D for normal heat exchanger for the corresponding load conditions.
` Table 12 ENGINE PERFORMANCE IN 50N50D
S.n o
Tavg
S
Pressure
x10 -2
bar
TF C
BP SFC Total fuel
power average
Brake thermal efficiency
P2 P1 Kg/
hr
kW Kg/kW
h
kW %
1 17.15 0.827 0.345 1.78 0 ∞ 19.62 0
2 14.19 0.897 0.345 2.16 1.512 1.428 23.803 6.35
3 9.49 0.897 0.345 3.23 2.968 1.088 35.59 8.34
4 7.15 0.897 0.413 4.28 4.336 0.987 47.168 9.19
The above Table 12 shows the brake thermal efficiency of 50N50D for normal heat exchanger for the corresponding load conditions
.
Table 13 HEAT TRANSFER RATE IN 10N90D
S.no
Inlet fuel temp
T1
°C
Exhaust gas temp
T3
°C
Heat exchanger
temp T4
°C
Outlet fuel temp
T5
°C
T3-T5
°C
T4-T1
°C
LMTD, ∆T °C
Heat transfer
Q
W
1 28 146 81 40 106 53 76.46 33720.11
2 28 159 89 42 117 61 85.35 37639.55
3 30 168 97 44 124 67 93.213 41106.98
4 30 179 104 47 132 74 101.436 44733.57
Table 14 HEAT TRANSFER RATE IN 20N80D S.no Inlet fuel temp T1 °C Exhaust gas temp T3 °C Heat exchanger temp T4 °C Outlet fuel temp T5 °C
T3-T5
°C
T4-T1
°C LMTD, ∆T °C Heat transfer Q W
1 28 145 79 44 101 51 73.50 32549.71
2 28 156 84 45 111 56 80.38 35451.27
3 28 172 99 47 125 71 96.07 42369.43
4 28 201 102 46 155 74 110.204 45599.25
The above Table 14 shows the heat transferred for 20N80D in normal heat exchanger for the corresponding load conditions.
Table 15 HEAT TRANSFER RATE IN 30N70D
S.no Inlet fuel temp T1 °C Exhaust gas temp T3 °C Heat exchanger temp T4 °C Outlet fuel temp T5 °C
T3-T5
°C
T4-T1
°C LMTD, ∆T °C Heat transfer Q W
1 28 139 82 43 96 54 74.21 25976.45
2 28 160 88 44 116 60 85.57 37738.26
3 29 190 98 45 145 69 102.98 45417.81
4 30 204 107 47 157 77 113.57 50084.59
The above Table 15 shows the heat transferred for 30N70D in normal heat exchanger for the corresponding load conditions.
Table 16 HEAT TRANSFER RATE IN 40N60D
S.no Inlet fuel temp T1 °C Exhaust gas temp T3 °C Heat exchanger temp T4 °C Outlet fuel temp T5 °C
T3-T5
°C
T4-T1
°C LMTD, ∆T °C Heat transfer Q W
1 28 127 81 44 83 53 67.46 29751.78
2 29 158 86 44 114 57 82.87 36545.67
3 30 185 97 45 140 67 100.34 44253.55
4 30 207 103 46 161 70 111.92 49356.82
Table 17 HEAT TRANSFER RATE IN 50N50D S.no Inlet fuel temp T1 °C Exhaust gas temp T3 °C Heat exchanger temp T4 °C Outlet fuel temp T5 °C
T3-T5
°C
T4-T1
°C LMTD, ∆T °C Heat transfer Q W
1 28 128 80 45 83 52 75 33075
2 29 156 85 45 111 56 81.32 35864.45
3 29 186 98 46 140 71 100 44100
4 30 211 106 47 174 76 115.7 51063.15
The above Table 17 shows the heat transferred for 10N90D in normal heat exchanger for the corresponding load conditions.
Table 18 RESULTANT TABULATION FOR REYNOLDS NUMBER AND NUSSELT NUMBER
S.no Blend ratio Velocity m/s Mass flow rate Kg/hr Viscosity Centipoise Renolds number Nusselt number Flash point Fire point
V3 m µ Re Nu °C °C
1 10N90D 3.74 0.267 9.65 8395.1 16.72 71 74
2 20N80D 3.789 0.270 14.48 5597.1 14.62 79 84
3 30N70D 3.83 0.274 16.64 4979.6 13.18 86 92
4 40N60D 3.87 0.282 22.09 3833.2 11.74 95 106
5 50N50D 3.92 0.289 23.94 3622.80 11.52 104 110
The above Table 3.33 shows the tabulation for Reynolds number and Nusselt number.
G. Graphs:
LOAD IN % VS BRAKE THERMAL EFFICIENCY IN %
Figure 2 Comparison graph for engine performance with blends of neem oil
The above Figure 2 shows the brake thermal efficiency in IC engine for corresponding load conditions 0 5 10 15 20 25 30
0 25 50 75
Br
ak
e
T
h
e
rm
al
E
ff
ici
e
n
cy
in
%
Load in %
pure diesel 10N90D
20N80D
LOAD IN % VS HEAT TRANSFERRED IN W
Figure 3 Comparison graph for heat transferred with blends of neem oil
The above Figure 3 shows the heat transferred in IC engine for corresponding load conditions.
% OF BLEND VS MASS FLOW RATE, KG/HR
Figure 4 Graph for mass flow rate with blends of neem oil
The above Figure 4 shows the mass flow rate in the heat exchanger for the blends of neem oil. 0
10000 20000 30000 40000 50000 60000
0 25 50 75
He
at
Tr
an
sf
e
rr
e
d
,
W
Load in %
10N90D 20N80D 30N70D 40N60D 50N50D
0.255 0.26 0.265 0.27 0.275 0.28 0.285 0.29 0.295
10N90D 20N80D 30N70D 40N60D 50N50D
M
ass
Fl
ow
R
at
e
, kg
/hr
% of Blend
NUSSELT NUMBER VS MASS FLOW RATE, KG/HR
Figure 5 Comparison graph for mass flow rate with Nusselt number.
The above Figure 5shows comparison graph for mass flow rate with Nusselt number in IC engine.
REYNOLDS NUMBER VS MASS FLOW RATE, KG /HR
Figure 6 Comparison graph for mass flow rate with Reynolds number.
The above Figure 6 shows comparison graph for mass flow rate with Reynolds number in IC engine. 0
5 10 15 20
0.269 0.27 0.274 0.282 0.289
Nu
sselt
n
u
m
b
e
r
Mass Flow Rate kg/hr
NUSSELT NUMBER
0 2000 4000 6000 8000 10000
0.267 0.27 0.274 0.282 0.289
R
ey
n
ol
d
s
n
u
m
b
e
r
Mass Flow Rate, kg/hr
LOAD IN% VS PRESSURE DROP IN BAR
Figure 7 Comparison graph for pressure drop with load.
The above Figure 7 shows comparison graph for pressure drop with load in IC engine.
H. Result Analysis: 1). Fuel consumption (FC):
The blend of diesel and neem oil is varied as 10%, 20%, 30% and 50% in diesel engine. As the loads are increased, the fuel consumption of blended diesel also increased as compared to diesel. At the constant speed of 1500 rpm, the load was varied as 0, 5, 10, and 15 kg. It indicates the fuel consumption of blended diesel is increased than that of diesel fuel. The blend proportions were prepared as 10N90D, 20N80D, 30N70D, 40N60D and 50N50D respectively. It is observed that for the same load conditions the diesel engine consume more fuel.
2). Brake thermal efficiency:
The above figures shows the variation in brake thermal efficiency for diesel & neem oil. When blends are used 20%, 30%, 40% and 50% in diesel engine. The brake thermal efficiency of Neem oil blend is decreased with increase in load for all the test fuels. The Brake Thermal Efficiency (BTE) of diesel blends decreased with an increase in amount of neem in the blends.
The performance of single cylinder four stroke diesel engine fuelled with Neem oil blends is investigated and the key results are summarized below:
• The fuel properties of Neem oil blends have a relatively grater flash point (180°C) that makes it less volatile and far better transportation than diesel fuel.
• The brake thermal efficiency of Neem oil blends are lower than that of diesel for all engine brake loads. It is concluded that the Neem oil blends, i.e., 10N90D, 20N80D, 30N70D, 40N60D and 50N50D are running normal during testing of diesel engine.10N90D showed very close performance to diesel fuel.
Therefore, from the above analysis it can be resulted that the Neem oil blends showed poor engine performance in comparison to Diesel fuel. Neem oil and diesel blends can be used as a substitute fuel for Conventional petro-diesel in future.
3). Heat transfer:
The above figures shows the variation in heat transferred for diesel & neem oil. When blends are used 20%, 30%, 40% and 50% in diesel engine. The heat transferred between Neem oil blend and the exhaust gas is increased with increase in load for all the test fuels. The heat transfer rate between diesel blends and exhaust gas increases with an increase in amount of neem in the blends.
0 0.002 0.004 0.006 0.008 0.01
0 25 50 75
P
re
ssur
e
Dr
op
in
ba
r
Load in %
10N90D (P1)
10N90D (P2)
20N80D (P1)
20N80D (P2)
30N70D (P1)
30N70D (P2)
40N60D (P1)
4). Reynolds number:
The Reynolds number is the dimensionless number that is used to determine whether the flow is laminar or turbulent. The above figure shows the variation of the Reynolds number with respect to the mass flow rate of the blends in the heat exchanger .It shows that the flow is turbulent and the Reynolds number decreases when the percentage of the neem oil in the blend increases. Hence the Reynolds number depends on the viscosity, velocity density of the fluid and the length of the pipe.
5). Nusselt number:
Nusselt number is the ratio of conductive heat transfer across the boundary layers. The above figure shows the variation of the Nusselt number with respect to the mass flow rate of the blend. It shows that the Nusselt number decreases with the increase in percentage of the neem oil in the diesel.
II. CONCLUSION
It has been identified that there are large potentials of energy savings through the waste heat recovery technologies. Waste heat recovery defines capturing and reusing the waste heat from internal combustion engine for heating, generating mechanical or electrical work and refrigeration system. It would also help to recognize the improvement in performance and emission of the engine. If these technologies were adopted by the automotive manufacturers then it will be result in efficient engine performance and low emission. The waste heat recovery from exhaust gas and conversion in to mechanical power is possible with help of Rankine, Stirling and Brayton cycles, vapor absorption. For waste heat recovery matrix heat exchanger is used, which has high efficiency. It is helpful for the increase in thermal efficiency and reduction in emission.
REFERENCES
1. Aly S. (1988) “Diesel engine waste-heat power cycle”, Applied Engineering, Vol.29, No.5, pp. 179-189.
2. Bombarda P., Invernizzi C.M. and PietraC. (2010) “Heat recovery from Diesel engines: A thermodynamic comparison between Kalina and ORC cycles”, Applied Thermal Engineering, Vol.30, No.2, pp. 212-219.
3. Brands M.C., Werner J.R., Hoehne J.L., Kramers S. (1981) “Vehicle testing of Cummins turbocompound diesel engine”, Vol.81, No.5, pp. 73.
4. Dincer and Zamfirescu (2008) “Maximum obtainable specific power of high-temperature waste heat engines”, Heat Recovery System, Vol.15, No.2, pp. 13-17. 5. Dai S., Vaja and Gambarotta (2009) “Efficiency of internal combustion engine combined with open steam Rankine cycle recovering water and waste heat”,
International Journal of hydrogen Energy, Vol.35, No.4, pp. 1430-1442.
6. Farzaneh-Gord (2010) “A Study on waste heat recovery using natural gas in IC engine”, Applied Thermal Engineering, Vol.16, No.9, pp. 163-173.
7. Garimella S., Determen J.M., and Meacham S. (2011) “Micro channel component Technology for System-wide Application in Ammonia/Water Absorption Heat pumps”, International Journal of Refrigeration, Vol.34, No.4, pp. 1184-1196.
8. Gunerhan H. and Hepbasli A. (2005) “Utilization of basalt stone as a sensible heat storage material Energy”, Source, Vol.27, No.7, pp. 1357-1366. 9. Horuz I. (1999) “Vapour absorption refrigeration in road transport vehicles”, Thermal Science, Vol.125, No.5, pp. 48-58.
10. Hilalil I. and Soylemez M.S. (2008) “Optimum sizing of exhaust gas-driven automotive absorption cooling systems” Experimental Thermal and Fluid Science, Vol.32, No.3, pp. 655-660.
11. Husain Q., Brigham D. and Marienville C. (2009) “Thermoelectric Exhaust Heat Recovery for Hybrid vehicles,” SAE Internal J. Engines, Vol.30, No.6, pp. 1201-1327.
12. Korobitsyn M. (2002) “Industrial applications of the air bottoming cycle”, Energy conversion and Management, Vol.43, No.3, pp. 1311-1322.
13. Mostafavi M. and Agnewt B. (1997) “Thermodynamic analysis of combined diesel engine and absorption refrigeration unit-naturally aspirated diesel engine”, Applied Thermal Engineering, Vol.17, No.2, pp. 471-478.
14. Pandiyarajan V., Chinna Pandiyan M., Malan E., Velraj E., Seeniraj R.V. (2011) “Experimental investigation on heat recovery from diesel engine exhaust using finned shell and tube heat exchanger and thermal storage system,” Applied Energy, Vol.88, No.5, pp. 77-87.
15. Srinivasan A. (2003) “A study on exhaust waste recovery in IC enging using ORC”, Applied Thermal Engineering, Vol.23, No.8, pp. 757-767.
16. Teng H. (2008) “Achieving high engine efficiency for heavy-duty diesel engine by waste heat recovery using critical organic-fluid Rankine Cycle”, Vol.01, No.6, pp. 352-360.
17. Vaja I., Gambarotta A. (2010) “International combustion engine (ICE) bottoming with organic Rankine cycles”, Vol.35, No.9, pp. 1084-1093.
18. Venkatarathnam G., and Sarangi S. (1990) “Matrix Heat Exchangers and their Application in Cryogenic Systems”, Cryogenics, Vol.30, No.6, pp. 907-918. 19. Vlaskos I., Feulner P., Alizadeh A. and Kraljevic I. (2010) “Exhaust gas Heat Recovery on Large Engines, potential, opportunities, Limitations”, Vol.25, No.2, pp.
995-1054.
20. Wojciechowski K.T., Schimdt M., Zybala R., Merkisz J., Fuc P. and Lijewski P. (2010) “Comparison of waste heat recovery from the exhaust of a spark ignition and a diesel engine”, Vol.39, No.7, pp. 2034-2038.