Available Online atwww.ijcsmc.com
International Journal of Computer Science and Mobile Computing
A Monthly Journal of Computer Science and Information Technology
ISSN 2320–088X
IJCSMC, Vol. 2, Issue. 11, November 2013, pg.230 – 238
RESEARCH ARTICLE
AUTHORSHIP PATTERN AND
COLLABORATIVE RESEARCH IN
BIOINFORMATICS
Amsaveni.N1, Manikandan.M2, Manjula.M21
Assistant professor, Department of Library and Information Science, Bharathidasan University, Trichy-24, India 2 Ph.D research Scholars, Dept. of Library and Information Science, Bharathidasan University, Trichy-24, India
[email protected]; [email protected]; [email protected]
Abstract
This article deals with the authorship collaboration research is a well-recognized feature of the modern science and there has been a reliable trend towards enlarged collaboration in all branches of science and technology during the present century. It has also been found that the rate of increased in multiple authorship pattern mottled considerably with subject area. Totally 91655 authors were produced 17318 articles in this subject of bioinformatics. 9.77 percent of articles were single authors’ contribution. 90.17 percent of articles produced by collaborative authors. Two authors team has produced more articles and six authors team has highest number of authors.
Keywords: Authorship pattern; degree of collaboration; h-index; bioinformatics; Scientometric; Scattering
I. Introduction
II. Objectives of the Study
The specific objectives of the study are to determine the: a) authorship pattern ;
b) proportion of single vs multi authored papers;
c) To determine the degree of research collaboration on Bioinformatics literature.
III. Methodology and Materials
Bibliometrics and Scientometrics tools and techniques are the application of statistical methods to written communication has been measured as appropriate and non-reactive tools for studying collaboration in every research. Hence, the investigators have employed this methodology for studying authorship pattern and collaborative research in Bioinformatics research productivity. Bioinformatics research articles were download the database in Web of Science during the period 1999 to 2013, it includes the databases of SCI (Science Citation Index), SSCI (Social Science Citation Index) and AHCI (Arts and Humanities Citation Index)). The search key term has ‘bioinformatics’ has been used for the purpose of collection of data, required for the study. Authorship data regarding the number of papers, number of authors for each paper in different types of documents was collected from the database. Further, the data was tabulated using by the software’s of Histcite, VOS viewer and MS-Excel and further analyzed for the purpose of interpretation and discussion.
IV. Results and Discussion
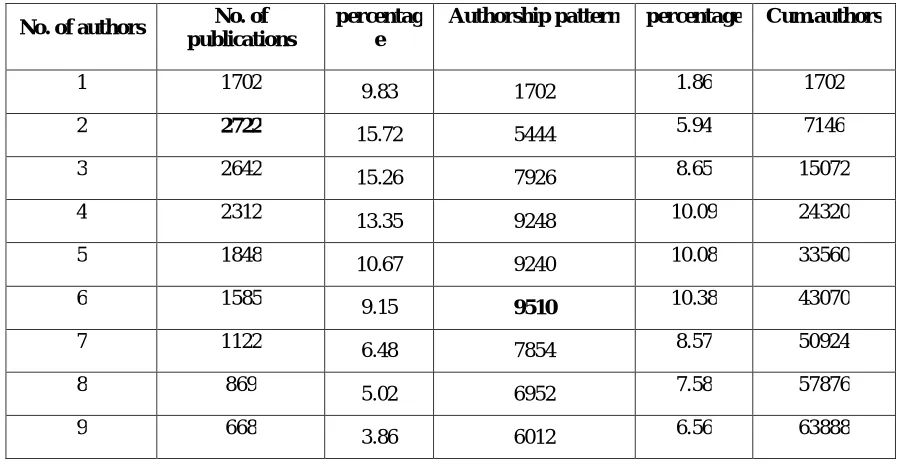
The below table 1 reveals that the maximum number of papers was two authored (15.72 %) when compared to three authored (15.26 %.); four authored (13.35 %); five authored (10.67 %); single authored (9.83 %); six authored (9.15 %) respectively. Followed by seven authored (6.48 %) and eight to thirteen authored contributions are below 5 percent. Above thirteen authored contributions are measured below one percent of articles. Six authors team has been in highest number of contributors. Thus, indicating very clearly the increased trend towards multiple authorship productivity in the field of Bioinformatics.
Table 1: Showing the authorship pattern in Bioinformatics research output
No. of authors No. of
publications
percentag e
Authorship pattern percentage Cum.authors
1 1702 9.83 1702 1.86 1702
2 2722 15.72 5444 5.94 7146
3 2642 15.26 7926 8.65 15072
4 2312
13.35 9248 10.09 24320
5 1848 10.67 9240 10.08 33560
6 1585 9.15 9510 10.38 43070
7 1122 6.48 7854 8.57 50924
8 869 5.02 6952 7.58 57876
10 464
2.68 4640 5.06 68528
11 322 1.86 3542 3.86 72070
12 243 1.40 2916 3.18 74986
13 179 1.03 2327 2.54 77313
14 150 0.87 2100 2.29 79413
15 88 0.51 1320 1.44 80733
16 66 0.38 1056 1.15 81789
17 62 0.36 1054 1.15 82843
18 43 0.25 774 0.84 83617
19 24 0.14 456 0.50 84073
20 22 0.13 440 0.48 84513
21 23 0.13 483 0.53 84996
22 17 0.10 374 0.41 85370
23 20 0.12 460 0.50 85830
24 13 0.08 312 0.34 86142
25 16 0.09 400 0.44 86542
26 & above 96 0.55 5113 5.58 91655
Total 17318 100 91655 100
Degree of collaboration
Table 2: Showing Degree of collaboration in Bioinformatics research output
Year
Single authors Multi authored
Total Degrees of
Collaboration
No of output % No. of output %
1999 53 3.11 75 0.48 128 (0.73) 0.59
2000 95 5.58 164 1.04 259 (1.49) 0.63
2001 119 6.99 252 1.60 371 (2.13) 0.68
2002 134 7.87 413 2.63 547 (3.14) 0.76
2003 124 7.29 615 3.91 739 (4.24) 0.83
2004 128 7.52 847 5.39 975 (5.60) 0.87
2005 155 9.11 1007 6.41 1162 (6.67) 0.87
2006 142 8.34 1116 7.10 1258 (7.22) 0.89
2007 118 6.93 1192 7.58 1310 (7.52) 0.91
2008 123 7.23 1253 7.97 1376 (7.90) 0.91
2009 117 6.87 1420 9.04 1537(8.82) 0.92
2010 114 6.70 1664 10.59 1778 (10.21) 0.94
2011 109 6.40 1849 11.77 1958 (11.24) 0.94
2012 104 6.11 2125 13.52 2229 (12.8) 0.95
2013 67 3.94 1727 10.99 1791 (10.28) 0.96
Total 1702 9.77 15716 90.23 17418 0.90
Prolific authors
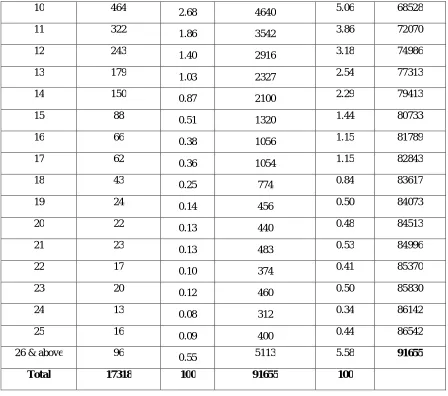
Out 91655 authors, 2310 authors were meet thoreshold contributing minimum number of documents 5 authors. For each of the 2310 authors, the number bibliographical coupling links will be calculated. The authors with the largest number of links will be selected. 2310 authors were selected. Using by the VOSviewer clustering map indicated the above information.the below table derived from VOSviewer for knowing the prolific authors and their contributions. Identifying from the below map and table, Katoh, M (276 articles, 91 h index, 4227 LCS, 6708 GCS and 340 colloaborative authors) is the most productive author in the field of Bioinformatics and dominated in first rank position, followed by
Table 3: Showing the prolific authors in Bioinformatics research output
Figure 1: Scattering of Label view of prolific authors in bioinformatics research output
Table 4: Showing the document wise analysis of Bioinformatics research output
S.No Document type Pub. Records Percent TLCS TGCS
1 Article 12934 74.3 20673 256690
2 Review 2034 11.7 3914 60430
3 Article; Proceedings Paper 1080 6.2 1059 12967
4 Editorial Material 613 3.5 721 6345
5 Meeting Abstract 445 2.6 4 36
6 Review; Book Chapter 87 0.5 164 2454
8 Software Review 41 0.2 10 653
9 Letter 38 0.2 41 215
10 Article; Book Chapter 29 0.2 4 64
11 Correction 28 0.2 1 8
12 Book Review 14 0.1 1 1
13 Database Review 6 0.0 0 92
14 Biographical-Item 3 0.0 1 2
15 Reprint 3 0.0 0 3
16 Editorial Material; Book Chapter 1 0.0 0 0
Table 4 reveals that the 16 types of published documents in the subject of bioinformatics, Such as; journal article, review, articles in conference proceedings, editorial material, meeting abstract, review in book chapters, news item, software review, Letter, articles in book chapter, correction, book review, database review, biographical item, reprint and editorial material in book chapter). Among those, 74.3 percent of publications were in the form of journal articles (12934 articles, 20673 TLCS and 256690 TGCS) dominated the highest contribution.
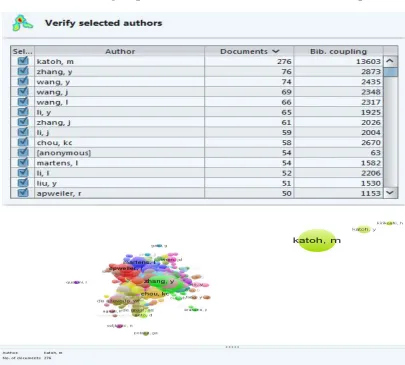
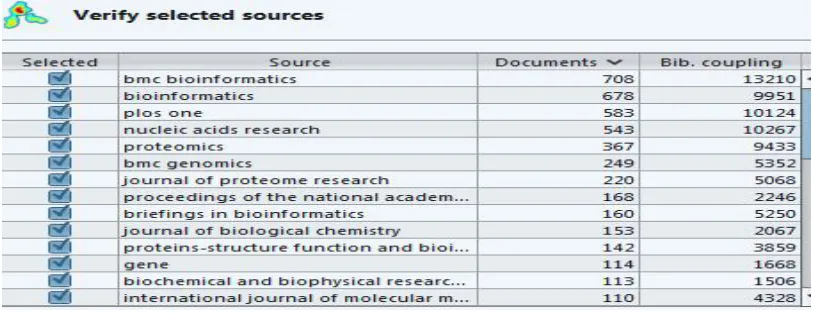
The table 5 reveals that the prolific journals in the subject of bioinformatics. 2820 sources, in which 39 journals were appearance of more than 50 articles. The journal of ‘bmc Bioinformatics’ has published 708 articles during the sample period and its dominated the first rank position in publication productivity in bioinformatics, and it earned the values of 10308 TGCS; 45 h-index where the contributed authors were 3291 and followed by the journal of ‘Bioinformatics’ has publisehd 678 articles and ranked second position in the total productivity. The remaining selected journals were contributed their publications is below 600 article in the field of bioinformatics.
The below figure 2 indicates that the slected 39 journals scattering in label view. its clearly showed that variation in their colours and sizes of circles. The result related to the above table analysis.
Figure 2: scattering of Label view of prolific journals in bioinformatics research output
Histriographic Analysis
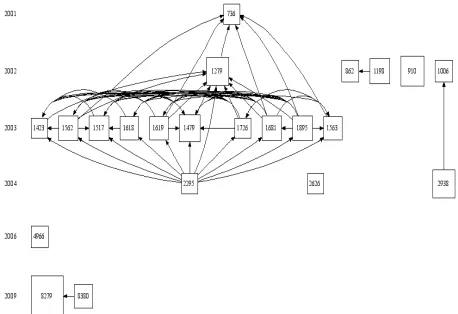
The sample records were exported to HistCite software for data extracting to acquire a large list of 17418 articles written by 91,655 authors along with 761,464 times cited references during 1999 to 2013, and their local and global citation scores (LCS and GCS). It is found from this hisriograph map analysis 70 authors were contributed the selected 30 nodes out of 70 authors, only one author (Katoh, M) has contributed 24 times, four authors were participated only two times and remaining 65 authors were contributed each once in the research of bioinformatics. Totally 14 journals were been in the selected 30 nodes, among these the journal of ‘International Journal of Molecular Medicine’ has mapped in nine times, followed by the journals of ‘International journal of oncology’ and ‘Nucleic acids research’ were produced each 4 articles; the journals of ‘Bioinformatics’ and ‘Proceedings of the National Academy of Sciences of the united States of America’ were produced each two articles; and the remaining nine journals were produced each one articles. The highest values of the selected 30 nodes, the Local cited reference is 40; the cited reference is 89; The Total Local Citation Scores is 281 and the Total Global Citation Scores is 5938 has measured from this analysis.
Figure 3: Historiographic mapping of top 30 nodes and LCS scales
The article number of 1279th has written by the authors of “Katoh M” has published in the journal
of “International Journal of Molecular Medicine” at the year of 2002 with 89 times cited references; 135 LCS
and 146 GCS scaled and it having nine links of quoted and cited. This article dominated the highest CR value. The article number of 121st has written by the authors of “Perkins DN, Pappin DJC, Creasy DM, Cottrell JS” has published in the journal of “Electrophoresis” at the year of 99 with 33 times cited references; 281 LCS and 3978 GCS scaled and it does not have any kind of links. This article dominated the highest LCS and GCS values. The article number of 2295th has written by the authors of “Katoh M, Katoh M” has published in the journal of “International Journal of Molecular Medicine” at the year of 2004 with 48 times cited references; 71 LCS and 77 GCS scaled and it having eleven links of quoted. This article dominated in the highest number of links in whole 63.
V. Conclusion
The article mainly dealt with the authorship pattern and collaborations in the area of Bioinformatics research output. In the field of science and technology, the studies have conventional the increased growth of multiple authorship and collaborative research. The following facts are derived from this analysis;
publications; 2012 having highest publications; the form of journal type doucment produced more number of articles and 90 percent of authors were contributed at collaborative produced. It is essential that in the sphere of Science and Technology large scale studies are carried out to identify the trends in the collaborative research.
References
[1] Amsaveni. N & Vasanthi. R. (2013). Authorship Pattern and Collaborative Research in the Field of Network Security. Indian Journal of Applied Research..3 (1): 52-54.
[2] Amsaveni, N & Vasanthi, R (2012). Mapping of Green Biotechnology Research: A Scientometric Analysis, Journal of Advances in Library and Information Science, Vol. 1. No.4. 2012. pp. 181-185.
[3] A.Manimekalai & N.Amsaveni (2012). Collaborative Research Publications of Genetics. in India.
Journal of Advances in Library and Information Science, Vol.1.(2), pp-88-93.
[4] Cronin, Blaise. Shaw, Debora and Barre, Kathryn La. (2003). A cast of thousands: Coauthorship and subauthorship collaboration in the 20th century as manifested in the scholarly journal Literature of psychology and philosophy, JASIST, 54 (9):855–871.
[5] Price, Derek J. deSolla. (1963). Little science, Big science. (pp.78). New York: Columbia press.