Abstract. Studying spallation damage with a cylindrical configuration allows for a nat-ural recollection of the damaged material under proper driving conditions. Additionally, the damaged material can come to a complete rest without the application of further stop-ping forces. Specific areas of research include the damage initiation regime in convergent geometry, behavior of material recollected after damage, and effects of convergent geom-etry on the material response. Such experiments produce unique strain and shear stress states, motivating improvements in existing computational material models and increas-ing the predictive capabilities of codes. A LANL/VNIIEF joint experimental series has produced cylindrical aluminum failure initiation data and studied the behavior of material recollected after damage initiation and after complete failure. In addition to post-shot col-lection of the damaged target material for subsequent metallographic analysis, dynamic in-situ experimental diagnostics include velocimetry and transverse radial radiography. This paper will discuss the current experimental status.
1 Experimental program
Los Alamos National Laboratory (LANL) and The All-Russian Research Institute of Experimental Physics (VNIIEF) have developed a joint experimental series to gather data on damage in a (pre-sumably) well-understood material, i.e. aluminum, to motivate development and validation of damage models for computational tools. Specifically, research is centered on mechanisms which control dam-age initiation and fracture and on the behavior of previously damdam-aged material after cracks close. Since these single-physics experiments use a cylindrical configuration to access unique strain and shear stress states, they allow experimental validation of the multi-dimensional aspects of existing models.
The experimental driver is a VNIIEF-designed helical flux compression generator with explosive switches to control the current pulse shape and duration. The current wave form produced is a single pulse with a peak current of 4.5–10.5 mega ampere (MA), depending on the charge voltage and the generator’s compression factor. A VNIIEF-designed shielding system placed between the generator and the load provides protection of the load and diagnostics from any explosive debris produced by the generator.
The shock profile in the target can be varied through changes in the impactor and target geometry and through changes in current peak and duration. In a cylindrical configuration, recollection and closure of voids can occur naturally under proper driving conditions, with no additional application of force needed to bring the system to a resting state. The chosen configuration simplifies target recovery for post-experimental metallographic analysis. In addition to the target recovery, diagnostics fielded on the experiments include free-surface velocimetry measurements using visar or photon Doppler velocimetry (PDV) and current measurements using Faraday induction loops or B-dot probes.
Fig. 1. Measured RD-0 velocity as a function of time in black; pre-experiment calculated velocity in red; post-experiment calculated velocity in green, target impact in blue.
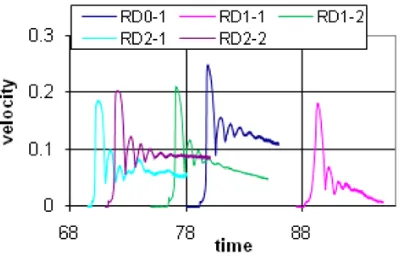
Fig. 2. Target velocimetry for RD-0, RD-1 and RD-2.
2 Russian-damage-0, -1 and -2
The first group of three experiments, designated RD-0, -1 and -2, was intended to obtain data about the initiation of voids and damage for aluminum in a cylindrical configuration. In order to compare the results with planar gas gun experiments, the impacting liner was in free flight with no driving current remaining in the system at the time of impact. The aluminum used in these loads is a specially fabri-cated high purity (∼98.5%) alloy. Due to its unique nature, there is very little data available to develop a set of strength parameters, so initial calculations used Aluminum 1100-O values.
The LANL-designed and fabricated experimental loads usually contain two targets in each load. Because this system used a driver new to the LANL team, the first experiment’s load consisted of a bare liner on one half of the load and a target in the other half of the load. This allowed for velocimetry measurements using a visar system on the inner surface of the impacting liner for use in calibrating the design calculations. The liner velocity measurement (units of m/s) is shown as a function of time (units ofµs) in black in Fig. 1. The blue vertical liner indicates impact with the target, determined by integration of the velocity signal. The red line is the expected liner velocity from pre-experiment calculations. Clearly, the liner did not behave as expected, but rather as if it were much stronger and less susceptible to dynamic strength hardening. Post-experiment parameter searches resulted in the calculated liner velocity shown in green, which matches the measured peak and impact velocities.
Damage State Full Voids Crack Crack Crack
RD-0
RD-1-T1
RD-1-T2
RD-2-T1
RD-2-T2
Fig. 3. Results of target metallography.
(in m/s), calculated liner impact velocity (in m/s), measured and calculated target peak free surface velocity (in m/s) and damage state seen in metallographic analysis. The RD-0 target free surface velocimetry was used to adjust target strength parameters to account for the unique material. As can be seen from the table, the resulting calculations for target peak free surface velocity in experiments RD-1 and RD-2 are reasonably close to the measured values. As a comparison, damage initiation in planar flyer plates occurs in the range between 198 and 210 m/s for this material. At 198 m/s, only a few voids were visible. At 210 m/s, a full crack had formed.
Figure 3 shows images from metallographic analysis of the recovered targets. RD-0 exhibits a complete failure state in the center of the target. RD-1-T1 exhibits a state of incipient failure, with only void formation visible. RD-1-T2 shows a complete crack in the center, with only voids on the edges. RD-2-T1 exhibits a state with a less complete crack and more voids, while RD-2-T2 has a more complete crack with voids still visible.
Faraday induction loop current (in MA) as a function of time (in s) measurements for RD-0 are shown in Fig. 4. The half-height pulse duration is 8µs, while the peak currents in the 3 traces vary between 4.88 and 4.91 MA.
3 Russian-damage-3, -4 and -5
Fig. 4. Current measurement for RD-0.
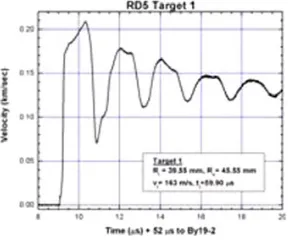
Fig. 5. RD-5 target 1 inner free surface velocity.
Fig. 6. Expansion of early time RD-5-T1 free surface velocity.
come to rest with no further input forces. To address the issues raised in the first experiments about the motion of the liner prior to impact, a velocimetry window was placed in the glide plane between the two targets.
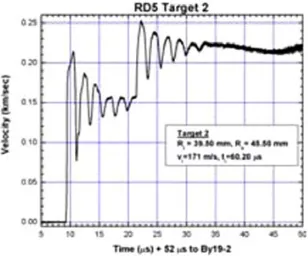
Figures 5–8 are the visar measurements of the target inner free surface velocity for the two targets in RD-5. Figures 5 and 7 show the full signal for targets 1 and 2, respectively, while figures 6 and 8 are enlargements of the early-time signals. The signals for both targets show shock breakout, incipient spall, ringing, then a second shock-free push from the liner, followed by more ringing.
Fig. 7. RD-5 target 2 inner free surface velocity.
Fig. 8. Expansion of early time RD-5-T2 free surface velocity.
Fig. 9. Liner inner free surface velocities.
speeds across the window opening. The liner velocity then drops offas the liner attempts to push a fairly thick piece of copper and the current is removed.
Table 2. Summary of RD-3, RD-4 and RD-5.
RD-3 T1 RD-3 T2 RD-4 T1 RD-4 T2 RD-5 T1 RD-5 T2
R, outer 45.45 45.40 45.65 45.60 45.55 45.50
R, inner 39.45 39.40 39.65 39.60 39.55 39.50
Impact time 61.52 61.88 59.79 60.20 59.90 60.20
Vel, impact 137.0 146.0 122.0 130.0 165.0 173.0
Vel, impact (calculated) 133.0 138.7 120.3 127.2 162.4 170.8
Breakout time 62.30 62.75 61.17 61.53 61.34 61.54
t, brk (calc) 63.00 63.34 61.60 62.0 63.58 61.88
Vel, peak free surface 156.0 206.0 162.0 163.0 209.0 216.4
Vel, peak fs (calculated) 170.6 176.8 161.0 169.4 216.4 225.9
Damage State None None None None Voids Voids
Fig. 10. Expansion of early time liner free surface velocities.
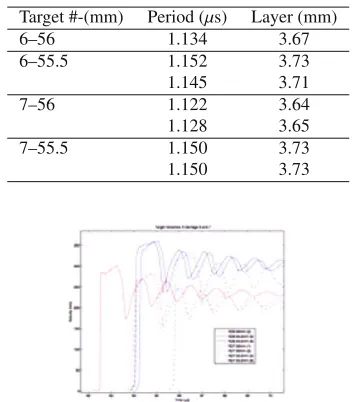
Fig. 11. Target velocimetry for RD-6 and RD-7.
4 Russian-damage-6 and -7
The third group of experiments, RD-6 and -7, were designed to obtain data about material recollected after complete fracture. Achieving complete fracture required a higher initial impact velocity than the previous set of experiments and recollection of the spalled layer required a longer driving time. Therefore, the liner and target were enlarged, a thinner liner was used, the liner to target distance was increased, and PDV velocimetry was used to decrease the size of the central measuring unit, while allowing multiple measurements of each surface.
Fig. 12. Expansion of early time RD-6 and RD-7 velocimetry.
Fig. 13. RD-7 current measurement.
The targets in these two experiments collapsed to the center rather than stopping, as in earlier ex-periments. The current measurements, as shown in Fig. 13 for RD-7, give an explanation. The lingering current tail continues to push the liner into the target until quite late times.
Target metallographic analysis for RD-3 through -7 continues. Initial results indicate a region of intense deformation, but it is unclear how many voids or cracks still remain in the material after recollection.
5 Conclusions
The experimental series presented has obtained data on damage in aluminum using a cylindrical con-figuration. Both damage initiation and post-damage recollection have been studied. The current tail in the last two experiments was enough to overcome the mechanical strength of the assembly, pushing it to collapse on center. A different switch will be used in the two remaining experiments of the series to allow the target to stop before impact with the central measuring unit.