6. Greater use of research
projects and facilities in exten-
sion education
through field
days and tours.
7. More adult activity in the
range judging program.
8. Greater emphasis on 4-H
range management. Range proj-
ects adapted to older 4-H mem-
bers are generally inadequate. A
going youth program in range
management continues to be the
best adult program also.
9. Develop a county range
management advisory commit-
tee or a range management sub-
committee within the county
program projection committee.
State and national extension
range management
programs
can conceivable be strengthened
by:
1. Providing a state range
management specialist in each
range state to coordinate and de-
velop the state program. In the
western states, several still have
no full-time extension
range
management specialist.
2. Greater exchange of pro-
grams, materials, and ideas be-
tween state range specialists.
3. Active participation of state
range specialists
and county
agents in the American Society
of Range Management.
4. A greater role by state and
local range specialists in applied
research. The line between ex-
tension and applied research has
become faint and many adminis-
trators suggest it should disap-
pear. Regional centers for both
extension and research
offer
many advantages.
5. Give more attention to out-
of-state research while promot-
ing more research within a state.
6. Providing a federal exten-
sion range management special-
ist or improving coordination at
the federal level of animal, agro-
nomic, and economic aspects of
range management.
7. Continue biennial planning
conferences on a regional basis
for animal husbandry and range
management specialists.
Summary
The newness of the science of
range management and its in-
terrelation with other sciences
requires continued attention to
maintaining the identity of the
extension range management
program while insuring its co-
ordination with related
pro-
grams in animal husbandry,
crops, soils, and agricultural eco-
nomics. Extension organization
at the federal, state, and county
level must consider the highly
specialized nature of the science
of range management.
Chairmen of departments in
the land grant universities hav-
ing range management responsi-
bilities will be required to give
greater attention to the exten-
sion program if the latter’s ef-
fectiveness in disseminating sub-
ject matter is to be at par with
the resident teaching program.
Applied research must continue
in high priority and activity in
order to provide the basis of a
sound extension range manage-
ment program.
Frequency Sampling of Blue Grama Rangel
D. N.
HYDER, R. E. BEMENT,E. E.
REMMENGA, AND C. TERWILLIGER, JR. Research Agronomist, Research Range Conservationist (Crops Re- search Division, Agricultural Re- search Service, U.S. Department of Agriculture), Experiment Station Statistician, and Associate Range Conservationist (Colorado Agricul- tural Experiment Station); Fort Col- lins, Colorado.Highlight
A quadraf 2 inches square safis- faciorily sampled frequency distribu- tion of blue grama but a comple- menfary quadrat 16 inches square was ne&&d to sample associated species. A tallvina iechniaue was de- veloped usiG b;ads aid plastic tubes.
The frequencies that species are found present in quadrats of appro- priate sizes represent an abstraction
or blend of density (number of plants per unit area) and dispersion characteristics. Since these charac- teristics of perennial vegetation are relatively stable seasonally but vari- able with sites and grazing treat- ments, frequency-sampling should be useful for the classification of sites and responses to grazing (Han- son, 1934). If so, advantages of sim- plicity, objectivity, and speed should
1 A contribution of the Central Plains Experimental Range, Crops Re- search Division, Agricultural Re- search Service, U.S. Department of Agriculture, and Colorado Agricul- tural Experiment Station, Colorado State University, Fort Collins. Pub- lished with the approval of the Director of the Colorado Agricul- tural Experiment Station as Sci- entific Series Paper No. 923. The authors thank Dr. R. M. Hansen, Associate Range Biologist, CoZo- rado Agricultural Experiment Sta- tion, for advice regarding tally techniques applicable to frequency sampling.
be gained with the substitution of frequency techniques for commonly used cover and basal area techniques. This paper gives the results of studies undertaken to determine procedures for frequency sampling of blue grama range. The develop- ment of frequency-sampling tech- niques required the selection of ap- propriate quadrat sizes, the deter- mination of efficient allocations of sampling units, the estimation of a satisfactory sample size, and the in- strumentation of data recording. Frequency (p) is defined as p = m/n where m is the number of quadrats containing a given species and n is the total number of quadrats observed. We express frequencies in percentage.
paper (Hyder, et al. 1963). An ap- propriate quadrat size is defined as one that allows a frequency of 63 to 86 percent for a “most frequent” species. Thus, trial-and-error sam- pling was undertaken with quadrat sizes of 42, 32, and 22 inches (4 by 4, etc.) to find one that sampled blue grama (Bouteloua gracilis) in this frequency range. A primary objec- tive in frequency sampling is to ob- tain mean frequencies larger than 5 percent but smaller than 95 per- cent for all species of interest be- cause low and high mean frequen- cies can result from badly skewed distributions. Since a quadrat small enough to sample blue grama at a desired frequency was effective for only 4 other species, two quadrat sizes were needed to sample this vegetation. The small one was de- termined by trial and error and a large complementary one by theoret- ical relations between areas and fre- quencies .
Complementary quadrat sizes were used separately in sampling to de- termine efficient allocations of sam- pling units. A macroplot 200 feet square was sampled three times with each quadrat size. Each sample in- cluded 600 quadrats allocated 25, 50, or 100 per transect and requiring 24, 12, or 6 transects per sample, respectively. The transects were per- pendicular to a base line and located at restricted random distances along it, half the transects being restrict- ed to the first 100 feet and half to the second 100 feet. Quadrats were lo- cated systematically along the tran- sects with 8-foot intervals among 25 quadrats, 4-foot intervals among 50, and a-foot intervals among 100.
Efficiency is determined by both cost and variance considerations. We measured the time required to estab- lish 24 transects and prepare 24 data
sheetsindependentof sampling
times, and the times required to place and read quadrats allocated 25, 50, and 100 per transect inde- pendent of transect establishment. The times required were expressed in minutes as transect/quadrat ra- tios representing cost components ct/cq. These ratios enter the calcula- tion of an optimum number of quad- rats per transect (kept). Variance components for quadrats (~~2) and transects (s?) were computed for each of the 6 frequency samples by the equations
SP 2 = k(zpq) /n(k-1) (1)
Zp2 - (zp) 2/n sq2
St2 = - - (2)
n- 1 k
where k is the number of quadrats per transect, n is the number of transects in the sample, p is the fre- quency percentage that a given species is present on any transect, and q is 100-p (Cochran, 1953). The variance components were entered with cost components into the cal- culations of
kept = v/s92 ct/sts cq (3)
Having determined appropriate quadrat sizes and optimum numbers of quadrats per transect, we esti- mated the number of transects (N) needed at appropriate levels of pre- cision by the equation
N = 4nV,/ (e.c.i.) 2 (4)
where n is the number of transects already sampled, V, is the variance of the mean frequency percentage of a given species, and e.c.i. is an expected-confidence-half interval
(Snedecor, 1956, p. 501). Since vari- ances are correlated with frequency percentages, a complete set of ex- pected-confidence-half intervals were computed from
e.c.i. = -t 2vpq/n-1 (5)
where p is the frequency percentage, q is its complement (100-p), and n is the total number of quadrats
(Snedecor, 1956, p. 502). This cal- culation determines for each fre- quency percentage an average con- fidence-half interval that can be used in equation 4 even though con- fidence limits for binomial distribu- tions are non-symmetrical (Snede- car, 1956, p. 4).
Frequency percentages were de- rived for all species encountered. To be present in a given quadrat, the center of an individual plant or half its area must be inside the quadrat frame. Our ground rules defined single stems or tillers viewed at ground level as individuals of all grasses, forbs, and shrubs. A lobe was described as an individual of cactus (Opuntia polyacantha). We would have preferred a clump as an individual grass, but clumps usually are indistinct on this range. The ground rules for grasses and cactus obviously invoke a localized con- tagiousness in the dispersion of units identified as individuals. The species sampled at frequencies >5 percent but < 95 percent are treated statis- tically.
Forty-eight 100 by 75-foot macro-
plots, located on a “sandy plains” range site grazed heavily since 1939, were sampled in 1963 and sum- marized to estimate the number of macroplots needed per site assuming the same precision as obtained per macroplot.
Results
Appropriate Quadrat Sizes.-A 22, inch quadrat included blue grama in 70 percent of all placements, but frequencies with 42 and 32-inch quadrats exceeded 86 percent. From equation 7, it is estimated that a 1.82-inch quadrat would sample blue grama at 63 percent and that a 2.62-inch quadrat would sample it at 86 percent. Smaller and larger quadrats would be less appropriate. Frequencies were above 5 percent for only five species with the as-inch quadrat (Table 1) , and a comple- mentary large quadrat size was needed.
To compute the theoretical maxi- mum allowable difference in areas of a complementary pair of quadrat sizes, we assume that a frequency of 5 percent in a small quadrat is marginal and that such a species should be sampled at 95 percent, the upper marginal limit, with a larger quadrat. If the individuals of a species are dispersed randomly, the density (number) per quadrat (d) is given by
d = - log, (l-p/100) (6)
Table 1. Frequency percentages of the eight most common species using quadrafs of appropriate sizes.
Frequencies using quadrats
measuring
Species 22 in. 162 in.
~-
- (Percent) - Bouteloua gracilis
(H.B.K.) Lag. 70 100
Buchloe dactyloides
(Nutt. )Engelm 25 61
Festuca octojlora
Walt. 16 52
Carex heliophila
Mack. 14 57
Opuntia polyacantha
Haw. 8 53
Sphaeralcea coccinea
(Pursh) Rydb. 1 20
PZantago purshii
Roem. & Schult. 1 18
Leucocrinum montanum
in which p is the frequency per- centage (Curtis and McIntosh, 1950). Letting p1 = 5 percent, then d = - log, (.95) = .05 per small quadrat of area al. Subsequently, we cal- culate the area (az) of a large quad- rat giving p2 = 95 percent by the equation
1 mg1oq1 - logloq2) +.4343 D al] a2 =
.4343 D al (7)
in which ql = lOO-ppl = 95, q2 = 100 -pp2= 5, and D= d = .05 if al = 1 (Hyder, et al., 1963).
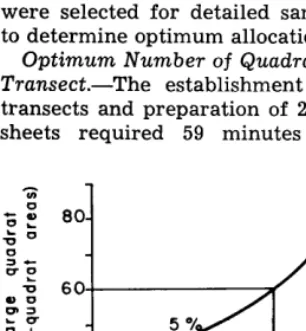
Thus, a2 = [ (log 95 - log 5) + (.4343) (.05) (l)] / (.4343) (.05) (1) = 60; meaning that the area of a large quadrat can be as much as 60 times larger than that of a small quadrat. If a small quadrat samples a randomly dispersed species at a frequency of 5 percent, a larger quadrat with 60 times the area of the small one should sample that same species at a frequency of 95 percent.
To compute the lower limit in the size of a complementary large quadrat, we assume that a species sampled at 10 percent with a small quadrat should be sampled at 90 percent with the large one. Thus, the large quadrat would be at least 22 times the area of the small one. These limits in complementary quadrat sizes are plotted in Figure 1. Quadrat sizes of 22 and 162 inches were selected for detailed sampling to determine optimum allocations.
Optimum Number of Quadrats per Transect.-The establishment of 24 transects and preparation of 24 data sheets required 59 minutes - 2.46
80-
85 % 90 95 99
Frequency in a large quadrat
FIGURE 1. The area of a large quadrat needed to sample a species at a fre- quency > 85 percent when its frequency is 5 or 10 percent in a small quadrat.
Table 2. Transecf/quadrat cosf ratios (c~/c,), quadraf/fransecf variance ratios (Q/s?), and optimum numbers of quadrais per franseci (k,,,) as calculafed from 6 independent frequency samples.
Sample description Sample results1
Quadrat No. of quadrats No. of transects WCP $‘/s t2 kept size per transect (k) per sample (n)
22 inches 25 24 18/l 18/l 18
22 inches 50 12 24/l 16/l 20
22 inches 100 6 24/l 41/l 31
162 inches 25 24 6/I 14/l 9
162 inches 50 12 9/l 8/l 8
162 inches 100 6 11/l 6/l 8
1 Variance components s92 and St2 were averaged among species and ex- pressed in ratio form.
minutes per transect exclusive of sampling time. Sampling time per quadrat decreased with an increase in the number of quadrats per tran- sect, and was greater with the large quadrat than with the small one. Transect/ quadrat cost ratios com- puted from sampling times (Table 2) indicate greater efficiency when the number of quadrats are in- creased relative to the number of transects.
Variance components were com- puted for individual species in each sample. In general, variances de- creased with more quadrats per transect and were larger for the 16 by 16-inch quadrat than for the 2 by a-inch one. Quadrat/transect variance ratios averaged among spe- cies varied from 41/l to 6/l (Table 2), and enter equation 3 for the calculation of koPt.
The optimum number of quadrats per transect (kept) was calculated from cost and variance ratios in each of the 6 samples. Average results were 23 quadrats per transect with the 2 by 2-inch quadrat and 8 with the 16 by Is-inch one (Table 2). The range in k opt is wider with the small quadrat than with the large one.
Number of Transects per Sample. -Expected-confidence-half intervals
were computed by equation 5
(Hyder, et al., 1963). In these com- putations, n-l was given a value of 100 so that the half interval would be 10 percent at a frequency of 50 percent. Smaller or larger half in- tervals can be computed where more or less sampling precision is needed. The expected-confidence-half inter- vals enter equation 4 for estimating the number of transects needed in a sample. Sample sizes were estimated from variances with each quadrat size when 25 quadrats were observed
in each of 24 transects. Sample sizes estimated in this way vary greatly among species, but average 8 tran- sects (200 quadrats) with the small quadrat and 9 transects (225 quad- rats) with the large one (Table 3).
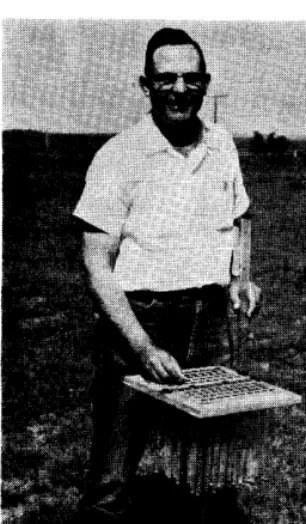
Data Recording.-Since frequency sampling accumulates data rapidly, an instrumentation technique can improve accuracy and speed. A line- connected dot system of 4 dots and 6 lines was used to record species presences as called. But field errors and office tabulation requirements indicated a need for an improved technique. Since we need to deter- mine the frequencies of as many as 80 species in a series of samples, commercial tally registers were un- satisfactory. The recording tech- nique developed involves dropping 9 mm. plastic beads into 10 mm. i.d. clear plastic tubes supported in a wooden frame (Figure 2). The tubes are mounted in 10 units of 10 tubes each and prelabeled so far as possi- ble with 4-letter species symbols in alphabetical order. An observer calls out the species present and a re-
Table 3. Number of fransecfs need- ed per sample when 25 quadrafs are faken per transect.
Number of transects needed with quadrat sizes of Species 22 in. 162 in. Bouteloua gracilis 5
Buchloe dactyloides 15 20 Festuca octoflora 14 19 Opunntia polyacantha 4 3
Carex heliophila 3 9
Sphaeralcea coccinea 4
Plan tago purshii 6
Leucocrinum montanum 5
FIGURE 2. A recorder drops beads into labeled plastic tubes as an observer calls out the species present in quadrats.
corder drops beads into correspond- ing tubes. At the end of each tran- sect, the bead tallies are expressed in percent and recorded directly on printed record sheets that include columns for sample means and vari- ances.
Number of Macroplots per Site.- The 48 macroplots located on the “sandy plains” range site were sam- pled with nested 22 and 162-inch quadrats allocated 25 per transect with 10 transects per macroplot. Fre- quencies were recorded for each quadrat size. Ten species were re- corded at frequencies of 5 to 95 per- cent (Table 4). The number of macroplots needed for each of these species was estimated by equation 4.’ These estimates varied from 2 to 19 with a mean of 12.
Discussion
A pair of complementary quadrat sizes were selected for frequency sampling of blue grama range be- cause one small enough to sample blue grama at a frequency between 63 and 86 percent was suitable for only 4 other species. The small quadrat is 22 inches and the large one 162 inches. The area of the large quadrat is near the theoretical limit of 60 times the area of the small quadrat.
The optimum number of quadrats per transect was 23 with the small quadrat and 8 with the large one. However, sampling with a pair of quadrats would be more convenient if these were nested for simultaneous viewing, and furthermore, if the number of quadrats per transect allowed easy mental transformation to frequency percentages. Twenty or 25 quadrats per transect would be convenient and reasonably efficient for each quadrat size.
Ten transects (250 quadrats) per macroplot will sample most species within the limits of the expected- confidence-half intervals used. A sample size of 250 quadrats is less than half as large as those taken for the development of frequency sampling techniques. We used a macroplot 200 by 200 feet in size when sampling for efficient alloca- tions, but reduced this to 100 by 75 feet when sampling for site descrip- tion.
An average of 12 macroplots were needed in sampling the “sandy plains” range site with site precision equal to macroplot precision. This indicates considerably more varia- tion for some species on this range site than has been implied in site descriptions. If other sites are equal-
Table 4. Mean frequencies and num- bers of macroplofs needed fo sam- ple various species on fhe “sandy plains” range sife.
Number of macro-
Mean plots
Fre- needed
Species quencyl per site
Bouteloua gracilis 82 5 Opuntia polyacantha 43 18 Sphaeralcea coccinea 32 8 Aristida Zongiseta
Steud. 25 11
Sporobolus cryptandrus
(Torr.) A. Gray 19 11
Eriogonum effusum
Nutt. 19 19
Carex heliophila 16 16
Agropyron smithii
Rydb. 6 11
Stipa comata
Trin. & Rupr. 6 17
Gaura coccinea
Nutt. 5 2
1 Frequency in 22-inch quadrats for Bouteloua and in 162-inch quadrats for other species.
ly variable, vegetation descriptions for sites often may be drawn from inadequate samples. On the other hand, trends in species succession can be determined from internal variances from permanent macro- plots located on “key areas” and sampled in different years.
In the adaptation of these fre- quency sampling techniques to other sites, one should select an appro- priate quadrat size or a pair of com- plementary quadrat sizes, which may or may not be the same sizes that we selected for blue grama range. Since optimum efficiency in sampling is approached with a rather wide range in the allocation of sub-sampling units, a standard procedure of taking 20 to 25 quadrats (of each size) per transect may be considered convenient and reason- ably efficient for all sites. In sub- sequent application of the techniques we have established sample areas
(macroplots) 100 feet long by 75 feet wide and have sampled each with 10 transects of 25 quadrats (2 sizes nested) per transect (a total of 250 quadrats of each size per macroplot). The percentage of quad- rats containing each species is re- corded for each transect.
Summary
Experiments were conducted to determine appropriate quadrat sizes, efficient allocations of sampling units, satisfactory sample sizes, and data accumulation techniques for frequency sampling of blue grama range. We selected a 200 by 200-foot macroplot on representative range and determined a pair of appropriate quadrat sizes by trial-and-error sampling with several sizes. A small quadrat 22 inches was appropriate because it included blue grama, the most frequent species, in about 70 percent of placements. However, this small quadrat sampled only 4 other species at frequencies above 5 per- cent. Since we want to encounter nearly all species and to sample most of them at frequencies between 5 and 95 percent for statistical con- siderations, a large quadrat (162 inches) was needed to complement the small one. A large complemen- tary quadrat should be about 60 times the area of the small quadrat.
observed with each quadrat size making 6 independent samples. Quadrat/transect cost and variance components from these samples en- tered the calculation of the number of quadrats per transect needed for optimum efficiency. Eighteen to 31 quadrats per transect were most efficient with the small quadrat, and 8 or 9 were most efficient with the large one. When taking 25 quadrats per transect, 9 transects per macro- plot gave satisfactory sample pre- cision with each quadrat size. We suggest that 250 quadrats per macro- plot allocated 25 per transect are equally convenient and efficient, and that where a complementary pair of
quadrats is needed they may be nested for greater sampling con- venience.
The percentage of quadrats con- taining each species is recorded for each transect. A tallying technique developed involves dropping beads into plastic tubes as an observer calls out the species present in quad- rats. The tubes are mounted in 10 units of 10 tubes each and prelabeled with 4-letter species symbols in al- phabetical order.
Literature Cited
COCHRAN, W. G. 1953. Sampling techniques. Wiley, New York. 330 PP.
CURTIS, J. T. AND R. P. MCINTOSH. 1950. The interrelations of certain analytic and synthetic phytoso- ciological characters. Ecology 41: 434-455.
HANSON, HERBERT C. 1934. A com- parison of methods of botanical analysis of the native prairie in western North Dakota. J. Agr. Res. 49: 815-842.
HYDER, D. N., C. E. CONRAD, PAUL T. TUELLER, LYLE D. CALVIN, C. E. POULTON, AND FORREST A. SNEVA. 1963. Frequency sampling of sage- brush - bunchgrass vegetation. Ecology 44: 740-746.
SNEDECOR, GEORGE W. 1956. Statis- tical Methods. Fifth Ed. The Iowa State University Press, Ames. 534 PP.
TECHNICAL
NOTES
The Claypan Range Site in Northern Osage County
Oklahoma1
DON B. HAZELL
Assistant Professor of Biology, De- partment of Biology, Southeastern State College, Durant, Oklahoma
The Osage Hills of Oklahoma con- stitute an area which is world re- nowned for its bluestem-fattened cattle. According to Anderson
(1953)) “the Flint Hills of Kansas are joined on their southern end by the Osage range lands of Oklahoma, a region of similar grasslands.” This hilly region with gently rolling to- pography constitutes one of the last large segments of true prairie in’the United States.
The loamy prairie range site is the most important and is characterized by a fertile, deep upland soil (greater than 36 inches) made up of clay loams. These soils are nearly black, highly granular, and permit
IThis study is based in part on a dis- sertation submitted to Oklahoma State University in partial fulfill- ment of the requirements for the degree of Doctor of Philosophy. Financial assistance for this project was provided by Phillips Petroleum Company, BartZesviZZe, Oklahoma.
good root penetration, but moisture penetration is slow. The slow per- meability as well as the rolling to- pography with many steep winding ravines, makes cultivation difficult. Therefore, native grass is the most practical vegetation. Four important grass species, big bluestem (Andro- pogon gerardi Vitman), little blue- stem (A. scoparius Michx.), indian- grass (Sorghastrum nutans (L.)
Nash), and switchgrass (Panicum virgatum L.) dominate the region and are found growing on the loamy prairie site.
Many acres of claypan soils of the Parsons silt loam type are scattered in patchwork fashion over the region and were of concern in this study (Figure 1). These soils, which have 5 to 16 inches of medium acid and rather floury silt loam over a com-
FIGURE 1. Many acres of claypan soils are scattered throughout the region and were of