BACKGROUND DOCUMENT
The Value of Forest Ecosystems
A Report to The Secretariat
Convention on Biological Diversity
David W Pearce Corin G T Pearce
February 2001
DRAFT ONLY: NOT FOR QUOTATION OR REPRODUCTION
Contents
1 Introduction: forests, biodiversity and forest services
2 Forest values
3 Instrumental values and forest classifications 4 The nature of economic value
5 Estimates of forest economic values 5.1 Timber
5.1.1 Sustainable timber management versus conventional logging 5.2 Fuelwood and charcoal
5.3 Non-timber forest products (NTFPs)
5.4 Biodiversity, genetic information and insurance 5.5 Forest land conversion
5.6 Watershed protection
5.7 Carbon storage and sequestration 5.8 Tourism and recreation values
5.8.1 Tropical forests 5.8.2 Temperate forests
5.9 Amenity values
5.10 Option values and existence values 5.11 Changes in values over time
5.12 Forest ownership and economic values 5.13 Summary on economic values
5.14 Costs and benefits of forest land use change 6 The causes of forest loss
6.1 Missing markets 6.2 Discount rates 6.3 Property rights
6.4 Paying for environmental services 6.5 Perverse incentives
6.6 Population change 6.7 Indebtedness 6.8 Internal factors
6.9 'Excessive consumption'
7 Are there new methodologies for economic valuation of forest goods and services?
1 Introduction: forests, biodiversity and forest services
Forests worldwide are known to be critically important habitats in terms of the biological diversity they contain and in terms of the ecological functions they serve. Taking species counts as an illustration of biological diversity, the number of described organisms totals some 1.75 million, and it is conjectured that this may be just 13% of the true total, i.e. actual species
number perhaps 13.6 million (Hawksworth and Kalin-Arroyo, 1995; Stork, 1999). What fraction of this uncertain total resides in the world's forests is unknown. Wilson (1992) has suggested that perhaps half of all known species reside in tropical forests alone, and WCMC (1992) conjectures that the majority of yet-to-be-discovered species are in tropical areas. Whatever the precise number, forests, and tropical forests in particular, are major locations for biological diversity. The values of forests therefore embody the values of the biological diversity they contain since it seems unlikely that the vast majority of the biological resources in question could occupy non-forest habitats.
The ecological services of forests are similarly many. Forests regulate local and global climate, ameliorate weather events, regulate the hydrological cycle, protect watersheds and their
vegetation, water flows and soils, and provide a vast store of genetic information much of which has yet to be uncovered. Scientists debate the linkages between biological diversity and
ecological services. Those who believe in a strong link argue that any ecosystem, forests included, cannot cope with stresses and shocks if the diversity of the system has been reduced. Others argue that a majority of species are 'redundant' in the sense that their removal would not impair ecosystem functioning. On balance, it seems very likely that uniform systems are more vulnerable: diversity matters for ecosystem performance (Mooney et al. 1995; Holling et al, 1995).
The need to understand the values that reside in forests arises from the estimated rates of loss of forest area and, hence, in biological diversity. While still debated, species-area relationships, which predict the number of species lost based on the area lost, suggest that loss rates run into the thousands per year1. Tropical forest extinction rates have been most studied. Assuming that tropical forests account for about one-half of all species diversity, loss rates of tropical forest of just under 1 per cent area per annum would result in 1-10% of the world's species being lost over the next 25 years (Barbault and Sastapradja, 1995). The species-area relationship also entails that current rates of conversion of 'natural' areas will not result in very rapid rates of species loss compared to the loss rates that will ensue when yet further land conversion occurs. In other words, loss rates build up rapidly as the area in question is reduced: 'fewer extinctions now, many more later' (Pimm and Raven, 2000). This situation is exacerbated by the concentration of much diversity into 'hotspots' where rates of land conversion tend to be highest. Even if all remaining hotspot land was immediately protected, it has been suggested that 18% of their species will disappear. If only currently protected hotspot areas remain in a decade's time, 40% of hotspot species will disappear (Pimm and Raven, 2000).
1 The species area relationship takes the form S = cAx where S is the number of species, c is a constant reflecting the
2 Forest values
The notion of 'value' has been debated in philosophical circles for hundreds of years. The focus here is on instrumental values. Instrumental value derives from some objective function, i.e. the goal or purpose that is being sought. As an example, economic value relates to the goal of maximising human wellbeing (or welfare, or utility), where wellbeing has a particular
connotation, namely that someone's wellbeing is said to be higher in situation A than situation B if they prefer A to B. Economic value is anthropocentric - i.e. it is a value for humans - and it is preference based. Instrumental value might be contrasted with moral value. Philosophers debate the source of moral value: to say 'X is good' may mean that the person making the statement simply likes X, that X can be rationally derived as a good thing, that goodness resides in X like an objective quality, or that X is good because a body of religious doctrine says it is good. But moral value can co-exist with instrumental value if what is moral or right is that which achieves some objective, such as human wellbeing. Many people feel that the loss of forests and
biodiversity is a moral 'bad', something that simply is 'not right'. Again, philosophers debate whether this moral value resides in the object of value or whether it is conferred on the object by the valuer. If it is objective, residing 'in' the object, then it will exist regardless of whether humans exist as the valuers. The terminology for such objective values usually involves notions of intrinsic or inherent value. If moral value is subjective, on the other hand, then moral value is whatever the valuer thinks it is. The subjective-objective value debate is a long one in the history of philosophy (Beckerman and Pasek, 2001). Other categories of value are named in the
Preamble to the Convention on Biological Diversity and include cultural and spiritual values. Such values clearly need to be taken into account in decision-making, but do not lend
themselves to quantification. One feature of economic values is that, being based on human preferences, all kinds of motivations can act as determining factors in such preferences, and these motivations may include notions of intrinsic, cultural, social and spiritual value (Beckerman and Pasek, 2001)2.
Focusing on instrumental values is not intended to suggest that other values are less important. But instrumental values have a specific feature which makes them relevant to contexts where it is necessary to 'trade' one value against another. Because instrumental value is derived from human attitudes, wants and appreciation of the object, it is possible to weigh up one gain against another gain, and a gain against a loss. This is obviously far more difficult with intrinsic values since it is then necessary to compare the intrinsic worth of objects. As is well known, moral values conflict with each other and there are many debates about what constitutes the 'higher good' in ecological resource conservation (Pearce and Moran, 2001).
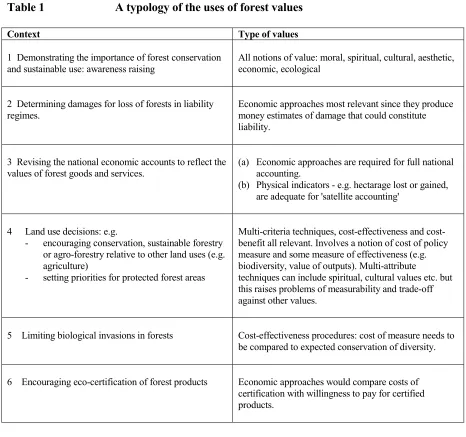
There are other reasons for focusing on instrumental values, and on economic values in particular. These can be appreciated by looking at the uses of such values - see Table 1.
2 The Ad Hoc Technical Group on Forest Biological Diversity (2000) also lists educational, scientific, recreational
Table 1 A typology of the uses of forest values
Context Type of values
1 Demonstrating the importance of forest conservation
and sustainable use: awareness raising All notions of value: moral, spiritual, cultural, aesthetic, economic, ecological
2 Determining damages for loss of forests in liability regimes.
Economic approaches most relevant since they produce money estimates of damage that could constitute liability.
3 Revising the national economic accounts to reflect the
values of forest goods and services. (a) Economic approaches are required for full national accounting.
(b) Physical indicators - e.g. hectarage lost or gained, are adequate for 'satellite accounting'
4 Land use decisions: e.g.
- encouraging conservation, sustainable forestry
or agro-forestry relative to other land uses (e.g. agriculture)
- setting priorities for protected forest areas
Multi-criteria techniques, effectiveness and cost-benefit all relevant. Involves a notion of cost of policy measure and some measure of effectiveness (e.g. biodiversity, value of outputs). Multi-attribute
techniques can include spiritual, cultural values etc. but this raises problems of measurability and trade-off against other values.
5 Limiting biological invasions in forests Cost-effectiveness procedures: cost of measure needs to
be compared to expected conservation of diversity.
6 Encouraging eco-certification of forest products Economic approaches would compare costs of
certification with willingness to pay for certified products.
Table 1 shows that economic valuation can have many different uses, but that non-economic 'physical' indicators are also useful.
3 Instrumental values and forest classifications
Table 2 provides a classification of forests. The table classifies forests by forest type. A classification by biome is not yet available at this level of detail3
3 It is important to note that the data for plantations in Table 2 are not accurate and reflect the difficulties of
differentiating plantations in the WCMC databases. Plantation estimates are probably included in non-plantation forest in the WCMC estimates. An idea of the difference can be obtained by consulting FAO (2001) data for forest
6
le 2
F
orest area b
y f orest typ e T ro pi ca l ( tho usa nd s km 2 ) Worl d R eg ion Man gr ov e an d sw am p fo re st (1) Mon tan e (2) Mo ist ha rdw ood fo res ts (3) D eci du ou s / se m i-deci du ou s broadl eaf fo res t (4) Oth er tr opi cal (5) D is tu rbed (6) P lan tation s (7) T otal T ropical ca 248.8 193.9 1,713.8 2,166.1 894.4 415.6 - 5,632.7 si a (i ns ul ar) 117.9 302.1 980.2 19.4 3.5 34.1 11.4 1,468.4 S A si a (con tin en ta l) 19.4 112.2 298.2 639.2 47.4 244.5 2.5 1,363.2 t 0.0 - 1.1 1.1 - - 0.0 2.3 dl e E ast - - - - - - - - a - - - - - - - - op e - - - - - - - - th Am er ic a - - 4. 4 - - - 2. 6 7.0 tral A m eri ca 19.8 263.9 258.0 62.0 63.4 10.2 - 677.2 th A m eri ca 133.1 459.2 5,155.0 116.8 1,911.7 130.9 1.7 7,908.4 bbean 12.3 3.9 9.4 7.7 12.5 6.9 1.1 53.8 ia 50.1 1.5 26.1 22.4 691.2 - - 791.3 L ( th ou sa nds k m
2 ) 601.4
7 Non-T ropic al (t ho usa nd s km 2 ) W or ld Region F res hw ater Sw am p Fo re st Br oadleaf (8 ) Sc ler o-phy llous dr y f or es t Needleleaf (9 ) Mix ed needleleaf / br
oadleaf fore
st Spar se tr ees and par kl and Dis tur bed (6 ) Plantations (7 ) T
otal Non- Tropic
al To ta l Tr op ic al
and Non- Tropic
al ric a -3.8 18.1 - 28.5 0.0 - - 50.3 5,683.1 E A si a (in su la r) - - - - - - - - - 1,468.4 ia ( continental) 1.7 70.0 16.3 - 33.0 - 41.8 - 162.8 1,526.0 ar Eas t - 296.5 49.1 361.9 261.7 419.2 - 65.5 1,453.8 1,456.0 Eas t - 15.2 108.2 34.0 10.3 -- - 167.7 167.7 si a - 1,466.3 - 6,687.4 - 103.5 - - 8,257.2 8,257.2 ope -550.2 22.8 1,167.2 75.2 - - - 1,815.4 1,815.4 th Am er ic a 121.7 1,275.5 225.0 4,102.8 1,233.6 1,488.3 - - 8,447.0 8,454.0 al Am er ic a -48.5 - 164.4 - -212.9 890.1 Am er ic a 3.6 360.6 8.2 - 0.7 129.2 18.7 - 521.1 8,429.5 ibbean -- 53.8 ceania -56.4 203.3 11.2 - 431.0 - - 701.9 1,493.2 O T A L (thous ands k m
2 ) 127.0
8 ce : A dapt ed f rom Irem on ge r et al . 1997. FA
O (2001) report s
om e ch an ge s in fo res t cov er s tatis tics bu t th es e w ere n ot av
ailable to u
s at th
e tim e of w ritin g an d d o n ot f ollo w th e e classif icatio
n as th
e UNEP -W C MC statistics. s: (1) m an gr ov e an d f res hw at er s w am p f ores
t; (2) u
pper (abov
e 1800 m
) an d l ow er (1200-1800 m ) m on tan e f ores
t; (3) ev
erg reen an d s em i-ev erg reen broadl eaf rai
n or m
oi st eaf f ores t bel ow 1200 m
; (4) s
em i-deci du ou s an d deci du ou s broadl eaf f ores t bel ow 1200m
; (5) n
eedl el eaf , t horn , s ch leroph yllus d ry fo re sts a nd sp ar se tr ee s a nd p ar kla nd ; ( 6) t w ith s ig ni fi can t dis tu rban ce du
e to roads
, log
gi
ng
etc; (7) ex
otic an d n ativ e s pecies , bu t s ee f ootn ote reg ardin g th e in accu racy of th e W C MC
data; (8) decidu
ou
s an
d
reen
broadleaf
; (9) ev
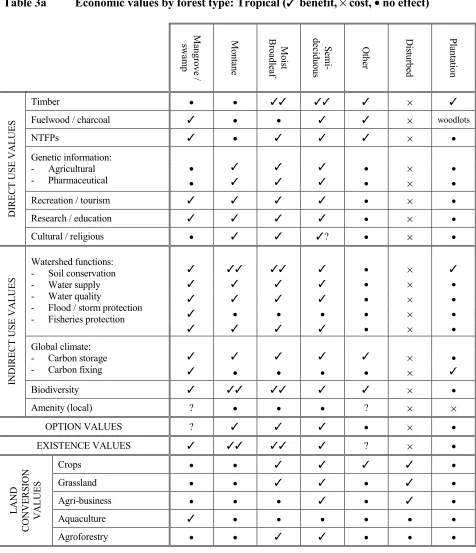
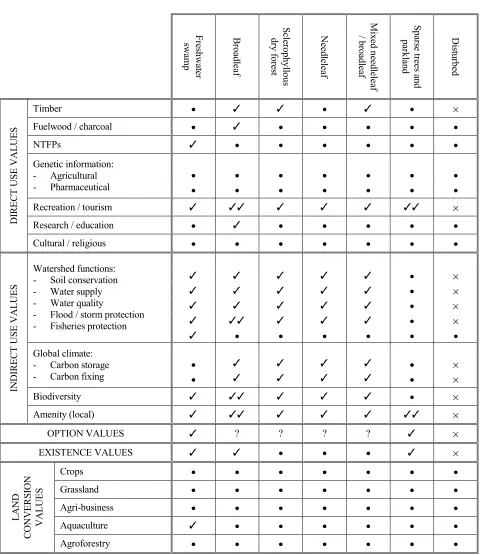
The main instrumental values associated with each category are shown in Table 3 which borrows the classification of forest types in Table 2.
Table 3a Economic values by forest type: Tropical (✓ benefit, × cost, • no effect)
Mangrove /
swa
m
p
Montane Mo
ist
B
roadl
eaf
Sem
i-deci
duous Oth
er
D
ist
urbed
Plan
tatio
n
Timber • • ✓✓ ✓✓ ✓ × ✓
Fuelwood / charcoal ✓ • • ✓ ✓ × woodlots
NTFPs ✓ • ✓ ✓ ✓ × •
• ✓ ✓ ✓ • × •
Genetic information: - Agricultural
- Pharmaceutical • ✓ ✓ ✓ • × •
Recreation / tourism ✓ ✓ ✓ ✓ • × •
Research / education ✓ ✓ ✓ ✓ • × •
DIR
E
C
T
USE VALUES
Cultural / religious • ✓ ✓ ✓? • × •
✓ ✓✓ ✓✓ ✓ • × ✓
✓ ✓ ✓ ✓ • × •
✓ ✓ ✓ ✓ • × •
✓ • • • • × •
Watershed functions:
- Soil conservation
- Water supply
- Water quality
- Flood / storm protection
- Fisheries protection
✓ ✓ ✓ ✓ • × •
✓ ✓ ✓ ✓ ✓ × •
Global climate:
- Carbon storage
- Carbon fixing ✓ • • • • × ✓
Biodiversity ✓ ✓✓ ✓✓ ✓ ✓ × •
INDIR
E
C
T
USE VALUES
Amenity (local) ? • • • ? × ×
OPTION VALUES ? ✓ ✓ ✓ • × •
EXISTENCE VALUES ✓ ✓✓ ✓✓ ✓ ? × •
Crops • • ✓ ✓ ✓ ✓ •
Grassland • • ✓ ✓ • ✓ •
Agri-business • • • ✓ • ✓ •
Aquaculture ✓ • • • • • •
LAND
C
ONVER
SION
VALUES
Table 3b Economic values by forest type: Temperate / Boreal
Fres
hwater
swa
m
p
B
roadl
eaf
Sc
le
rophyl
lous
dry fores
t
Needleleaf
Mixed needleleaf
/ broadl
eaf
Spars
e trees
and
parkl
and
D
ist
urbed
Timber • ✓ ✓ • ✓ • ×
Fuelwood / charcoal • ✓ • • • • •
NTFPs ✓ • • • • • •
• • • • • • •
Genetic information: - Agricultural
- Pharmaceutical • • • • • • •
Recreation / tourism ✓ ✓✓ ✓ ✓ ✓ ✓✓ ×
Research / education • ✓ • • • • •
DIR
E
C
T
USE VALUES
Cultural / religious • • • • • • •
✓ ✓ ✓ ✓ ✓ • ×
✓ ✓ ✓ ✓ ✓ • ×
✓ ✓ ✓ ✓ ✓ • ×
✓ ✓✓ ✓ ✓ ✓ • ×
Watershed functions:
- Soil conservation
- Water supply
- Water quality
- Flood / storm protection
- Fisheries protection
✓ • • • • • •
• ✓ ✓ ✓ ✓ • ×
Global climate:
- Carbon storage
- Carbon fixing • ✓ ✓ ✓ ✓ • ×
Biodiversity ✓ ✓✓ ✓ ✓ ✓ • ×
INDIR
E
C
T
USE VALUES
Amenity (local) ✓ ✓✓ ✓ ✓ ✓ ✓✓ ×
OPTION VALUES ✓ ? ? ? ? ✓ ×
EXISTENCE VALUES ✓ ✓ • • • ✓ ×
Crops • • • • • • •
Grassland • • • • • • •
Agri-business • • • • • • •
Aquaculture ✓ • • • • • •
LAND
C
ONVER
SION
VALUES
4 The nature of economic value
Forests are multi-functional: they provide an often complex array of goods and services. It is important to understand that describing, and where possible quantifying, these functions does not always entail that the functions can co-exist under particular management regimes. Forests managed for eco-tourism may not be usable for timber extraction; forests conserved for the supply of genetic information from the canopy can similarly not be converted to other uses, and so on.
Economic valuations of forest goods and services are based on the notion of willingness to pay which, in turn, is based on the measurement of individuals' preferences, the basis for 'welfare economics'. Willingness to pay is determined by motivations which may vary from pure self-interest to altruism, concern for future generations, environmental stewardship and a concern for other sentient beings. Survey techniques in environmental economics reveal that motivations vary significantly between individuals, but that self-interest is only one of many motives for environmental valuations. Willingness to pay has a direct counterpart in markets where it is formally equivalent (when expressed in 'marginal' terms) to the demand curve familiar in basic economics textbooks. Market prices thus reflect willingness to pay for the last unit purchased. Total willingness to pay will exceed the price paid because some consumers will be willing to pay more than the market price, thus gaining 'something for nothing', which is known as the consumers' surplus. As long as the forest good or service is being valued in marginal terms - i.e. what is being valued is a small change in the level of provision - then willingness to pay as revealed by market price is a sound indicator of economic value. If the interest is in discrete changes - e.g. a 10 or 20% change in provision - then price will understate true willingness to pay by the amount of consumer surplus. While there has been a lot of interest in valuing the totality of ecosystem services (e.g. Costanza et al, 1997), such exercises have no economic meaning. The removal of all forests, for example, would involve the loss of a major life support system. Economic values have no meaning in this context because the question as to what is the 'value of everything' has no meaning (Pearce, 1998)4. The appropriate context for economic valuation is therefore the value of a small or a discrete change in the provision of goods and services through, say, the loss or gain of a given increment or decrement in forest cover.
Many forest goods and services do not have markets and it is accordingly necessary to resort to non-market valuation techniques. In all cases these techniques seek to elicit individuals'
willingness to pay for a change in the level of provision of a forest good or a set of such goods. Approaches to 'valuing the forest' may therefore comprise attempts to value individual goods and services with subsequent aggregation of the values, or the approach may involve valuing a change in the level of the provision of the forest generally. The former approach, the bottom up approach, risks a 'part-whole' bias whereby the sum of the individual components is greater than or less than the value of the total set of goods and services. The latter approach, the top down approach, may similarly have errors if individuals are not aware of the full range of services provided by the forest. Both approaches have been used in the forest values literature. Valuing the 'whole' forest does not breach the requirement that what is valued is an increment or
decrement, since 'whole forest' studies tend to relate to specific forests which can then be seen as a small change with respect to the totality of forests in a region or, indeed, in the world as a whole.
Non-market valuation techniques are twofold. The first involves looking for markets where the forest service affects that market, even though the service is not bought and sold directly. An example would be the value of property located near to woodland or forest. Studies show that property prices are, other things equal, higher in such locations than in locations without
proximity to forests. The differential in the house price is a first approximation of the economic value of the forest. This is an example of a revealed preference procedure, in this case the 'hedonic property price' approach. Other revealed preference procedures relevant to forests include:
(1) the travel cost method, whereby willingness to pay is inferred from expenditures on travel to
and from the forest for recreational purposes
(2) the discrete choice method whereby values are inferred by looking at the choices people
make between two alternatives. An example would be certificated timber: if individuals are willing to pay more for certified timber than for identical non-sustainable timber, the increment reflects individuals' valuation of the environmental benefits from sustainable timber regimes.
The alternative to revealed preference is stated preference. This is essentially a questionnaire based approach in which individuals are asked attitudinal questions about the forest good, and are then asked their willingness to pay to conserve the good or improve its quality etc. The approach is essentially a variant of market research and has the same attractions and difficulties. The main problem is hypothetical bias, i.e. determining the extent to which individuals reply truthfully about their willingness to pay. Stated preference procedures have become very sophisticated and early studies are now generally not regarded as being reliable. Questionnaires that ask 'what is your maximum willingness to pay' or 'are you willing to pay $X' are known as contingent valuation procedures. Questionnaires that present respondents with 'bundles' of attributes and ask them to choose between these bundles, or to rank or rate them, are known as choice modelling procedures. In choice modelling, respondents are not asked their willingness to pay, but one of the attributes of the choice sets they are confronted with is a price, so that
willingness to pay can be inferred. Contingent valuation has been used extensively in the forest context, choice modelling tending to be more recent.
5 Estimates of forest economic values
This section reviews the available evidence on the economic values associated with forest goods and services.
5.1 Timber
Two types of timber use need to be distinguished: commercial and non-commercial. Local uses may be commercial or can relate to subsistence, e.g. building poles. World industrial roundwood production expanded substantially between 1960 and 1990 from some 1 billion m3 to 1.6 billion m3 but has since fallen back to some 1.5 billion m3 in the late 1990s (Barbier et al, 1994; FAO, 2000). Wood-based panel and paper/paperboard production show steadily rising demand which is partially offset by reductions in the demand for sawnwood. Tropical woods production
accounts for around 40% of total roundwood production, and tropical woods exports account for 25% of world production (Barbier et al, 1994). Europe and North/Central America account for 65% of world industrial roundwood production, with Asia accounting for about 20% and South America accounting for 9%.
Since timber is marketed, its economic value should, in principle, be easy to derive. In practice there are formidable problems in determining this value. First, the 'ex forest' price of a log refers to the price received on sale to a processor or an exporter. The costs of extraction and
transportation need to be deducted. It is not easy to find reliable estimates of such costs. In turn, the 'value of the timber stand' is given by the maximum that a concessionaire should be willing to pay for the concession. This is known as the 'stumpage value'. Estimates of stumpage value are also difficult to find. No estimates of the total financial value of world timber output appear to be available. The value of world trade in all timber products is around $120 billion, with trade accounting for significant proportions of production in sawnwood (28%) and paper and
paperboard (40%). Since this figure is gross of costs it does not constitute a figure that can be compared to world Gross 'National' Product5.
5.1.1 Sustainable timber management versus conventional logging
In a comprehensive survey of sustainable forestry practice, Pearce et al. (2001) find that sustainable forest management is less profitable than non-sustainable forestry, although
definitional problems abound. Profit here refers only to the returns to a logging regime. They do not include the other values of the forest. Annex 1 reproduces the results for those cases where absolute profit figures are reported. The general result is that sustainable timber management can be profitable, but that conventional (unsustainable) logging is more profitable. This result is hardly surprising given the role that discount rates play in determining the profitability of forestry. The higher the discount rate the less market value is attached now to yields in the future. If logging can take place in natural forests with maximum harvest now, this will generate more near-term revenues than sustainable timber practice. Similarly, sustainable timber
management involves higher costs, e.g. in avoiding damage to standing but non-commercial trees. The significance of the general result is that the non-timber benefits, including ecological and other services, from sustainable forests must exceed the general loss of profit relative to conventional logging for the market to favour sustainable forestry.
5.2 Fuelwood and charcoal.
FAO (2000) statistics suggest that that some 1.86 billion m3 of wood is extracted from forests for fuelwood and conversion to charcoal. Of this total, roughly one-half comes from Asia, 28% from Africa, 10% from South America, 8% from North and Central America and 4% from Europe. Smil (1987) puts all biomass energy (i.e. including dung and crop residues) at 15% of world energy consumption. Goldemberg et al. (1987) suggests that some 43% of developing countries' energy consumption comes from non-commercial sources, while Miller and Tangley suggest 26% for fuelwood alone. The International Energy Agency (1998) estimates that 11% of world energy consumption comes from biomass, mainly fuelwood. IEA (1998) estimates that 19% of China's primary energy consumption comes from biomass, the figure for India being 42%, and the figure for developing countries generally being about 35% (see also UNDP et al., 2000). All sources agree that fuelwood is of major importance for poorer countries and for the poor within those countries. While fuelwood may be taken from major forests, much of it comes from woodlots and other less concentrated sources. Extraction rates may or may not be
sustainable, depending on geographic region. Hardly any fuelwood and charcoal is traded internationally.
Local values of fuelwood and charcoal can be highly significant in terms of the local economy. Shyamsundar and Kramer (1997) show that the value of fuelwood per household per annum for villages surrounding Mantadia National Park in Madagascar is $39. This can be compared with an estimated mean annual income of $279, i.e. collected fuelwood from the forest accounts for 14% of household income. NTFPs generally account for 20-35% of household income in West Bengal (Kant et al, 1996). Houghton and Mendelsohn (1996) find that the value of fuelwood constitutes from 39-67% of local household income from fodder, fuel and timber in the Middle Hills of Nepal.
5.3 Non-timber forest products (NTFP)
Table 2's coverage of non-timber forest products refers to extractive products other than fuelwood. Also omitted here is forestry. Following Chomitz and Kumari (1996), agro-forestry is best seen as a form of forest conversion, although this should not detract from its attractions as an environmentally sound land use. NTFP extraction may be sustainable or non-sustainable and few studies make observations as to which is the case. Extractive uses include: taking wild animals for food (hunting), taking animals, fish, crustaceans and birds for local or international trade or for subsistence use, taking tree products such as latex, wild cocoa, honey, gums, nuts, fruits and flowers/seeds, spices, plant material for local medicines, rattan, fodder for animals, fungi, and berries.
Early arguments that NTFP (plus sustainable timber extraction) values could exceed those to be to be obtained by land clearance and conversion to a non-forest use (e.g. Peters et al. 1989) have largely been discredited (a) because of poor design of these studies and (b) because of
subsequent research. The value of NTFPs, expressed per hectare of forest land, varies
significantly with geographical location (e.g. access to markets). Nonetheless, NTFPs have been shown to be extremely important for local communities in some studies. Kant et al. (1996) note that the value of NTFPs is inversely correlated with GNP, suggesting that NTFPs are, as one might expect, an 'inferior' product6.
The task of summarising the state of the art in estimating non-timber values in the tropical forest context has been facilitated by a number of recent surveys: Godoy et al. (1993), Pearce and Moran (1994), Southgate (1996), Lampietti and Dixon (1995), Bann (1998a) and Batagoda et al. (2000)7. Unfortunately, these surveys are dated, omit some of the literature, and additionally significant new material has emerged. There are substantial difficulties in reaching general conclusions, primarily because appropriate guidelines for carrying out such studies, such as those set out in Godoy et al. (1993) and Godoy and Lubowski (1992) have not been followed. The result has been a mixture of legitimate and illegitimate valuation procedures. The types of mistake made have included generalisation from studies of a small area of forest to wider areas, with little regard for (a) the fact that the area in question will not be typical of the whole forest area simply because of variations in distance to market, (b) ignoring the fact that, in a hypothetical world where the whole forest was exploited for non-timber products, the prices, and hence the profitability, of non-timber production would fall; (c) failing to define whether the values in question relate to the stock of goods and services, their potential flow if exploited efficiently, and their actual flow; (d) failing to account for post-harvest losses. Studies also vary as to whether they report revenues or revenues net of labour and other costs. Little account has been taken in many of the studies of the extent to which the relevant non-timber activity is itself sustainable, so that what is being compared may well be two non-sustainable land use options. Southgate (1996) notes that quite a few extractive NTFP ventures have collapsed due to over-exploitation. Finally, there is likely to be 'selection bias': only studies that report, or seek out, positive values are being reported.
Table 4 summarises the findings of the literature with respect to NTFPs.
6 An inferior product is one where the demand for the product goes down as income rises.
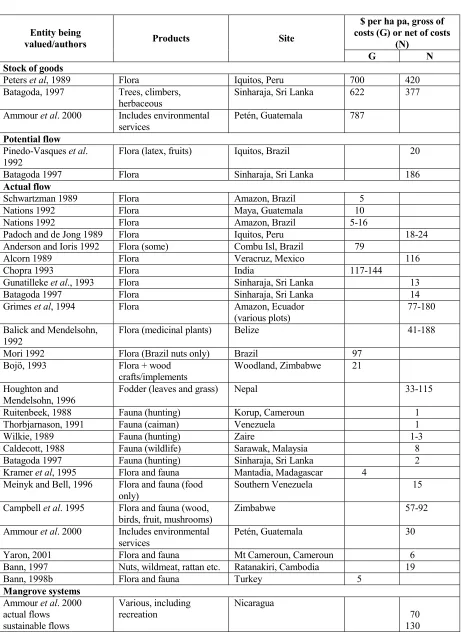
Table 4 Studies of the economic values of NTFPs
$ per ha pa, gross of costs (G) or net of costs
(N) Entity being
valued/authors Products Site
G N Stock of goods
Peters et al, 1989 Flora Iquitos, Peru 700 420
Batagoda, 1997 Trees, climbers,
herbaceous Sinharaja, Sri Lanka 622 377
Ammour et al. 2000 Includes environmental
services Petén, Guatemala 787
Potential flow Pinedo-Vasques et al. 1992
Flora (latex, fruits) Iquitos, Brazil 20
Batagoda 1997 Flora Sinharaja, Sri Lanka 186
Actual flow
Schwartzman 1989 Flora Amazon, Brazil 5
Nations 1992 Flora Maya, Guatemala 10
Nations 1992 Flora Amazon, Brazil 5-16
Padoch and de Jong 1989 Flora Iquitos, Peru 18-24
Anderson and Ioris 1992 Flora (some) Combu Isl, Brazil 79
Alcorn 1989 Flora Veracruz, Mexico 116
Chopra 1993 Flora India 117-144
Gunatilleke et al., 1993 Flora Sinharaja, Sri Lanka 13
Batagoda 1997 Flora Sinharaja, Sri Lanka 14
Grimes et al, 1994 Flora Amazon, Ecuador
(various plots) 77-180
Balick and Mendelsohn,
1992 Flora (medicinal plants) Belize 41-188
Mori 1992 Flora (Brazil nuts only) Brazil 97
Bojö, 1993 Flora + wood
crafts/implements Woodland, Zimbabwe 21
Houghton and
Mendelsohn, 1996 Fodder (leaves and grass) Nepal 33-115
Ruitenbeek, 1988 Fauna (hunting) Korup, Cameroun 1
Thorbjarnason, 1991 Fauna (caiman) Venezuela 1
Wilkie, 1989 Fauna (hunting) Zaire 1-3
Caldecott, 1988 Fauna (wildlife) Sarawak, Malaysia 8
Batagoda 1997 Fauna (hunting) Sinharaja, Sri Lanka 2
Kramer et al, 1995 Flora and fauna Mantadia, Madagascar 4
Meinyk and Bell, 1996 Flora and fauna (food
only)
Southern Venezuela 15
Campbell et al. 1995 Flora and fauna (wood,
birds, fruit, mushrooms) Zimbabwe 57-92
Ammour et al. 2000 Includes environmental
services Petén, Guatemala 30
Yaron, 2001 Flora and fauna Mt Cameroun, Cameroun 6
Bann, 1997 Nuts, wildmeat, rattan etc. Ratanakiri, Cambodia 19
Bann, 1998b Flora and fauna Turkey 5
Mangrove systems Ammour et al. 2000 actual flows sustainable flows
Various, including
recreation Nicaragua 70
While caution needs to be exercised, the values shown in Table 4 do suggest a clustering of NTPF net values of a few dollars per hectare per annum up to around $100. Lampietti and Dixon (1993) suggest a 'default' value of around $70 per hectare, and Pearce (1998) has suggested $508. However, it would be a serious error to extrapolate these benchmark values to all forest.
Typically, the higher values relate to readily accessible forest and values for non-accessible forest would be close to zero in net terms due to the costs of access and extraction. While such values on their own will not 'compete' with many land conversion values, the importance of NTFPs lies more in the role they play in supporting local community incomes.
Table 5 illustrates some typical relationships between the value of NTFPs and local incomes. The essential point is that NTFPs can constitute a substantial fraction of household incomes, so that, even if such values fail to compete with alternative land uses, serious local poverty issues can arise if the benefits of the competing land use do not accrue to those who lose the forest products in question.
Table 5 NTFPs as percentages of total household income
Study Site NTFPs as % household income
Lynam et al. 1994 Zimbabwe:
Chivi
Mangwende 40 - 160 12 - 47
Houghton and Mendelsohn, 1996 Middle Hills, Nepal Fodder, fuel and timber can yield as
much net revenue as agriculture
Kramer et al. 1995 Mantandia, Madagascar 47
(lost forest products as % of household output)
Bahuguna, 2000 Madhya Pradesh, Orissa and
Gujarat, India 49 (fuelwood and fodder = 31%, 10%
employment, 6% other NTFPs, 2% timber and bamboo)
Cavendish, 1999 Zimbabwe 35% (across many different
environmental goods)
5.4 Biodiversity
Defining where the world's biological diversity is located is a complex question, not least because of serious uncertainties about just how many species actually exist. Moreover species diversity is one, albeit convenient, indicator of overall biological diversity. Typically, however, species richness increases from the poles to the equator. The species density of tropically
forested areas is well documented (e.g. Reid and Miller, 1989). Tropical forests probably contain more than half the world's species. Patterns vary according to whether the indicator relates to mammals, insects, plants etc. Islands have a critical role to play, often containing high species endemism.
The economic value of this diversity is the subject of a rapidly growing literature but one that remains very unsatisfactory in terms of the reporting of values for forest types. Part of the problem lies in the confusion between the value of biological resources and the value of
8 The values shown also reflect local market conditions and there is no reason why prices will be similar in the
biodiversity. Many studies relate to the former and few to the latter. The essence of the value of diversity is that it embodies the value of information and insurance. Existing diversity is the result is evolutionary processes over several billion years. This suggests two things: that existing diversity embodies a stock of information, and, because the evolutionary process has occurred in the context of many different environmental conditions, the diversity of living things also embodies characteristics that make them resilient to further 'natural' change (but not to human intervention). In essence, the existing stock of diversity exists to protect the entire range of goods and services, including information, provided by the diverse system.
The diversity contains information that can be used to develop those goods and services for the benefit of humankind. In turn, this information derives from the fact that all species co-evolve and hence interact with each other. Swanson (1997) likens the information to a huge library on chemically active ingredients, a library that has barely been accessed. The value of the known information is therefore only a part, and potentially only a trivial part, of the total value of the information stock. Retaining the stock in the event that it will be useful later on represents an 'option value' for the known element, and a 'quasi option value' for the currently unknown element.
Information values
Advances have been made in respect of the valuation of the information functions of diversity, although a serious debate exists about the findings so far. Potentially, the information can be fed into plant breeding, into pharmaceutical 'blueprints' for drugs, perhaps into industrial processes and so on. The more unique the information is, the more valuable it is, so that the existence of substitutes is a critical factor affecting the economic value of the information. This has affected efforts to value the information content in several ways. First, while forest degradation continues at an alarming rate, it can be argued that the remaining stock is so large that willingness to pay to conserve part of the stock is currently small. That willingness to pay will rise as the stock
depletes. Second, the willingness to pay will be small as long as there are substitutes and this is true of both agricultural germplasm and 'medicinal' germplasm. Also relevant is the fact that research and development effort is more easily diverted to genetic manipulation than to the identification of 'wild' genetic information: it may soon be cheaper to prevent a human disease than to cure it.
Table 6 The role of biodiversity in agriculture: sources of germplasm in a sample of plant breeding companies
Source of germplasm Percentage from each source
Commercial cultivator Related minor crop
Wild species: ex situ genebanks Wild species: in situ
Landrace: ex situ genebank Landrace: in situ
Induced mutation Biotechnology
81.5 1.4 2.5 1.0 1.6 1.4 2.2 4.5
Relatively wild species 6.5
Source: Swanson (1997).
There are several ways of estimating the economic value of this germplasm. First, it could be argued that the economic value of wild crop genetic material is given by what the crop breeding companies are willing to pay for it. At a minimum, this must be equal to that portion of their R&D budgets spent on germplasm from the more remote sources. Second, an effort could be made to estimate the crop output that would be lost if the genetic material was not available. This is an approach based on damages. Third, an attempt could be made to estimate the contribution of the genetic material to crop productivity – a benefits approach. This approach might proceed by asking what the cost would be of replacing or substituting for wild genetic material should it disappear – a ‘replacement cost’ approach.
By and large, we would expect the damage and benefits approach to produce the same answer: benefits will equal damages avoided. But all approaches have their problems. The R&D expenditure approach is complicated by the fact that expenditures are a minimum valuation and it is the rate of return to those expenditures that is a better estimate of value. However, rates of return calculations are complicated by the fact that there are other ‘inputs’ besides genetic material which contribute to value. Separating out the different contributions may be difficult. The replacement cost approach assumes that lost wild genetic material must be replaced, i.e. that there is some constraint on the ‘stock’ of wild biodiversity. Strictly, the issue is whether replacement is worthwhile, so that what should be compared is the cost of replacement (the cost) with the avoided damages (the benefits).
remain important. The role of forests in providing that information should not be exaggerated, however. As far as plant based foods are concerned, existing widely-used crops tend not to emanate from tropical forests but from warm temperate regions and tropical montane areas. The existing 'Vavilov' centres of crop genetic diversity are mainly in areas with low forest diversity. While this suggests that forests generally have only a limited role to play as the source of information and diversity for food crops, it should be borne in mind that existing food crops emanate from areas where humans happened to live. It does not follow that forests are irrelevant to future crop production. It seems probably that their value lies more at the regional than the global level (Reid and Miller, 1987). Overall, systematic estimates of the informational value of wild species to crop output are not available.
The informational value of forest diversity for pharmaceutical use is better studied. There are two distinct views about the economic value of genetic material with potential pharmaceutical use. The first argues that the implicit economic value is huge, and the second suggests that it is very modest, at least when converted to economic values per unit of land area. Much of this debate surrounds the ‘global’ value of medicinal plant material. There is far less of a dispute about the localised values of traditional medicines, and these are arguably substantial within the context of a local economy (see under NTPFs).
Table 7 Estimates of the pharmaceutical value of ‘hot spot’ land areas
($ per hectare)
Area Simpson et al. (1994)
WTP of pharmaceuti-cal companies.
Simpson & Craft (1996) ‘Social value’ of genetic material per ha.
Rausser & Small (1998a) WTP of phar-maceutical companies Western Ecuador
Southwestern Sri Lanka New Caledonia Madagascar
Western Ghats of India Philippines
Atlantic Coast Brazil Uplands of western Amazonia Tanzania
Cape Floristic Province, S. Africa Peninsular Malaysia Southwestern Australia Ivory Coast Northern Borneo Eastern Himalayas Colombian Choco Central Chile
California Floristic Province
20.6 16.8 12.4 6.9 4.8 4.7 4.4 2.6 2.1 1.7 1.5 1.2 1.1 1.0 1.0 0.8 0.7 0.2 2,888 2,357 1,739 961 668 652 619 363 290 233 206 171 160 138 137 106 104 29 9,177 7,463 5,473 2,961 2,026 1,973 1,867 1,043 811 632 539 435 394 332 332 231 231 0 Source: Simpson et al., 1996; Simpson and Craft, 1996; Rausser and Small, 1998a.
Table 7 suggests that pharmaceutical genetic material could be worth several hundreds of dollars per hectare in most hotspot areas, and perhaps up to several thousands of dollars for selected areas. For the major part of the world's forests, however, values will be extremely small or close to zero.
Diversity as an insurance value
Apart from the 'products' approach to the value of diversity, i.e. looking at the economic value of the products derived from the value of information, which in turn derives from the diversity within the forest, it is diversity that defines the nature of the forest as an ecosystem. Hence diversity is essential as a precondition for all the other values defined for the forest, from tourism to timber and non-timber products, and including the information flows On this basis, the economic value of diversity as insurance is the insurance premium that the world should be willing to pay to avoid the value of the forest goods and services being lost. The actuarially fair premium for this insurance, if a market for it existed, is the probability of the loss occurring multiplied by the value of all the losses that would occur (Pearce, 2001). No attempt has been made anywhere to estimate, even approximately, what this premium is, but it is clearly very large since the probability of loss is known to be high9 and the values are also potentially high (as demonstrated in other sections). The complication, again, is that the premium will be small for the initial continuing losses of forest cover, rising only as the forest cover is lost.
Some limited information exists on these insurance values. Most farmers in developed countries can insure against crop losses by paying premia. In many ways, this financial insurance can be thought of as a substitute for ‘natural’ insurance brought about by diversity. If so, expenditures on crop insurance might be thought of as a ‘first cut’ estimate of the insurance value of crop diversity. The complication is that, if the insurance system works efficiently, farmers will only be choosing financial insurance because they regard it as cheaper than the natural form of insurance. Essentially, financial contributions through premia will cost less than the forgone profits from a diverse but lower productivity system. In this case, the financial insurance overstates the value of diversity. However, as WCMC (1992) note, crop insurance systems, at least in the USA, are not efficient. They are subsidised by government, which means that the insurance industry is unwilling to bear all the risks from agricultural failure. This unwillingness probably derives from the very fact of uniformity in the agricultural system, since if one farmer fails so will other farmers: they each engage in the same risky activity of reducing diversity. Insurance only works efficiently where risks are pooled, i.e. where each farmer faces different risks.
In this context, then, crop insurance values may be a reasonable first indicator of the insurance value of diversity. WCMC data suggest that total premia in 1990 in the USA amounted to $820 million, of which 75% consisted of farmers’ premia and 25% government grant. Total government pay outs in 1988 were some $890 million, reflecting additional items like compensation for crop losses over and above the premia allowances. Perversely, these subsidies are then encouraging the reduction in natural diversity by encouraging the use of financial insurance.
Another perspective on insurance can be obtained by looking at ‘extreme events’, i.e. situations in which entire crop failures have occurred and which can be ascribed to lost genetic diversity. Some scholars have argued that entire civilisations have been lost because of uniformity in a basic food crop, e.g. the Mayan civilisation and its reliance on maize, which was subject to a virus. The Irish potato blight of the 1840s is another example. More recent crises have affected maize, citrus fruit, wheat and rice in various parts of the world (WCMC, 1992).
The unsatisfactory nature of current research lies in the fact that 'true' value of the forests lies in the role they play as the repository of biological diversity and that the economic value of this diversity has yet to be rigorously measured. The diversity embodies billions of years of information and billions of years of 'resilience' to environmental change. The latter protect the former but also protects all the other functions of forests - use and non-use values alike. Hence the economic value of any tract of forest must be equal to its informational value plus its insurance value. Informational values for agriculture and pharmaceuticals are under investigation, with widely differing results from the studies so far. The insurance value needs to be thought of as premium to cover the loss of all values.
broadleaf trees, introducing other conifer species, and allowing the forest to evolve to a semi-natural woodland. Mean willingness to pay was found to be £10, £5 and £13 per household for the three states ($15, $7.5, and $20). The lower willingness to pay for the second option is not as expected since it reflects a higher biodiversity level compared to option 1. It appears to be a result of the survey design methodology. While the study aggregates these values across all UK households, it seems unlikely that such willingness to pay would be distributed across the whole population. The aggregation process produced values of £155-300 million, or some £516-1000/ha. Further work is required before assigning significance to the large values derived in the study.
5.5 Forest land conversion
Forest land conversion is self evidently not a forest value but the converted use constitutes a value of forest land. It is essential to understand the economic values of converted forest land since, if these exceed the economic values of conserved forest or sustainable forest use, there is a prima facie case for supposing that economic forces will lead to the forest being converted. Notable uses of converted land include palm oil plantations and cocoa, cattle ranching, slash and burn agriculture, and permanent agriculture. Section 6.1 discusses comparative rates of return to alternative land uses.
5.6 Watershed protection
There are numerous studies of the role played by forests in watershed regulation. Functions include: soil conservation - and hence control of siltation and sedimentation, water flow regulation - including flood and storm protection, water supply, water quality regulation - including nutrient outflow. The effects of forest cover removal can be dramatic if
non-sustainable timber extraction occurs, but care needs to be taken not to exaggerate the effects of logging and shifting agriculture (Hamilton and King, 1983).
Economic studies of watershed protection functions are few, but the focus of attention is shifting towards methodologies for assessing the value of these functions. Table 8 assembles the
Table 8 Economic values of forest watershed protection/water supply functions
Study: tropical Type of watershed protection function Results
Ammour et al, 2000. Guatemala
forest Prevention of soil erosion. Universal soil loss equation
Valued at cost of soil replacement
and at costs of preventing soil loss1
Prevention of nutrient loss. Nutrients in aerial biomass.
Valued at fertiliser prices1.
Negligible
$12 ha/a out of $30 ha/a for all NTFPs and environmental services
Kumari, 1996. Malaysian forest Protection of irrigation water, valued
at productivity of water in crops2.
Protection of domestic water supplies. Valued at treatment cost
for improved quality2.
$15/ha
$ 0/ha Ruitenbeek 1989
Korup, Cameroun Flood protection only $ 3/ha
Yaron, 2001. Mt Cameroun,
Cameroun Flood protection, valued at value of avoidable crop and tree losses $ 0-24/ha
Pattanayak and Kramer, 2001
Eastern Indonesia Drought mitigation from forest protection and regrowth, valued at
gain in profits to rice and coffee production
$3 - 35 per household3
(compares to $5-13 per household costs of 're-greening') = $0.36 per mm baseflow. = 1-10% of annual agricultural profit.
Bann, 1998b. Turkey Soil erosion valued by replacement
cost of nutrients, flood damage $46/ha
Adger et al, 1995
Mexico Sedimentation effects on infrastructure $negligible
Shahwahid et al. 1997
Malaysia Impacts of RIL compared to total protection of forests on
hydroelectricity
$4/ha
Hodgson and Dixon, 1988 Philippines
Fisheries protection from avoided logging,
$268/ha Bann, 1999
Johor, Malaysia Shoreline protection by mangrove forest
Fisheries protection by mangrove forest
$845/ha
$526/ha
Anderson, 1987. Northern Nigeria Shelterbelts for crop protection
Farm forestry
Rate of return increases from 5% (wood benefits only) to 13-17% Rate of return increases from 7% to 14-22%
Study: temperate
Clinch, 1999 Irish temperate forests, water supply Minus $20/ha
Notes: 1 - in both cases the values are replacement costs. This is not strictly a correct valuation procedure, see text. 2 - valued as the difference between currently unsustainable logging and sustainably managed logging, central case. 3- unfortunately the forest area is not stated.
the benefits accruing to any one householder or farmer also accrue to all others in the protected area. Third, the few studies available tend to focus on single attributes of the protective function - nutrient loss, flood prevention etc. Fourth, the Hodgson-Dixon study for the Philippines suggests that fisheries protection values could be substantial in locations where there is a significant in-shore fisheries industry. Comprehensive estimates have still to be researched.
5.7 Carbon storage and sequestration
A number of studies suggest potentially very large values for the carbon storage functions of forests. It is important to distinguish:
(a) carbon stored in a standing forest that is close to 'carbon balance' (b) carbon sequestered in a growing forest.
In the former case there is an economic value to the carbon stored and much of which value is lost if the forest is burned or logged, depending in part on the subsequent use of the converted land. Whether such a forest can realise such storage values depends on the baseline, i.e. on what is likely to happen to the forest in the absence of some protective or sustainable use measure. Forest not under threat of conversion has a storage value but this value is unlikely to be realised, although forecasts of continuing rates of forest cover loss of some 0.8% per annum does place a considerable amount of forest under threat. Forest that is threatened in the near-to-medium future has a storage value which can be realised through protective measures. Another way of thinking about the issue of storage value is to consider the lost value of the forest in the event of conversion. In this case, the carbon storage value is lost. Sequestration, on the other hand, relates solely to the net fixation of carbon by a growing forest. The value of the carbon sequestered is the same, per tonne of carbon, as in the carbon storage case, but the value will be aggregated only over the rotation life of the forest if that applies.
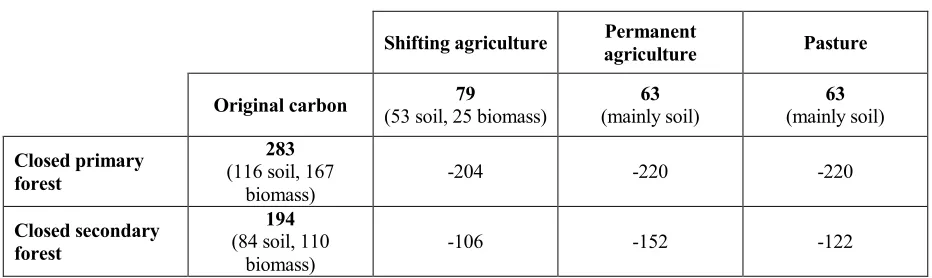
There are an enormous number of studies on the carbon stored and sequestered in different forest types. Brown and Pearce (1994) suggest benchmark figures for carbon content and loss rates for tropical forests, as shown in Table 9. A close primary forest has some 280 tC/ha of carbon and if converted to shifting agriculture would release about 200 tonnes of this, and a little more if converted to pasture or permanent agriculture. Open forest would begin with around 115 tC and would lose between a quarter and third of this on conversion.
Table 9 Changes in carbon with land use conversion: tropical forests tC/ha
Shifting agriculture agriculture Permanent Pasture
Original carbon (53 soil, 25 biomass) 79 (mainly soil) 63 (mainly soil) 63
Closed primary forest
283 (116 soil, 167
biomass) -204 -220 -220
Closed secondary forest
194 (84 soil, 110
Open forest 115 -36 -52 -52
Using such estimates as benchmarks10, the issue is what the economic value of such carbon stocks is. A significant literature exists on the economic value of global warming damage and the translation of these estimates into the economic value of a marginal tonne of carbon. A recent review of the literature by Clarkson (2000) suggests a consensus value of $34 tC11. Tol et al. (2000) also review the studies and suggest that it is difficult to produce estimates of marginal damage above $50 tC. Taking $34-50 tC as the range produces very high estimates for the value of forests as carbon stores. In practical terms, however, a better guide to the value of carbon is what it is likely to be traded at in a 'carbon market'. Carbon markets have existed since 1989 and refer to the sums of money that corporations and governments have been willing to invest in order to sequester carbon or prevent its emission. Several hundred 'carbon offset' investments of this kind exist, all of them voluntary and unrelated to global warming legislation. More
sophisticated markets will emerge as emissions trading schemes develop, and a major boost to these will be given by any eventual agreement on the 'flexibility mechanisms' under the Kyoto Protocol of 1997. Zhang (2000) suggests that, if there are no limitations placed on worldwide carbon trading, carbon credits will exchange at just under $10 per tC. If 'hot air' trading is excluded, the price will be $13 tC. Taking the $10 tC as a conservative estimate, Table 10a repeats Table 9 but with money values rather than tonnes of carbon.
Table 10a reveals the large values obtained for tropical forests when applying carbon-trading prices. Values of $2000/ha can be reached for closed primary and secondary forest. Note again that these values relate to forests that are (a) under threat of conversion and (b) capable of being the subject of deforestation avoidance agreements12.
Table 10a Changes in carbon with land use conversion: tropical countries tC/ha
Shifting agriculture agriculture Permanent Pasture
Original carbon
value $/ha 790 630 630
Closed primary
forest 2830 -2040 -2200 -2200
Closed secondary
forest 1940 -1060 -1520 -1220
Open forest 1150 -360 -520 -520
The same figure for traded carbon credits can be used to illuminate the value of plantations for carbon purposes. Under the 'Kyoto rules', plantations would not count as contributing to carbon sequestration if they would have been undertaken anyway. Only 'additional' planting would
10 Estimates will vary by region and on whether or not soil carbon is released.
11 Clarkson actually selects $80 tC since it includes 'equity weighting', i.e. it values warming damages more highly
for poorer countries than for rich countries. Apart from the arbitrariness of the value judgement involved, the equity weighted approach is not consistent with the other forest values derived in this report which are based on willingness to pay in the area where the forest service occurs.
count. Hence one approach to plantation carbon is to charge the full costs of plantations to the carbon sequestered to derive a cost per tonne of carbon. In their review of cost estimates, Sedjo et al. (1995) show that estimates range from $3-16 tC for agro-forestry and $3-60 tC for plantations in tropical areas; $1-50 tC for plantations in temperate areas; and $1-4 tC for plantations in boreal areas. Cost-efficient practices would be at the lower end of these ranges. Sedjo et al (1995) point out that these estimates ignore the probable rising cost of plantations for carbon as areas grown increase. Nonetheless, it can be seen that plantations would probably be worth undertaking for carbon sequestration purposes.
An illustration of the importance of sequestration in growing forests is given by Solberg (1997). Using Norway's carbon tax of about $49 tCO2 as an expression of the social cost of fossil fuels, Solberg shows that, applied to carbon sequestered in Norwegian forests, the implied value of the forest as a carbon sink exceeds the value of the forest stand as timber. Depending on the interest rate, the carbon value exceeds the timber value by 3-30 times. The implications are (a) that more afforestation is justified than would be the case allowing for timber values alone, and (b)
management practices should change in favour of maximising dry weight biomass growth. The latter may not be entirely consistent with biodiversity concerns.
The importance of carbon values is further illustrated by the study of Smith et al 91997) for the Peruvian Amazon. The returns to slash and burn agriculture are found to be negative if measured in net present value terms over ten years, but positive if measured over the first two years of yields only. The rationale for considering two years only is that farmers' discount rates may be so high that this is their effective time horizon. Moreover, these returns exceed those to
agroforestry. Using stated preference techniques farmers were asked their willingness to accept compensation to forego the existing slash-and-burn land use in favour of (a) agroforestry and (b) forest conservation. Assuming no environmental services were achieved from these land uses, farmers were on average willing to accept $246/ha per annum to leave the forest in a conserved state and $153/ha for agroforestry. The lower value of compensation for agroforestry reflects the fact that farmers would secure some crop yields with an agroforestry system. Asked to revise their compensation requirements to allow for the environmental benefits they would secure, the compensation sums were reduced to $173 and $109 respectively. The estimates suggest that farmer value the environmental services they receive from the forest in a conserved or agro-forestry state at $44-73/ha. Two important conclusions follow: (a) slash and burn farmers are not at all indifferent to the non-cash benefits they secure from forests, and (b) if a scheme of
compensation could be devised, payments of $100-200 ha would compensate them for the foregone benefits of agriculture, the lower value reflecting the sum required to get them to switch to agro-forestry, the latter being the sum required if the preferred conservation option is outright conservation. Smith et al (1997) focus on carbon trading as a means by which these compensation measures could take place.
Carbon regimes in temperate countries have also been extensively studied. Table 10b summarises some of the studies relating to afforestation programmes.
Table 10b Carbon value for afforested land: temperate forests
Study Carbon value per hectare of afforested land
Pearce, 1994. UK $280-413
Clinch. Ireland $ 88
5.8 Tourism and recreation values
5.8.1 Tropical forests
Ecotourism is a growing activity and constitutes a potentially valuable non-extractive use of tropical forests. Caveats to this statement are (a) that it is the net gains to the forest dwellers and/or forest users that matter; (b) tourism expenditures often result in profits for tour organisers who do not reside in or near the forest area, and may even be non-nationals; (c) the tourism itself must be 'sustainable', honouring the ecological carrying capacity of the area for tourists. In principle, tourism values are relevant for any area that is accessible by road or river.
Table 11 lists some estimates of tourism value for tropically forested areas. Some ecotourist sites attract enormous numbers of visitors and consequently have very high per hectare values. Again, it is difficult to suggest representative valuations since values clearly vary with location (e.g. the Shultz study for Costa Rica relates to high accessible sites) and the nature of the attractions.
Table 11 Tourism values for tropically forested areas
Study Values Comment
Hodgson and Dixon, 1988 Philippines
$650/ha Benefit of no logging vs. continued
logging near Bacuit Bay. Gross not net revenues and unclear who secures the net revenues. Adger et al. 1995
Mexico $1/ha Consumer's surplus estimates
Tobias and Mendelsohn 1991 Costa Rica, Monteverde rainforest
$160/ha Consumer's surplus estimated by
travel cost method. For Costa Rican visitors only
Chase et al. 1998.
3 national parks in Costa Rica $21-25 per foreign visitor Consumer surplus from a contingent valuation study. Areas not stated.
Revenue-maximising policy would increase revenues to the three parks by $1 million.
Shultz, W, Pinazzo, J and Cifuentes, M. 1998
Two forested parks in Costa Rica, Poas Volcano (A) and Manuel
Antonio (B)1
A: $950/ha B: $2305/ha
Areas (A=5600ha and B=737 ha) stated but total visitors not stated. Latter taken from Southgate (1996). Very high values due to very high popularity of sites (volcano, views, beach).
Maille and Mendelsohn, 1991
Madagascar $360-468/ha Consumer's surplus estimated by travel cost method. For foreign
visitors only Garrod and Willis, 1997.
Forest recreation areas, Malaysia $740/ha Consumer's surplus by contingent valuation and sample tested with
travel cost. Large values due to small areas and proximity to sources of demand.
Bann, 1999.
Mangrove protection in Benut, Johor State, Malaysia
$3 ha Valuation of locals only
5.8.2 Temperate and boreal forests
Table 12 summarises some of the many studies for non-tropical forests. Indicative values for European forests suggest per person willingness to pay of around $1-3 per visit. The resulting aggregate values for forests could therefore be substantial. Elsesser (1999) suggests that forest recreation in Germany is worth some $2.2 billion per annum for day-users alone and a further $0.2 billion for holiday makers.
Table 12 Tourism values for non-tropical forested areas
Study Values Comment
Bann, 1998b
Turkey $0.4 ha gross Nation-wide average
Bellu and Cistulli, 1997
Liguria forests, Italy $77-85/ha Consumer surplus by contingent valuation and travel cost methods
Whiteman and Sinclair, 1994. UK forest
$1.3-1.8 per person per visit See Bateman et al, 1999.
Hanley and Ruffell, 1992
All UK forests $1.5-1.7 per person per visit See Bateman et al, 1999
Hanley and Ruffell, 1991
Scottish forests $1.8-3.0 per person per visit See Bateman et al, 1999
Bishop 1992
English forests $0.8-2.6 per person per visit See Bateman et al, 1999
Willis and Benson, 1989
UK forests $0.8-2.4 per person per visit See Bateman et al, 1999
Hanley, 1989
Scottish forests $2.5 per person per visit See Bateman et al, 1999
Willis et al. 1998
English forests $0.5-2.0 per person per visit See Bateman et al, 1999
Bateman and Langford, 1997
English forest $1.0 per person per visit See Bateman et al, 1999
Elsasser, 1999
German forests $42 pp/pa to visit all forests: day users
$13 pp to visit one forest during stay in region
Clinch, 1999. Irish forests $16 per household, = $250/ha (both
present values) Landscape, recreational and wildlife values
Scarpa, et al. 2000. Irish forests $1.4 to 3.6 per visit. Rise by $0.2 to
$0.6 per visit if national park status conferred
5.9 Amenity values