Available Online atwww.ijcsmc.com
International Journal of Computer Science and Mobile Computing
A Monthly Journal of Computer Science and Information Technology
ISSN 2320–088X
IJCSMC, Vol. 4, Issue. 12, December 2015, pg.313 – 323
An Innovative and Automatic Lung
and Oral Cancer Classification Using
Soft Computing Techniques
Mr. Tanupriya Choudhury
1, Prof.(Dr.) Vivek Kumar
2, Dr. Darshika Nigam
31Research Scholar (CSE), Jagannath University, Jaipur, India
²
Principal, Delhi College of Technology and Management, Palwal, India³
Department of BioChemistry, SLS, Dr. B.R. Ambedker University, Agra, India1 [email protected]; 2 [email protected]; 3 [email protected]
Abstract:
Lung and Oral Cancer are the most common diseases found in the majority of the populations in recent years. Medical diagnosis is colossally crucial but intricate task that should be accomplished exactly and proficiently. Although momentous progress has been made in the diagnosis and treatment of these diseases, further investigation is still desired. Soft Computing & DM techniques is the use of algorithms to mine the information and designs derived by the knowledge discovery from databases. Classification maps data into predefined groups or classes .The prognosis and diagnosis of cancer has been a challenging research problem for many researchers. The main objective of this proposed work is to compare the performance analysis of various soft computing and DM techniques to identify the Lung & Oral cancer prediction. This work employs different kinds of neural network classifiers. It confirms that the MLP networks produce more specific, accurate results compared to other techniques for Lung and Oral Cancer datasets.I. INTRODUCTION
In classification learning, the learning scheme is depicted with a set of classified examples from which it is expected to learn a way of classifying unseen examples. While in association learning any association among features is sought not just ones that predict a particular class value. Whereas in clustering, groups of examples that belong together are sought.
occurred regarding tobacco consumption, particularly in men in Western Europe, lung cancer remains a huge health problem as a result of environmental changes and pollution.
The relevant International Classification of Disease (ICD) codes (used to code and classify mortality data from death certificates) are ICD-10 C33 (neoplasm of the trachea) and ICD-10 C34 (neoplasm of bronchus and lung)[21].
Research has intended to classify patients with early- stage disease in the hope of improving persistence and developing individualized therapies for patients with advanced disease. Oral cancer is highly related to the sex of the patient, with males face double the risk of being diagnosed with oral cancer than females. The known risks associated with Oral and Lung cancer include smoking, alcohol consumption, tobacco use, and betel quid chewing[32].
Besides risks factors, there are other factors associated with oral cancer such as viral infection, diet, genetic factors and poor oral hygiene (Jefferies & Foulkes, 2001; Reichart, 2001; Sunnitha & Gabrial, 2004; Mehrotra & Yadav, 2006). The WHO(World Health Organization) expects a worldwide rise in oral cancer incidence in the next few decades due to high smoking dominance and increasing cases of unfit diet. Almost two-thirds of oral cancer occurs in developing countries like South East Asia, India and Brazil and this geographic variation probably reflects the occurrence of specific environmental influences and risk habits (Oliveira et al.,2008).
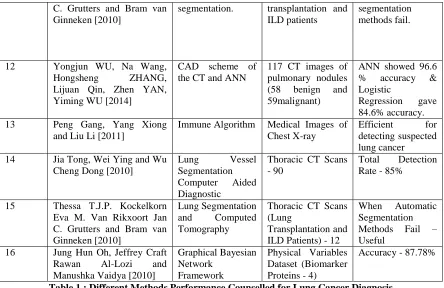
Sr. No Author & Year Published Methodology Datasets Performance
1 Wang Tao, Lv Jianping and Liu Bingxin, [2014]
RBFN, LLS, gradient descent
5,000 valid data as samples
95.32% accuracy
2 Yongjun WU, Na Wang, Hongsheng ZHANG Lijuan Qin Zhen YAN and Yiming WU [2015]
Computer Aided Diagnostic Scheme - CT and ANN
CT Images of Pulmonary Nodules - 117, (Benign -58 and Malignant -59)
ANN Illustrate - 96.6 % Accuracy & Logistic Regression - 84.6% 3 Fatma Taher & Rachid
Sammouda [2011]
HNN & FCM 100 sputum color images
HNN segmentation results were more accurate than FCM 4 Jung Hun Oh, Jeffrey Craft
Rawan Al-Lozi and Manushka Vaidya [2010]
Graphical Bayesian Network
Framework
Physical Variables Dataset (Biomarker Proteins - 4)
Accuracy - 87.78%
5 Ankit Agrawal and Alok Choudhary [2015]
Association rule mining & hotspots
A subset of 13 patient attributes from the SEER data
Survival time of patients increased.
6 Tadashi Kondo, Junji Ueno and Shoichiro Takao [2012]
GMDH medical images Diagnosis
efficiency can be improved.
7 S. Aravind Kumar, Dr. J. Ramesh, Dr. P. T. Vanathi and Dr. K. Gunavathi [2011]
Computer Aided Diagnosis,
Segmentation Fuzzy Systems
Slice Images - 685 (Clinical Cases - 40)
Classification Accuracy - 90%
8 Hamada R. H. AI-Abs Brahim Belhaouari Samir Khaled Bashir Shaban and Suziah Sulaiman [2012]
Machine Learning Techniques
Chest Radiographs - 247 (Nodules Images - 154 and Normal Images - 93)
Classification Accuracy - 96%
9 Aminmohammad
Roozgard, Samuel Cheng, and Hong Liu [2012]
kernel RX-algorithm
CT images from of size 512 x 512
Proved efficient.
10 Xiaozhou Li, Rong Wang and Ming Lei [2011]
Fluorescence Spectroscopy
36 serums 83.3% classification accuracy 11 Thessa T.J.P. Kockelkorn,
Eva M. van Rikxoort, Jan
Computed
tomography, lung
12 thoracic CT scans from lung
C. Grutters and Bram van Ginneken [2010]
segmentation. transplantation and ILD patients
segmentation methods fail.
12 Yongjun WU, Na Wang, Hongsheng ZHANG, Lijuan Qin, Zhen YAN, Yiming WU [2014]
CAD scheme of the CT and ANN
117 CT images of pulmonary nodules (58 benign and 59malignant)
ANN showed 96.6 % accuracy & Logistic
Regression gave 84.6% accuracy. 13 Peng Gang, Yang Xiong
and Liu Li [2011]
Immune Algorithm Medical Images of Chest X-ray
Efficient for detecting suspected lung cancer 14 Jia Tong, Wei Ying and Wu
Cheng Dong [2010]
Lung Vessel Segmentation Computer Aided Diagnostic
Thoracic CT Scans - 90
Total Detection Rate - 85%
15 Thessa T.J.P. Kockelkorn Eva M. Van Rikxoort Jan C. Grutters and Bram van Ginneken [2010]
Lung Segmentation and Computed Tomography
Thoracic CT Scans (Lung
Transplantation and ILD Patients) - 12
When Automatic Segmentation Methods Fail – Useful
16 Jung Hun Oh, Jeffrey Craft Rawan Al-Lozi and Manushka Vaidya [2010]
Graphical Bayesian Network
Framework
Physical Variables Dataset (Biomarker Proteins - 4)
Accuracy - 87.78%
Table 1 : Different Methods Performance Counselled for Lung Cancer Diagnosis
Oral Cancer in India: In the Indian subcontinent oral cancer has been a major disease, where it ranks among the top three types of cancer in the country. Age adjusted rates of oral cancer in India is very high, that is, 21 per 125,000 population and accounts for over 32% of all cancers in the country. The variation in incidence and pattern of the disease can be attributed to the combined effect of ageing of the population, as well as regional differences in the prevalence of disease-specific risk factors.
Oral cancer starts in the oral cavity. The oral cavity includes the lips, the inside lining of the lips and cheeks (buccal mucosa), the gums, the teeth, the floor of the mouth below the tongue, the front two-thirds of the tongue, the bony roof of the mouth (hard palate), and the area behind the wisdom teeth (retromolar trigone). Cancer cells can widely spread to other neighboring parts of the lungs, the neck or elsewhere in the body. A common metastasis occurs in the lymph nodes of the neck through the lymphatic system which helps the cancer cells to spread over. Although nowadays, the rigorous improvements in treatment protocols of cancer have attained high rates of successful disease disappearance, there is a vital stage for the disease evolvement after the treatment called remission. During this stage there is no clinical, laboratory or imaging evidence of the neoplastic mass and the patient is considered cancer free.
But, even at this point some “invisible” particles of disease might be emerging out, which leads to a potential spread or metastasis of the disease. Specifically, in terms of oral cancer, locoregional reoccurrence rates after the disease has reached remission have been reported in the range of 26-50%; such high figures can be justified given the deeply infiltrative nature of these tumors, as well as, the significant potential for occult neck metastasis.
II. SOFT COMPUTING &DATA MINING METHODS
Soft Computing is a branch of artificial computational intelligence that employs a variety of statistical, probabilistic and optimization techniques that allows computers to “learn” from past examples and to detect hard-to-discern patterns from large, noisy or complex data sets. This capability is particularly well-suited to medical applications, especially those that depend on complex proteomic and genomic measurements.[17]
As a result, computational intelligence is frequently used in cancer diagnosis and detection. More recently soft computing has been applied to cancer prognosis and prediction. A number of trends are there, including a growing dependence on protein biomarkers and microarray data, a strong bias towards applications in prostate and breast cancer, and a heavy reliance on “older” technologies such artificial neural networks (ANNs) instead of more recently developed or more easily interpretable soft computing techniques.[23]
A number of published studies also appear to lack an appropriate level of validation or testing. Among the better designed and validated studies it is clear that soft computing techniques can be used to substantially (15– 25%) improve the accuracy of predicting cancer susceptibility, recurrence and mortality. At a more fundamental level, it is also evident that computational intelligence is also helping to improve basic understanding of cancer development and progression.
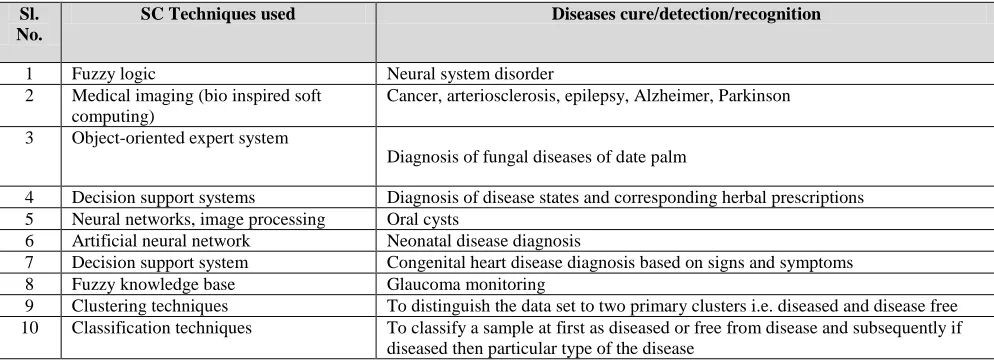
The techniques of soft computing may include neural network, fuzzy set theory, genetic algorithm and simulated annealing etc. The below stated table describes the strength of the soft computing techniques.
Table 1: Various Methodologies For Soft Computing
S.Nm. Methodology Strength
1 Neural Networks Learning & Adaption
2 Fuzzy Logic and fuzzy set theory Knowledge representation via fuzzy if-then rules 3 Genetic algorithm and simulated annealing Systematic random search
4 Conventional AI Symbolic manipulation
Table 2: Various Soft Computing Techniques In Diagnostics Of Diseases [30][31][32]
Sl. No.
SC Techniques used Diseases cure/detection/recognition
1 Fuzzy logic Neural system disorder
2 Medical imaging (bio inspired soft computing)
Cancer, arteriosclerosis, epilepsy, Alzheimer, Parkinson
3 Object-oriented expert system
Diagnosis of fungal diseases of date palm
4 Decision support systems Diagnosis of disease states and corresponding herbal prescriptions 5 Neural networks, image processing Oral cysts
6 Artificial neural network Neonatal disease diagnosis
7 Decision support system Congenital heart disease diagnosis based on signs and symptoms 8 Fuzzy knowledge base Glaucoma monitoring
9 Clustering techniques To distinguish the data set to two primary clusters i.e. diseased and disease free 10 Classification techniques To classify a sample at first as diseased or free from disease and subsequently if
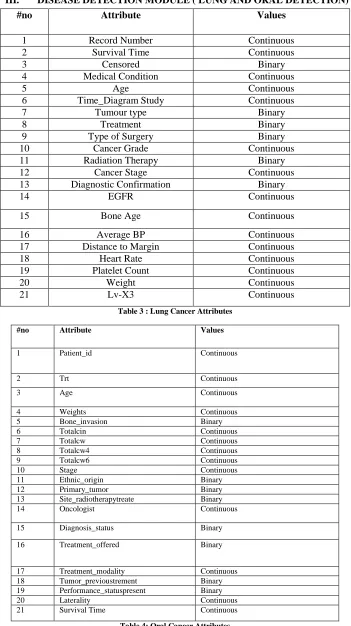
III. DISEASE DETECTION MODULE ( LUNG AND ORAL DETECTION)
#no Attribute Values
1 Record Number Continuous 2 Survival Time Continuous
3 Censored Binary
4 Medical Condition Continuous
5 Age Continuous
6 Time_Diagram Study Continuous 7 Tumour type Binary
8 Treatment Binary
9 Type of Surgery Binary 10 Cancer Grade Continuous 11 Radiation Therapy Binary 12 Cancer Stage Continuous 13 Diagnostic Confirmation Binary
14 EGFR Continuous
15 Bone Age Continuous 16 Average BP Continuous 17 Distance to Margin Continuous 18 Heart Rate Continuous 19 Platelet Count Continuous
20 Weight Continuous
21 Lv-X3 Continuous
Table 3 : Lung Cancer Attributes
#no Attribute Values
1 Patient_id Continuous
2 Trt Continuous
3 Age Continuous
4 Weights Continuous
5 Bone_invasion Binary
6 Totalcin Continuous
7 Totalcw Continuous
8 Totalcw4 Continuous
9 Totalcw6 Continuous
10 Stage Continuous
11 Ethnic_origin Binary
12 Primary_tumor Binary
13 Site_radiotherapytreate Binary
14 Oncologist Continuous
15 Diagnosis_status Binary
16 Treatment_offered Binary
17 Treatment_modality Continuous
18 Tumor_previoustrement Binary 19 Performance_statuspresent Binary
20 Laterality Continuous
21 Survival Time Continuous
Multilayer Perceptron (Mlp):
An MLP is a network of simple neurons called perceptron. The perceptron computes a single output from multiple real-valued inputs by making a linear combination according to its input weights and then probably putting the output through some nonlinear activation function.
Equation 1
Where w- vector of weights, , b- bias, x- vector of Inputs and Activation Function
Logistic Sigmoid
Equation 2
The calculations done by such a feed forward network with a one hidden layer with not a linear activation functions and a linear output layer can be written mathematically as
Equation 3
Where is a vector of inputs and a vector of outputs. is the matrix of weight of the first layer, is the bias vector of the 1st layer. and are, respectively, the matrix of weight and the bias
vector of the second layer. The function denotes an element wise nonlinearity.
Squared Reconstruction Error
Equation 4
Using the Simple logistic algorithm and MLP the lung and oral cancer has been further divided for better prediction and also a survey of genetic expression of microarray technology has been projected for cancer detection in earlier stage. The same attributes for oral and lung cancer which has taken in earlier has been used over here in a further customized way to check the best solution. Earlier for basically image detection methods all the detection methods are used. Here all the detection methods are purely experimental and mathematical analysis based on the clinical value of the attributes[12].
function. The theorem of universal approximation for neural network states that every continuous function that maps real number intervals to some output interval of real numbers can be approximated arbitrarily nearby a multi-layer perceptron with a single hidden layer. This result holds only for restricted „activation functions‟ classes, for instance, the sigmoid functions. Networks of multi layers use a variety of learning methods, the most prevalent being „back-propagation‟. In this the values of the outputs are compared with the correct answer to compute the value of few predefined error-function. With the help of various techniques the error is then fed back through the network. The algorithm alters the weights of each and every connection using the above information, to reduce the value of the error function by some little amount. Then after repeating the process for an adequately huge number of training cycles the network will generally meet to some state in which the calculation‟s error is small. In this case one says that the network has learned a definite target function. In order to adjust weights accurately one needs to apply a general method for non-linear optimization task that is known as „gradient descent‟. For this, the error function‟s derivative with respect to the network weights is computed and the weights are again changed so that the error descends (thus going down on the surface of error function). For this motive, only back-propagation can be applied on networks with distinguishable activation functions. In general the problem of training a network to perform well, even on samples that were not used as samples for training, is a pretty subtle issue that needs extra techniques. This is especially significant for cases in which only very restricted numbers of training samples are obtainable. The threat is that the network unable to fits the training data and unable to seize the true statistical process giving the data. Computational learning theory deals with training classifiers on a very restricted amount of data. In this context of neural networks a simple heuristic, called early „stopping‟, usually makes sure that the network will simplify well to examples not in the training set. Other typical disadvantages of the back-propagation algorithm are the convergence‟s speed and the possibility of finishing up in a local least of the error function. Now there are real-world solutions that can make back - propagation in many layer perceptron‟s the solution of choice for many machine learning tasks.
IV. Performance Evaluation and Experimental Results
In this section we verified the advantages and properties of our approach by means of lung and oral cancer data set and also we present the performance of Multilayer Perceptron and SLA. The performance of classification algorithms is usually tested by evaluating the accuracy of the concerned classification. Classification accuracy is generally computed determining the percentage of instances placed in the correct class. This rejects the fact that there may be an associated cost involved with a wrong assignment related to the wrong class. We test the performance of classification as is done with information retrieval systems. Only with two sets of classes, the possible outcomes are four in number with the classification. But, the upper left and lower right quadrants are the right actions. The remaining two quadrants are wrong actions:-
Table 5: Properties of Dataset
Dataset Instances Attributes
Lung 15 21
Oral 524 21
Table 6: Classification Accuracy
Data Mining Techniques Classification Accuracy for Lung Classification Accuracy for Oral
Multilayer Perceptron 73.3 99.82
Simple Logistic 60.00 99.78
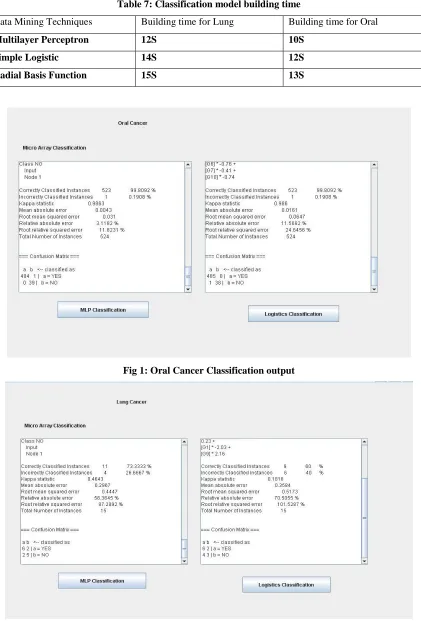
Table 7: Classification model building time
Data Mining Techniques Building time for Lung Building time for Oral
Multilayer Perceptron 12S 10S
Simple Logistic 14S 12S
Radial Basis Function 15S 13S
Fig 1: Oral Cancer Classification output
73.3
60 59.67
99.82 99.78 93.46
0 20 40 60 80 100 120
Multilayer Perceptron
Simple Logistic Radial Basis
Function
Classification Accuracy
Classification Accuracy for Lung
Classification Accuracy for Oral
Fig 3: Classification accuracy for Lung Cancer & Oral Cancer Using MLP,SLA,RBF
12
14 15
10
12 13
0 2 4 6 8 10 12 14 16
Multilayer Perceptron
Simple Logistic Radial Basis Function
Accuracy For Model Building Time
Building time for Lung(in sec)
Building time for Oral(in sec)
Fig 4: Accuracy measurement for model building time in seconds for Lung Cancer & Oral Cancer
Using MLP, SLA, RBF
This segment gives a detailed performance evaluation of MLP, SLA and RBFN. Classification Accuracy is the principal metric for estimating classifier performance and the percentage of test samples that are appropriately and properly classified.
Natural performance measure for classification problems: • Success: instance‟s class is predicted correctly
• Error: instance‟s class is predicted incorrectly
• Error rate: proportion of errors made over the whole set of instances
• Accuracy: proportion of correctly classified instances over the whole set of instances Accuracy = 1 – error rate.
V. INVESTIGATIONAL RESULTS
In this section it demonstrated the properties and advantages of our approach by means of lung, oral cancer data set and also present the performance of MLP, SLA & RBFN, correspondingly. The enactment of classification algorithms is typically scrutinized by estimating the correctness of the classification. Classification accuracy is usually intended defining the percentage of occurrences placed in the correct class. This superintends the fact that there also may be a cost related with an incorrect assignment to the wrong class. This perhaps should also be determined. Here the Performance of classification much as is done with attribute selection methods & IRS. With individual two classes, there are four probable consequences with the classification. The upper left and lower right quadrants are correct actions. The remaining two quadrants are incorrect actions.
From the experimental results it is very much clear that by using MLP to classify Lung & Oral cancer it gives the best suitable output than the other two methods SLA and RBFN respectively. Not only in classifying results it is also fastest algorithm for prediction than others as it just taken 12 seconds and 10 seconds to build the model or to make the output in a classified manner to detect lung and oral cancer respectively.
VI. CONCLUSION & FUTURE WORK
Classification is a significant difficulty in data mining. In this work the proposed system settled three different kinds of neural network classifiers: MLP, SLA, RBFN classifier to measure the classification accurateness for Lung and Oral Cancer data set. The decision-making was talented using three Classifiers (MLP, SLA, RBFN), with Lung and Oral cancer data set. The accurateness depends on numerous influences, such as the size and excellence of the training set and also constraints chosen to characterize the input. Having said this, the MLP networks produce more specific, accurate results compared to SLA and RBFN. In future the methods will be used for discovering systems for more large data sets and more complex one by adding immunology of the patient so that the prediction percentage will be more high and reliable.
REFERENCES
[1]N. Friedman, M. Linial, I. Nachman & D. Pe‟er (2000), “Using Bayesian Network to Analyze Expression Data”, Journal of. Computational Biology, Vol. 7, Pp. 601–620.
J. Han & M. Kamber (2000), “Data Mining; Concepts and Techniques”, Morgan Kaufmann Publishers. [2] D.R. Masys (2001), “Linking Microarray Data to the Literature”, Nature Genetics, Vol. 28, Pp. 9–10. [3] R. Nayak, L.C. Jain & B.K.H. Ting (2001), “Artificial Neural Networks in Biomedical Engineering: A Review”, Asia-Pacific Conference on Advance Computation.
[4] H. Midelfart, J. Komorowsk, K. Nørsett, F. Yadetie, A.K. Sandvik & A. Lægreid (2002), “Learning Rough Set Classifiers from Gene Expression and Clinical Data”, Fundamental Informatica, Pp. 155–183. [5] Z. Pawlak (2002), “Rough Set Theory and its Applications”, Journal of Telecommunications and Information Technology, Pp. 7-10.
[6] E. Hassanien & J.M.H. Ali (2004), “Rough Set Approach for Generation of Classification Rules of Breast Cancer Data”, Informatica, Vol. 15, No. 1, Pp. 23–38.
[7] L.B. Gonçalves, M. M. B. R. Vellasco, M.A.C. Pacheco & F.J. De Souza (2005), “Inverted Hierarchical Neuro - Fuzzy BSP System: A Novel Neuro-Fuzzy Model for Pattern Classification and Rule Extraction in Databases”, IEEE Transactions on Systems, Man, and Cybernetics, Part C: Applications and Reviews, Vol. 36, No. 2, Pp. 236–248,
[8] I.H. Witten & E. Frank (2005), “Data Mining Practical Machine Learning Tools and Techniques”, Second Edition, Morgan Kaufmann Publisher, United States of America.
[9] M. Rocha, Paulo Cortez & José Neves (2007), “Evolution of Neural Networks for Classification and Regression”, Neurocomputing, Vol. 70, No. 16–18, Pp. 2809–2816.
[10] Emad W. Saad & Donald C. Wunsch (2007), “Neural Network Explanation using Inversion”, Neural Networks, Vol. 20, Pp. 78–93.
[11] Y. Zhao & Y. Zhang (2007), “Comparison of Decision Tree Methods for Finding Active Objects”, National Astronomical Observatories, Advances of Space Research, Vol. 41, Pp. 1955–1959.
[13] J.M. David & K. Balakrishnan (2010), “Machine Learning Approach for Prediction of Learning Disabilities in School-Age Children”, International Journal of Computer Applications, Vol. 9, No. 11, Pp. 7–12.
[14] Mehdi Neshat & Abas E.Zadeh (2010), “Hopfield Neural Network and Fuzzy Hopfield Neural Network for Diagnosis of Liver Disorders”, 5 th IEEE International Conference Intelligent Systems (IS), Pp. 162–167.
[15] W.N.H.W. Mohamed, M.N.M. Salleh & A.H. Omar (2012), “A Comparative Study of Reduced Error Pruning Method in Decision Tree Algorithms”, IEEE International Conference on Control System, Computing and Engineering, Pp. 392–397.
[16] S. Mandal, G. Saha & RK. Pal (2013), “An Approach Towards Automated Disease Diagnosis & Drug Design using Hybrid Rough-Decision Tree from Microarray Dataset”, Journal of Computer Science & Systems Biology, Vol. 6, Pp. 337–343.
[17] S. Mandal & G. Saha (2013), “Rough Set Theory based Automated Disease Diagnosis using Lung Adenocarcinoma as a Test Case”, The SIJ Transactions on Computer Science Engineering & its Applications (CSEA), Vol. 1, No. 3, Pp. 75– 82.
[18] S. Mandal, G. Saha & RK. Pal (2013A), “Reconstruction of Dominant Gene Regulatory Network from Microarray Data using Rough Set and Bayesian Approach”, Journal of Computer Science & Systems Biology, Vol. 6, Pp. 262–270.
Michie, D., Spiegelhalter, D. J., & Taylor, C. (1994). Machine learning. Neural and statistical classification. Ellis Horwood.
[19]Margaret H.Dunham, “Data Mining - Introductory and Advanced Topics” Pearson Education, 2003, pp. 106-112.
[20] Shital Shah, Adrew kusiak (2007), “Cancer gene search With datamining and genetic algorithms”, Computers in Biology and Medicine, Volume 37, issue 2, pp. 251-261, Elsevier.
[21] Linua Li, Hong Tang, Zuobao Wu, Jianli Gong, Michael Gruidl, Jun Zou, Melvyn Tockman, Robert A.Clark, (2004), “Data Mining techniques for Cancer detection using serum proteomic profiling”, Artificial Intelligence in Medicine, 32(2), pp 71-83, Elsevier.
[22] Jiawei Han, Micheline Kamber “Data Mining – Concepts and Techniques” Elsevier, 2003, pp 360 to 365.
[23] Bharath, Ramachandran. Neural Network Computing. McGrawHill, Inc., New York, 1994. pp. 4-43. [24] Margaret H.Dunham, “Data Mining- Introductory and Advanced Topics” Pearson Education, 2003, pp. 112-114
[25] A.Jemal, T.Murray, E.Ward, et al. “Cancer statistics 2005, CA :Cancer J.Clin. 55 (2005). pp. 10-30. [26] P.Sharma, N.S.Sahni, T.Robert, P.Skaane, U.Petter, B.Hege, J.Marianne, K.Lena, M.Cecilie, S.Pradeep, Z.Alia, A.Jarle, S.Torill, A.A.Lars, S.Ellen, B.Anne-Lise, L.Anders, “Early detection of breast cancer based on gene-expression Patterns in peripheral blood cells, Breast Cancer Res. 7 (2005) R634-R644
[27] M.Gautherine, C.Gross, “Contribution of infrared thermography to early diagnosis, pretheraputic and post-irradiation follow-up of breast carcinomas”, Med Mundi. 21(1976) pp. 135-149.
[28] J.R.Harris, M.E.Lippman, U.Vernoesi, W.Willet, “Breast cancer (Part-I), N.Engl.J.Med. 327 (1992) pp. 319-328.
[29]E.Y.K.Ng, Y.Chen, L.N.Ung, “Computerised breast thermography: study of image segmentation and temperature cyclic variations, Int.J.Med.Eng. Technol. 25 (2001) pp. 12-16.
[30]F. Chu, W. Xie, And L. Wang, “Gene Selection And Cancer Classification Using A Fuzzy Neural Network,” In Proc. 2004 Annu. Meet. North Amer. Fuzzy Information Processing Soc. (NAFIPS), Vol. 2, Pp. 555–559
[31]S. Mitra, “An Evolutionary Rough Partitive Clustering,” Pattern Recognit. Lett., Vol. 25, Pp. 1439– 1449, 2004