Silica fouling in coal seam gas water in reverse
osmosis desalination
By
Lyudmila (Lucy) Lunevich
Master of resource and environmental planning – Massey
University – New Zealand
Master of sanitation engineering – Riga Technical University –
Latvia
Bachelor of process engineering – Polytechnic Institute – Belarus
A thesis submitted to Victoria University, Melbourne – Australia
for the degree of Doctor in Philosophy
The Institute for Sustainability and Innovation at Victoria
University
i
Abstract
Silica precipitation and silica scale formation on membrane surfaces in RO desalination present a significant operational challenge in water purification. Silica scale formation on the membrane surface leads to flux decline, RO system productivity lost, membrane degradation, and increased cost of chemicals. In spite of the apparent simplicity of silica’s composition and scale formation on the membrane surface, fundamental questions and empirical knowledge persist about the formation, solubility and behaviour of silica species during the silica polymerisation, precipitation and scale formation.
The broad objective of the present study was to define conditions and factors affecting silica polymerisation and precipitation in coal seam gas (CSG) waters in Australia. The scope of the problem was narrowed to focus on dissolved silica species studied by 29Si
NMR spectroscopy, removal of silica by coagulation as pre-treatment step for RO desalination and silica fouling patterns in RO desalination for a range of salinities in both synthetic and CSG waters to develop a conceptual model of silica precipitation and deposition on the membrane surface.
The CSG industry in Australia generates significant quantities of CSG water, especially during the first 3-5 years of reservoir development when the hydraulic pressure needs to be released to extract the gas from coal seam. To avoid high cost of brine treatment and residual disposal frequently requires high recovery RO desalination to treat CSG water to level acceptable for further re-use. Furthermore, CSG waters in Australia have all four critical parameters, which potentially lead to silica precipitation prior it reached the solubility limit. These parameters include medium to high salinity, medium silica concentrations, high alkalinity at pH9 and slightly elevated aluminium concentrations.
ii
in various synthetic, salinity waters in the absence of aluminium likely as a result of sodium ions serving as barrier preventing deposition of dissolved silica species and colloidal silica structures; (2) effect of sodium ions on dissolved silica species studied by 29Si NMR showed that sodium shield dissolved silica species and at the same time
stimulate release of monomeric silicic acid as a result of close interaction between sodium ions and water shell; (3) effect of aluminium on dissolved silica species studied by 29Si NMR and coagulation by ACH coagulant in various salinity coal seam gas
iii
Declaration
‘I, Lyudmila (Lucy) Lunevich, declare that the PhD thesis entitled Silica fouling in coal seam gas water in reverse osmosis desalination is no more than 100,000 words in length including quotes and exclusive of tables, figures, appendices, bibliography, references and footnotes. This thesis contains no material that has been submitted previously, in whole or in part, for the award of any other academic degree or diploma. Except where otherwise indicated, this thesis is my own work’.
iv
Acknowledgement
The contents of this volume are based on more than three and a half years of part-time and full-time research work. During this time the author has been a member of the team of PhD students at the Institute for Sustainability and Innovation, College of Engineering and Science, Victoria University, Melbourne. During the PhD research the author has also spent 10 months working for a major coal seam gas operator in Queensland, Australia. Experimental works such as water quality testing, analysis, pre-treatment studies were performed on coal seam gas fields and their respective laboratory. The majority of the experimental works were performed at Victoria University, Werribee Campus and 29Si NMR experimental works were performed at Victoria University, Footscray Campus.
The references listed in this volume are intended as references only. The list is not a complete literature review of the topics covered. Much more literature was reviewed during the course of research, especially in the first year of the PhD. This is in partly due to the novelty of the material, and, in part, its breadth covering many fields.
The thesis covers three major studies: 29Si NMR dissolved silica species studies,
removal of silica by coagulation before RO desalination and silica fouling (precipitation) in a RO bench-scale system after the water was pre-treated with coagulant and ultrafiltration. A range of salinity synthetic and CSG waters were studied. Dissolved silica species, which have particular impact on silica scale formation, were studied under impacts of sodium and aluminum ions and pH conditions by 29Si NMR
spectroscopy.
The 29Si NMR study, outlined in chapter 4, reported in this volume cannot be
v
shielding effect of different impurities on the silica species, in the hope that others can reach a stage where direct practical application is possible within the industries dealing with the dissolved silica species.
Professor Stephen Gray, head of the Institute for Sustainability and Innovation, has been responsible for arranging this study, providing the necessary financial support and approval for the author the freedom to work in different areas of this project. He has also provided laboratory space as well as initially suggesting that a study in the area of salinity impact of silica solubility be conducted thus resulting in the process leading to this thesis. Dr Peter Sanciolo significantly contributed to development of the initial method of silica fouling studies in RO system. Later this method was re-designed by the author.
The author wishes to sincerely thank Professor Stephen Gray and Doctor Peter Sanciolo for unconditional support and interest for these endeavors. Thank you for putting up with me and being so supportive of this research. Thanks are also extended to Professor Andrew Smallridge for the considerable time invested in 29Si NMR spectroscopy studies, for providing advice on the techniques, time and expertise. Thank you to Professor Raphael Semiat at the Technion, Israel Institute of Technology, Haifa for encouragement to research with Professor Stephen Gray at Victoria University.
The author would also like to acknowledge the assistance rendered from other institutions - the consultations on the chemistry of colloidal silica by Professor Thomas Healy (retired) at the University of Melbourne. Thanks to Professor Jeremy Joseph (retired) at the Royal Holloway University of London and my ex-colleague from URS Corporation Ltd, Melbourne, who kindly accepted to mentor me over this journey and for sharing a wealth of his research expertise generally and, in particular, in CSG water management and treatment.
vi
My thanks also go to the following people that either share wealth of their academic expertise or industry experience, or helping to collect data on field and laboratory, organizing field trips in Queensland:
- Professor Johanna Rosier at the University of Sunshine Coast for encouragement and the motivation to work towards a PhD;
- Professor Ron Adams for his excellent lectures on research conceptualization, and sharing his academic experience during the PhD coursework;
- Dr Ludovic Dumee at Deakin University for assistance with EDS electronic microscope membrane examination works, SEM training and considerable SEM works and for making himself available whenever it was required;
- Dr Nicholas Milne for sharing publications on silica chemistry, helping set up RO experimental system and souring parts and equipment;
- Dr Malene Cran for training with many experimental techniques at VU, providing technical support on the quality of seawater and brackish water membranes and for wise and timely advice;
- Mr Noel Dow for technical advice on experimental equipment, training, and providing assistance when needed;
- Dr Jianhua Zhang for helping to maintain RO equipment during the experimental works and for sharing his research experience;
- Mrs Catherine Enriquez for the administration support and for helping to follow the University procedures;
- Mr Peter Warda, Chief Engineer at Shell Global Solutions for reviewing technical publications and taking incredible interest in my PhD research;
- Dr Jeuron Van Dillewijn, Liquid Natural Gas Water Manager at Shell Global Solutions for providing access to CSG waters on fields, access to the comprehensive water quality database, the opportunity to perform pre-treatment of CSG water in the laboratory and for presenting it to Shell Global Engineering panel (Canada) for cross examination and review;
vii
- Mr Nikolai Lunevich, my husband for support, patience, and relocation for 10 month to Brisbane while I was working there, without him I would not be able to fully focus on this interesting and life challenging project;
- My children Catherine and Eugene for their financial support, allowing me to focus on the research for a considerable period of time, for their interest in my experimental works, debate at home about the uniqueness of the silica science and its significant variety of industrial applications.
The author would like to thank you the administration staff at the Institute for Sustainability and Innovation, Victoria University, Werribee for working hard to ensure the research laboratory is safe and in good working condition, and for your professionalism. It is very much appreciated.
viii
Conference and presentations
Lunevich, L., Sanciolo, P., Gray, S., Silica polymerisation and its effect on RO desalination, Institute for Sustainability and Innovation, Victoria University 3030, Melbourne, Australia, International Membrane Science and Technology Conference 2012 (IMSTEC2013), Brisbane, November 24 - 28, Membrane Society of Australasia (MSA).
Lunevich, L., Milne. N., Sanciolo, P., Gray, S., Coal seams gas water environmental management practice in Australia, Victoria University 3000, Melbourne, Australia, Student Conference Melbourne, July 21 – 22, 2012.
Lunevich, L., Sanciolo, P., Smallridge, A., Gray, S., On the Silica Edge – Silica Polymerization, Institute for Sustainability and Innovation, Victoria University 3030, Melbourne, Australia, International Membrane Science and Technology Conference 2013 (IMSTEC2013), Melbourne, November 25-29, Membrane Society of Australasia (MSA).
Oral presentations
November 2012 Brisbane, Queensland – Australia – International Membrane Science and Technology Conference, talk on a Silica polymerisation and its effect on RO desalination, Institute for Sustainability and Innovation, Victoria University 3030, Melbourne, Australia, International Membrane Science and Technology Conference 2012 (IMSTEC2013), Brisbane, November 24 - 28, Membrane Society of Australasia (MSA).
ix
May 2014 Melbourne, talk on Water and brine management strategy in coal seams gas water industry in Australia, Victoria University 3000, Melbourne, Australia, Student Conference Melbourne, July 21 – 22, 2012.
July 2015 Singapore – 2nd International Conference in Desalination using Membrane Technology, talk on The Silica Edge – RO Desalination: Silica Fouling, Institute for Sustainability and Innovation, Victoria University 3030, Melbourne, Australia, Singapore, 26 – 29 July 2015, Desalination using Membrane Technology, (the abstract accepted for oral presentation).
x
Table of Contents
Abstract ... i
Declaration... iii
Acknowledgement ... iv
Conference and presentations ... viii
List of Tables ... xv
List of Figures ... xvi
List of common abbreviation ... xxii
Chapter 1 Introduction ... 1
1.1 Background ... 1
1.2 Problem statement ... 3
1.3 Significance ... 4
1.4 Objectives ... 4
1.5 Approach ... 5
Chapter 2 Literature review ... 8
2.1 RO system ... 8
2.1.1 Overview ... 8
2.1.2 RO technology ... 8
2.1.3 RO process ... 10
2.2 Membrane fouling ... 11
2.2.1 Colloidal fouling ... 14
2.2.2 Organic fouling ... 16
2.2.3 Inorganic fouling and silica solubility ... 16
2.2.4 Concentration polarisation (CP) ... 19
2.2.5 Chemical precipitation ... 21
2.2.6 Fouling models ... 21
2.3 Silica chemistry and its effect on RO desalination ... 24
2.3.1 Aqueous silica ... 24
2.3.2 Dissolved silica species ... 26
2.3.3 Colloidal silica ... 28
2.3.4 Silica polymerisation ... 29
2.3.5 Kinetics of silica polymerisation ... 32
2.3.6 Silica scale formation ... 34
2.3.7 Silica in salinity waters ... 35
xi
2.4 Coal seam gas water (CSG) in Australia ... 39
2.4.1 What is coal seam gas water ... 39
2.4.2 Physical and chemical properties ... 41
2.4.3 CSG water desalination ... 43
2.4.4 Silica removal by coagulation ... 47
2.5 Conclusion ... 49
2.6 Objectives ... 50
Chapter 3 Experimental method ... 51
3.1 Introduction ... 51
3.2 Experimental design ... 51
3.2.1 Bench-scale RO system ... 55
3.3 RO feed experimental solutions ... 61
3.3.1 Synthetic solutions ... 61
3.3.2 CSG waters ... 62
3.4 Analytical methods ... 65
3.4.1 Measurement of pH and conductivity ... 65
3.4.2 Inductive coupled plasma (ICP) spectrometry ... 66
3.4.2.1 Standard preparation ... 66
3.4.2.2 ICP calibration ... 66
3.4.2.3 Sample preparation ... 66
3.4.3 Silico-molybdate method ... 67
3.5 Coagulation experiments ... 68
3.5.1 Chemicals and reagents ... 68
3.5.2 Solution compositions ... 69
3.5.3 Apparatus and procedures ... 70
3.5.4 Coagulation process and salinity ... 74
3.6 Membrane examination ... 74
3.6.1 Scanning Electron Microscopy (SEM) ... 75
3.6.2 Energy Dispersive Spectroscopy (EDS) ... 75
3.7 29Si Nuclear Magnetic Resonance (29Si NMR) ... 76
3.7.1 Experimental design ... 77
3.7.2 29Si NMR acquisition parameters ... 79
3.7.3 29Si NMR samples ... 79
3.7.4 29Si NMR equipment and sampling tubes ... 79
3.7.5 Sodium silicate environment ... 80
xii
Chapter 4 29Si NMR study of dissolved silica species ... 83
4.1 Introduction ... 83
4.1.1 Concentration polarisation (CP) ... 84
4.1.2 Sample preparation ... 86
4.2 29Si NMR baseline solution ... 87
4.3 Effect of dilution with H2O ... 88
4.4 Effect of sodium ... 91
4.4.1 Quantitative composition ... 92
4.5 Effect of aluminium ... 98
4.5.1 Quantitative composition ... 98
4.6 Effect of pHs ... 102
4.6.1 High pH (9 – 11.5) ... 102
4.6.2 Low pH (2 – 3) ... 104
4.6.3 pH (5 – 8) ... 107
4.7 Discussion ... 107
4.8 Conclusion ... 112
Chapter 5 Silica removal by coagulation ... 114
5.1 Introduction ... 114
5.1.1 Objectives of experiment ... 114
5.1.2 Rational for salinity investigation ... 115
5.2 Results of jar tests ... 117
5.2.1 Coagulants and best doses ... 117
5.2.1.1 Turbidity removal (groundwater) ... 117
5.2.1.2 Effect of pH on turbidity removal ... 120
5.2.2 DOC removal (groundwater) ... 121
5.2.2.1 Effect of pH on DOC removal ... 123
5.2.3 Metals removal (groundwater) ... 124
5.2.4 Silica removal (groundwater) ... 125
5.2.5 Turbidity removal (storage dam water) ... 128
5.2.6 Silica removal (storage dam water) ... 130
5.2.7 Aluminium residual ... 132
5.2.8 Effect of salinity ... 133
5.2.8.1 Experimental ... 133
5.2.8.2 Effect of sodium ... 133
5.3 Discussion ... 137
xiii
Chapter 6 RO silica fouling ... 145
6.1 Introduction ... 145
6.1.1 Experimental ... 145
6.2 Data analysis ... 145
6.2.1 Types of silica fouling ... 145
6.2.2 Normalised flux ... 147
6.3 Results ... 149
6.3.1 Stable and maximum silica concentrations ... 149
6.3.2 Practical silica solubility ... 151
6.3.3 SiO2 – HO2 system ... 153
6.3.3.1 Silica precipitation at pH3, pH9 and pH11... 153
6.3.3.2 Membrane surface examination ... 156
6.3.4 Synthetic water ... 157
6.3.4.1 RO residual silica concentration ... 157
6.3.4.2 Effect of salinity ... 160
6.3.3.3 Effect of pH ... 161
6.3.4.4 Membrane surface examination ... 164
6.3.5 CSG water ... 167
6.3.5.1 RO residual silica concentration ... 167
6.3.5.2 Effect of salinity ... 171
6.3.5.3 Effect of pH ... 173
6.3.5.4 Membrane surface examination ... 175
6.3.6 Effect of aluminium ... 176
6.3.6.1 Flux decline ... 176
6.3.6.2 Aluminium-silicate fouling ... 178
6.3.6.3 Membrane surface examination ... 180
6.4 Discussion ... 181
6.5 Conclusion ... 188
Chapter 7 Conclusion and future research ... 191
7.1 Summary ... 191
7.2 Conclusion ... 191
7.4 CSG water ... 195
7.5 Significance ... 197
7.5 Recommendation for future research ... 198
Reference ... 202
xv
List of Tables
Table 2.1 Silica solubility vs pH values. 24
Table 2.2 Silica solubility vs temperature. 24
Table 3.1 Experimental conditions for synthetic waters. 51
Table 3.2 Experimental conditions for CSG waters. 53
Table 3.3 RO operating parameters and maximum operation limits. 55 Table 3.4 Dow Filmtec SW30HRLE membrane characteristics. 57
Table 3.5 CSG water quality. 61
Table 3.6 Water quality analysis for composite samples. 67 Table 3.7 29Si NMR shift observed for the initial concentrated sodium
silica solution and corresponding relative quantities of silicon in
each Qn type surrounding. 74
Table 3.8 29Si NMR experimental solutions and pH conditions. 76 Table 3.9 29Si NMR acquisition parameters by a Bruker DPX300
Spectrometer. 77
Table 3.10 29Si chemical shifts, of silicate anions identified in sodium
silicate solutions in accordance with (Stoberg, 1996). 80 Table 4.1 29Si NMR chemical shift observed for the mother sodium silicate
solution (baseline sample). 86
Table 5.1 The measurement of the sludge height between the top of the sludge and the bottom of the breaker. (Measurements of floc size during coagulation of CSG water (2013) with 50 mg/L ACH at
pH8.23). 117
Table 5.2 Summary of the coagulation by ACH, ferric chloride and aluminium sulphate for CSG water collected in 2014 (initial total silica =22.68 mg/L, initial dissolved silica = 11.88 mg/L). 126 Table 5.3 Summary of silica (as SiO2) removal by coagulation using ACH,
ferric chloride and aluminium sulphate for dam water at 200, 400 and 600mg/L doses at initial total silica concentration 25mg/L
and dissolved silica 20mg/L. 130
Table 5.4 Residual aluminium recorded in raw CSG waters and in post-coagulated treated CSG waters at various coagulation doses by
ACH and aluminium sulphate. 131
Table 6.1 Recovery rate vs concentration factors. 146
Table 6.2 Salinity vs normalised flux. 148
Table 6.3 RO feed compositions, flux and permeate recovery, stable and
maximum residual silica solubilities. 152
Table 6.4 Summary of silica precipitations for synthetic waters. 158 Table 6.5 Summary of silica precipitations for CSG waters. 169 Table 6.6 Summary of silica precipitations in different salinity CSG waters. 173 Table 6.7 Maximum and stable residual silica concentration for different
salinity waters at pH9 (20ₒC). 182
xvi
List of Figures
Fig. 2.1 Representation of the resistant encountered by flow through a
fouled membrane. 22
Fig. 2.2 Structure of two typical Si7O18H4Na4 molecules present in in the
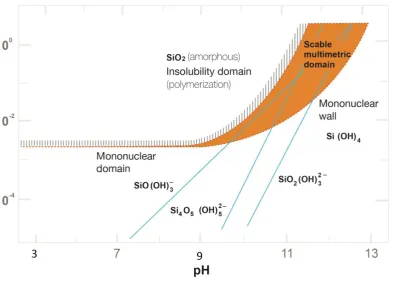
initial concentrated sodium silicate mother solution. 26 Fig. 2.3 Silica species in equilibrium with amorphous silica, Diagram
computed from equilibrium constants (25C). The line surrounding the shaded area gives the maximum soluble silica. The mononuclear wall represents the lower concentration limit, below which multinuclear silica species are not stable. In the natural waters the dissolved silica is present as monomeric silicic
acid. 27
Fig. 2.4 Dissolved silica species polymerisation (Q0 < Q1 < Q2 < Q3
aggregation) path into amorphous silica structure (mechanism
proposed by Iler (1976). 28
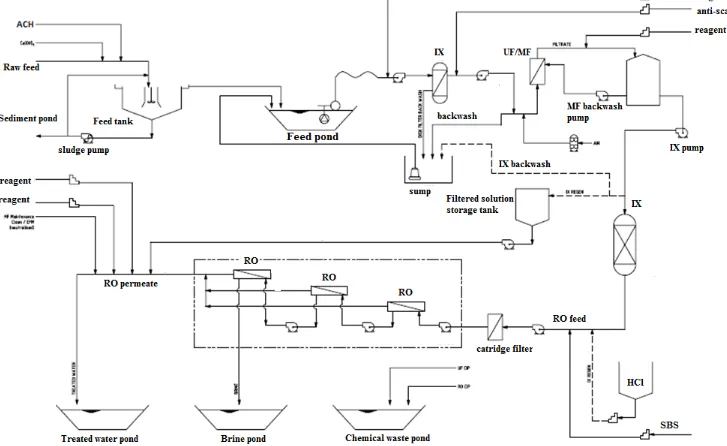
Fig. 2.5 CSG water and gas gathering network and water treatment infrastructure and gas compression station. 39 Fig. 2.6 Indicative CSG water and brine management infrastructure. 41 Fig. 2.7 Process flow diagram of CSG water treatment. 45 Fig. 3.1 RO system – experimental arrangement and main equipment used. 56 Fig. 3.2 RO experimental apparatus at the Victoria University, Melbourne. 58 Fig. 3.3 Synthetic waters with different salinity and silica concentrations
outlined SW1 – TDS=6g/L, SW2-TDS=7.5g/L,
SW3-TDS=12.5g/L, SW4=30g/L and SW5-TDS=60g/L. 60
Fig. 3.4 (a) CSG water sourced from the field, (b) – raw and filtered CSG
waters via 0.45n filter. 62
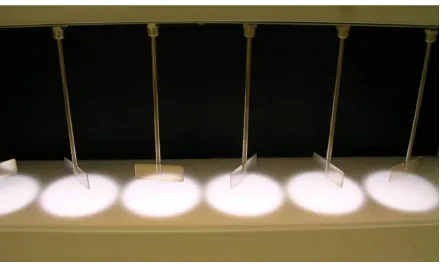
Fig. 3.5 Coagulation experimental equipment (Stuart Scientific): mixers. 68 Fig. 3.6 Coagulation of CSG water (2013) in the flocculator SW1 (Stuart
Scientific) with ACH at doses of 0, 10, 20, 30, 40, and 50 mg/L
after 15 minutes of experiment. 69
Fig. 3.7 Coagulation of CSG water (2013) in the flocculator SW1 (Stuart Scientific) with aluminium sulphate at doses of 0, 10, 20, 30, 40, and 50 mg/L after 10 minutes from the start of experiment. 69 Fig. 3.8 Coagulation of CSG water (2013) in the flocculator SW1 (Stuart
Scientific) with aluminium sulphate at doses of 0, 10, 20, 30, 40, and 50 mg/L after 20 minutes from the starts of experiment. 70 Fig. 3.9 Coagulation of CSG water (2013) in the flocculator SW1 (Stuart
Scientific) with aluminium sulphate at doses of 0, 10, 20, 30, 40, and 50 mg/L after 45 minutes from the starts of experiment. 70 Fig. 3.10 Coagulation of CSG water (2013) by 50 mg/L ACH, 500 mg/L
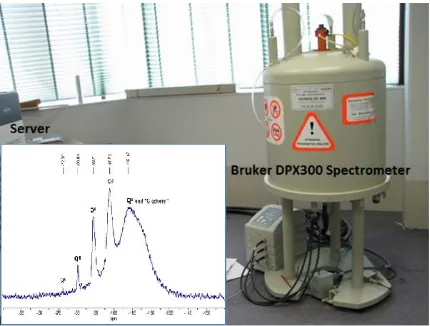
ferric chloride and 45 mg/L ACH at pH 6.5 for silica and DOC removal after 45 minutes from the start of experiment. 71 Fig. 3.11 29Si NMR system includes Bruker DPX300 spectrometer and
server and 29Si NMR spectrum of a sodium silicate solution in D20
with Si/M molar ratio 1.7. 78
xvii
Smolin (1987). Coupling points (-OH groups) may link the silicate
to RO membrane surfaces. 83
Fig. 4.2 29Si NMR spectrum of the initial concentrated sodium silicate
solution (baseline sample) at Si/M molar ratio 1.7. 85 Fig. 4.3 Consolidated results of 29Si NMR spectrum (Q0, Q1, Q2, Q3 type
surroundings) of the samples for the range of diluted silicate solutions with H2O (at Si/M molar ratio 1.7, 1.55, 1.41, 1.31, 1.21,
0.85, 0.68, 0.29, 0.14, 0.11). 87
Fig. 4.4 Consolidated results of 29Si NMR spectrum (Q0, Q1, Q2, Q3 type
surroundings) for a range of diluted silicate solutions with NaCl (1000mg/L) (at Si/M molar ratio 1.7, 1.14, 0.85, 0.68, 0.43). 90 Fig. 4.5 (a) 29Si NMR spectrum of sodium silicate diluted with H
2O at
Si/M molar ratio 1.14 (upper) and 29Si NMR spectrum of sodium
silicate diluted with NaCl (1000mg/L) at Si/M molar ratio 1.14 (lower), 4.5(b)- 29Si NMR spectrum of sodium silicate diluted with H2O at Si/M molar ratio 0.85 (upper) and 29Si NMR spectrum of
sodium silicate diluted with NaCl (1000mg/L) at Si/M molar ratio 0.85(lower), 4.5 (c) - 9Si NMR spectrum of sodium silicate diluted with H2O at Si/M molar ratio 0.67 (upper) and 29Si NMR spectrum
of sodium silicate diluted with NaCl (1000mg/L) at Si/M molar
ratio 0.67(lower). 92
Fig. 4.6 29Si NMR spectrum of sodium silicate diluted with AlCl 3
(130mg/L) at Si/M molar ratio 0.85 (lower); 29Si NMR spectrum
of sodium silicate diluted with NaCl (1000mg/L) at Si/M molar ratio 0.85 (middle); 29Si NMR spectrum of sodium silicate diluted with H2O at Si/M molar ratio 0.85 (upper). 93
Fig. 4.7 The experimental solutions after 24 hours of 29Si NMR experiment: tubes “1” and “2” show the samples diluted with sodium chloride (at the 1.14 and 0.68 Si/M molar ratio respectively). Tube “3” is the sample diluted with deionised water
at the 0.68Si/M molar ratio. 95
Fig. 4.8 Consolidated results of 29Si NMR spectrum (Q0, Q1, Q2, Q3 type
surroundings) of the samples for the range of diluted silicate solutions with AlCl3(130mg/L) (at Si/M molar ratio 0.68, 0.85,
1.14, 1.41, 1.55, 1.61, 1.7). 97
Fig. 4.9 29Si NMR spectrum of baseline sample Si/M molar ratio 1.7 and of
the sample diluted with AlCl3 (130mg/L) at Si/M molar ratio 1.61. 98
Fig. 4.10 The experimental solutions after 48 hours of 29Si NMR experiment: “1” is dilution with aluminium chloride at the 1.61 Si/M molar ratio and “2” is dilution with H2O at the 1.61Si/M
molar ratio. 99
Fig. 4.11 29Si NMR spectrum of the sodium silica solution diluted with H 2O
at 0.5 Si/M molar ratio at adjusted pH9. 100
Fig. 4.12 29Si NMR spectrum of the sodium silica solution diluted with H2O
at 0.5 Si/M molar ratio at adjusted pH10. 101
Fig. 4.13 29Si NMR spectrum of the sodium silica solution diluted with H 2O
at 0.5 Si/M molar ratio at adjusted pH2. 102
xviii
at 0.5 Si/M molar ratio at adjusted pH3. 103
Fig. 4.15 The experimental solution at pH3 at Si/M molar ratio 0.5, “1” is the solution at pH3 immediate after pH adjustment, and “2” is the solution after 24 hours of 29Si NMR experiment, gel was observed
at the bottom of sample 2. 104
Fig. 4.16 Gelling solutions during the preparation of sodium silica solution
at pH5, pH7 and pH8. 105
Fig. 4.17 Dissolved silicate polymerisation in CP layer on the membrane surface in medium and high salinity waters without presence of
aluminium. 106
Fig. 4.18 Polymerised silicate under effect of aluminium and final
deposition on the RO membrane surface. 108
Fig. 5.1 Conceptual diagram of coagulation mechanism of silica (as SiO4)
removal using ACH (Al13+ species) in low (0-8g/L), medium
(12g/L) and high (30g/L) salinity waters. 114
Fig. 5.2 Turbidity removal from groundwater composite samples (CSG water 2013) following coagulation with different doses of ACH, Al2(SO4)3 and FeCl3 pH =8.4 at initial turbidity 81.9NTU. 115
Fig. 5.3 Turbidity removal from the supernatant after sub-samples(groundwater composite) were treated with 35mg/L of ACH (as Al+3), 50 mg/L of Al2(SO4)3 (as Al+3) and 60 mg/L of
FeCl3, ( as Fe3+) respectivily at initial turbidity 81.9 NTU. 119
Fig. 5.4 DOC removal from groundwater composite samples treated at different doses of ACH (as Al+3) at pH6 and pH8.4, Al
2(SO4)3 (as
Al3+) and FeCl3 (as Fe3+) at pH 8.4 for initial DOC=19mg/L. 123
Fig. 5.5 DOC removal from the supernatant after sub-samples(groundwater composite) were treated with 45mg/L of ACH, 50 mg/L of Al2(SO4)3 and 60 mg/L of FeCl3, respectivily at initial
DOC=19mg/L. 122
Fig. 5.6 Metals removal from the supernatant after sub-samples (groundwater composite 2013) were treated at varuous doses
ACH. 123
Fig. 5.7 Dissolved silica removal from the supernatant (groundwater composite CSG water collected in 2013 initial dissolved silica = 16 mg/L) at different doses of ACH, FeCl3, Al2(SO4)3 125
Fig. 5.8 Turbidity removal from dam water composite treated with different doses of ACH, Al2(SO4)3 and FeCl3.at initial turbidity
60mg/L. 127
Fig. 5.9 Total silica (as SiO2) removal from storage dam water treated at
different doses of ACH, Al2(SO4)3 or FeCl3. at initial total silica
concentration 25mg/L. 129
Fig. 5.10 Total (TS) and dissolved (DS) silica removal by ACH, ferric chloride and alum at 45mg/L dose and for various salinity waters at initial total silica concentration 21mg/L and dissolved silica
16.8mg/L 133
Fig. 5.11 Sodium binding layer surrounding silica species and substitution of sodium ions from these binding layers by aluminium (Al13+
xix
Fig. 6.1 Four types of RO silica fouling in the initial range of salinity 12.5g/L (0.4mol/L) to 30g/L to final salinity 59.6g/L (1Mol/L) plotted against silica concentrations vs water recovery. 145 Fig. 6.2 Flux decline trends for low(6g/L), medium(12.5g/L) and
high(30g/L) salinity waters vs water recovery at initial silica concentrations (SiO2=70mg/L) at pH9 condition. (Low salinity RO
runs were 8 – 9.5hours, medium salinity RO runs were 14 – 18 hours, high salinity RO runs were 36 – 42 hours). 147 Fig. 6.3 Dissolved silica (as SiO2) concentrations (RO residual silica
concentrations in the recycled stream) vs water recovery - maximum and stable residual silica concentrations recorded in medium salinity (NaCl=12.5g/L) synthetic waters with initial
silica concentration 70mg/L at pH9. 149
Fig. 6.4 Stable residual silica (as SiO2) concentrations at pH 8.5-9 (sodium
chloride concentration for synthetic water 1 - NaCl=59.6g/L, synthetic water 2 – NaCl=29.5g/L, synthetic water 3 – NaCl=17.5g/L) and the Hamrouni et al (2001) silica solubility
plotted against salt concentration. 151
Fig. 6.5 Dissolved silica concentration vs water recovery in deionised water for an initial silica concentration of 84mg/L at pH3, pH9 and
pH11 (Figure 6.6). 153
Fig. 6.6 Flux decline trends vs water recovery in deionised water at an initial silica concentration 84mg/L at pH3, pH9 and pH11 (Figure
6.5). 154
Fig. 6.7 (a) Silica scale deposit on the RO membrane surface at initial concentration SiO2=84mg/L diluted in deionised water, pH9 and
(b) EDS membrane surface elemental analysis. 155 Fig. 6.8 Silica fouling trends in synthetic water at pH3, pH9 and pH11 vs
water recovery in low salinity feed (NaCl=6g/L). Initial RO feed
dissolved silica concentration = 50mg/L. 156
Fig. 6.9 Silica fouling trends in synthetic water at pH3, pH9 and pH11 vs water recovery in medium salinity feed (NaCl=12.5g/L). Initial RO feed dissolved silica concentration = 50mg/L. 157 Fig. 6.10 Silica fouling trends in synthetic water at pH3, pH9 and pH11 vs
water recovery in high salinity feed (NaCl=30g/L). Initial RO feed
dissolved silica concentration = 50mg/L. 157
Fig. 6.11 Effect of salinity on stable residual silica concentrations plotted against silica solubility by Hamrouni (2001) in synthetic waters at
pH 8-9. 159
Fig. 6.12 Effect of salinity on maximum residual silica concentrations plotted against silica solubility by Hamrouni (2001) in synthetic
waters at pH8-9. 160
Fig. 6.13 Stable residual silica concentrations for medium, high salinity synthetic waters at pH3 and silica solubility at pH3 (Gorrepati
(2010)) vs salinity. 160
xx
Fig. 6.15 Effect of pH on maximum silica solubility in medium and high
salinity synthetic waters. 162
Fig. 6.16 Membrane surface EDS examination (a) low salinity synthetic water SiO2=50mg/L at pH9, (b) medium salinity synthetic water
SiO2=50mg/L at pH9, (c) high salinity synthetic water
SiO2=50mg/L at RO feed at pH9, (d) EDS elemental analysis of
the membrane surface (high salinity). 164
Fig. 6.17 (a), (b) SEM images of the RO membrane surface at 76% water recovery in medium salinity CSG water with an initial silica concentration (as SiO2) of 50mg/L and aluminium concentration
(as Al+3) of 27.5mg/L at pH9 (c) SEM image of the RO membrane surface at different magnification and (d) EDS elemental mapping
of the RO membrane surface. 166
Fig. 6.18 Silica fouling and turbidity results measured in the recycle stream in medium salinity (12.5g/L) CSG water, initial silica concentration SiO2=70mg/L at pH9 vs water recovery. 167
Fig. 6.19 Silica fouling and turbidity results measured in the recycled stream in medium salinity (12.5g/L) CSG water, initial silica concentration SiO2=50mg/L at pH3 vs water recovery. 167
Fig. 6.20 Silica fouling trends in CSG water at pH3, pH9 and pH11 vs water recovery in low salinity (NaCl=6g/L) RO feed and dissolved silica
concentration 50mg/L. 168
Fig. 6.21 Silica fouling trends in CSG water at pH3, pH9 and pH11 vs water recovery in medium salinity (NaCl=12.5g/L) RO feed and
dissolved silica concentration 50mg/L. 168
Fig. 6.22 Silica fouling trends in CSG water at pH3, pH9 and pH11 vs water recovery in high salinity (NaCl=30g/L) RO feed and dissolved
silica concentration 50mg/L. 169
Fig. 6.23 Effect of salinity on stable residual silica concentrations in CSG
waters. 170
Fig. 6.24 Effect of salinity on maximum residual silica concentration in
CSG waters. 171
Fig. 6.25 Effect of pH on stable solubility in medium and high salinity CSG
waters. 172
Fig. 6.26 Effect of pH on maximum solubility in low, medium and high
salinity CSG waters 172
Fig. 6.27 Membrane surface of RO experiment with CSG water spiked with sodium chloride (30g/L) and silica (50mg/L) at pH9.2 - SEM (7000 x magnification) and EDS elemental analysis of the
membrane surface. 174
Fig. 6.28 Flux decline and turbidity results at silica concentration SiO2=40mg/L, medium salinity (12.5g/L) CSG water and
Al=27.7mg/L at pH9. 176
Fig. 6.29 Aluminosilicate scale deposition on the RO membrane surface at 55% water recovery in medium salinity CSG with an initial silica concentration (as SiO2) of 80mg/L and aluminium concentration
(as Al+3) of 27.7mg/L at pH9. (Blue is silicate, Green is
xxi
Fig. 6.30 Aluminium-silicate fouling at silica concentration SiO2=40mg/L,
80mg/L and 120mg/L in medium salinity (12.5g/L) CSG water
and Al=27.7mg/L at pH9. 178
Fig. 6.31 Aluminium-silicate fouling at silica concentration SiO2=40mg/L,
80mg/L and 120mg/L in medium salinity (12.5g/L) synthetic
water and Al=27.3mg/L at pH9. 178
Fig. 6.32 SEM images and EDS elemental mapping of the RO membrane surface at 76% water recovery in medium salinity CSG water with an initial silica concentration (as SiO2) of 50mg/L and aluminium
concentration (as Al+3) of 27.5mg/L at pH9. 180
Fig. 6.33 Maximum and stable residual silica concentrations at initial RO silica concentrations 50 - 70mg/L and silica solubility by
xxii
List of common abbreviation
American Water Work Association AWWA
Derjaguim-Landau-Verwey-Overbeek DLVO
Coal seam gas CSG
Concentration polarisation CP
Reverse osmosis RO
Ultra-filtration UF
Micro-filtration MF
Mechanical vapour compressor (brine concentrator) MVC
Brine concentrator (vertical or horizontal) BC
Silicon-29 nuclear magnetic resonance 29Si NMR
Scanning Electron Microscopy SEM
Energy Dispersive Spectroscopy EDS
Electrical conductivity EC
Inductively Coupled Plasma ICP
Total dissolved solids TDS
Dissolved organic carbon DOC
Department of Environmental Resource Management DERM
Environmental Protection Authority EPA
Environmental Protection Act 1971 EPA 1971
Powder activated carbon PAC
Multi-effect distillation MED
Mechanical vapour compressor MVC
xxiii
Aluminium chlorohydrate ACH
High HDPE
Magic-angle-spinning MAS
Tetramethylsilane TMS
Second electrons SE
Backscattered electrons BE
Chapter 1 Introduction
1.1 Background
Silica removal processes are critical in desalination of coal seam gas (CSG) water by reverse osmosis (RO) technology as silica can deposit on the membrane surface of RO systems. As a result of silica deposition, the quantity and quality of portable water produced by RO system will be reduced. Deposition of silica also reduces the lifetime of RO membranes. The silica scaling compounds, (amorphous silica and/or metal silicates) can form in the bulk solution, leading to the formation of colloidal silica which can later foul the membrane during the filtration process. These scaling compounds can also form directly on the membrane from soluble silica species during filtration (Sanciolo and Gray 2014, Ning 2005). One of the main complicating elements is the effect of various cations and anions, and in particular aluminium ions, in the water on silica polymerisation and scale formation. The use of anti-scalants is seldom effective for silica scale mitigation as most anti-scalants target the crystallised deposition on the membrane surface and are not affective for amorphous silica deposition (Gabelich 2005, Semiat 2003). Adding a commercial antiscalants does not improve the ability to control for aluminium silicate fouling, and also can be a contributing factor in aluminium-based scalant formation.
Removal of colloidal silica from RO feedwater is typically accomplished by coagulation, assuming that the coagulation is optimised for no elevated concentrations of aluminium residual present in the RO feed (Healy 1994). The aluminium residual may interact with ambient silica within the membrane system to cause unexpected fouling with aluminium silicates.
2
Australia produces million gallons of CSG water with medium to high silica concentrations. The management of CSG water is a key effective business operation for all CSG operators in Queensland. RO desalination is frequently necessary to manage the purified water in a sustainable manner.
To reduce fouling in RO membranes the feed water is pre-treated for removal of foulants. This removal process is almost always preceded by coagulation which is designed to destabilize the particles and change the particle size distribution. The degree of destabilization and the size distribution are the principal determinants of removal efficiency. Within coagulation, particle destabilization is typically accomplished through the addition of chemicals that change the surface chemistry and aid particle attachment. The particle size distribution is then changed by providing gentle mixing to keep particles in suspension and promote particle-particle collisions, or flocculation. Silica has “anomalous behaviour” mechanisms during coagulation, which has not been very well understood.
The removal of colloidal silica from the feedwater, however, does not prevent silica scale formation from the remaining soluble silica species, which may be present in relatively small quantities in the feedwater, but which can exceed the solubility limit of the silica-scaling compound(s) in the concentrate stream of the RO at high water recovery. The solubility limit of the scaling compounds is difficult to reliably predict as it depends on the combined effect of solution conditions such as pH, salinity and the presence of multivalent cations (Semiat 2001, Demakis 2006).
3
1.2 Problem statement
Desalination of CSG waters has become increasingly important because of their potential for beneficial use as a recycled water resource and for aquifer recharge. Desalination technologies, both thermal and non-thermal, require pre-treatment to prevent fouling and to enhance the proportion of water recovered. For source water of poor quality such as CSG water, pre-treatment processes can form a significant proportion of the water treatment plant. The selection of a suitable desalination technique depends primarily on a combination of influent salinity level and silica content, and the output water quality required.
Silica scale formation on the membrane surface during RO desalination has been problematic for CSG and some mining industries in Australia. Demand for reduction of concentrated RO waste stream (brine) and higher production of purified water puts even more pressure on the industry to investigate sustainable ways to increase productivity of RO systems. The silica fouling mechanism in the case of RO systems is not well understood due to silica solubility limit variations in different water matrices and pre-treatment applied to RO feed prior to RO processing. The threshold limits for silica deposition are rather uncertain, and the complex silica hydrolysis and condensation (polymerisation) processes are not well understood. Comparisons of predictions from currently available silica solubility data and experimental research and operation of RO treatment plants reveals that the current data are inadequate to explain silica precipitation for some waters with relatively low silica concentrations. Although mitigation of silica precipitation is attempted, most techniques are ineffective or lead to even higher silica scale formation on the RO membrane surface (Semiat 1996, 20012, 2003, Demakis 2003). Presently, there is no reliable way to predict silica scale formation.
4
1.3 Significance
The role of RO technology in desalination of CSG water and other mining waters is changing dramatically. Tightened requirements for increased efficiency, high permeate recovery; reduction of energy consumption, reduction of chemicals for membrane cleaning, and reduction of unit cost of purified water have led to increased emphasis on silica scale mitigation.
Optimisation of the RO pre-treatment processes for prevention of RO silica fouling remains a key design consideration. Currently the pre-treatment processes for CSG water account for 70% of RO plant, because of the need for 92 – 94% water recovery. The pre-treatment process frequently consists of coagulation, clarification, filtration, microfiltration, ultra-filtration and ion-exchange for micro-particle removal and reduction of cations and anions acting as nucleation sites for further fouling. The pre-treatment process requires optimisation to reduce cost and at the same time improve water recovery by RO. Prevention of silica polymerisation and better understanding of silica polymerisation and silica scale formation can lead to development of an operational management strategy to prevent silica fouling. In light of these changes, an improved coagulation regime should result in improved design and operation not only of coagulation facilities but of these downstream processes. Improved understanding of silica polymerisation within the RO system will provide a potential optimisation of the current expensive pre-treatment process, and a significant reduction of chemicals used in the RO plants.
1.4 Objectives
5
I. Develop a conceptual silica polymerisation model using 29Si NMR data and
silica solubility results to explain silica polymerisation on RO membrane surfaces.
II. Review potential silica removal efficiency of coagulation and the influence of salinity on silica removal by a range of coagulants;
III. Identify CSG water components and coagulation residuals that influence silica solubility, and in particular lowering of silica solubility, using synthetic and field CSG waters;
IV. Develop relationships between pH, silica concentration, and silica species present for the polymerisation of silica (silica scale formation).
1.5 Approach
The stated objectives were achieved by undertaking (I) studying dissolved silica species using 29Si NMR spectroscopy (described in chapter 4 of this research), (II) removal of
6
Furthermore, the silica polymerisation mechanism was studied by 29Si NMR
spectroscopy for a range of silica concentrations. The objective of the 29Si NMR
experimental work was to develop a method to study five dissolved silica species identified in sodium silicate solutions and then develop this method to investigate effect of pH, sodium chloride and aluminium concentrations on these dissolved silica species. The effects on these silica species were evaluated through the collection of 29Si NMR
spectrum across the studied solutions and peak area of each silica species present. Concentration polarization leads to high local silica concentrations near the membrane surface to condensation of some silica species. The relative proportion of oligomeric silica decreases as the oligomers associated and form sol particles as a result of silica polymerization (formation of amorphous silica) on the membrane surface. For supersaturated conditions, the nucleation process will in principle be governed by interacting silanol groups that polymerise via Si-O-Si bonds (Iler 1976). Under these conditions, the probability of interactions between neighboring silanol groups to form Si-O-Si bonds is high, and therefore intramolecular nucleation is favored (Dietzel 1998). During silica precipitation the monomer group, [SiO6]4-, rapidly polymerise by
random packing of [SiO4]4- units, which results in non-periodic structures and the
formation of amorphous silica or silicate in the presence of different cations (Dietzel 1993). To date, 29Si NMR has not been used to investigate the impact of sodium and aluminum ions, and pH conditions on dissolved silica species and applied it to RO silica fouling mechanisms because it is problematic to obtain silicon spectra at the silica concentrations and pH values where RO fouling occurs (typically up to ~120 ppm SiO2,
pH less than 9). To overcome this limitation, commercial sodium silicate solutions were used to identify trends what might be happening at lower concentrations described in details in chapter 4.
7
8
Chapter 2 Literature review
2.1 RO system
2.1.1 Overview
As outlined in chapter 1, the aim of the present work is to prevent silica scale formation on RO membrane surfaces in desalination of CSG water. This study focuses on first reduction of silica in CSG water by coagulation prior to RO processing. Then silica fouling was studied in different water matrices to understand silica precipitation patterns. During multiple RO experiments various residual silica concentrations in the recycled stream were recorded to analyse silica solubility limits and the phenomena of silica precipitation to identify various pseudo - solubility residual concentrations. In parallel dissolved silica species were studied by 29Si NMR spectroscopy.
The literature review follows a general overview of RO desalination technology, reviews a number of physical – chemical models explaining super-saturation conditions on RO surface, then membrane fouling is discussed in greater detail followed by the chemistry of silica with emphasis on silica precipitation, dissolved silica species and silicate scale formation. The literature briefly discussed the properties of CSG water in Australia as silica precipitation has frequently occurred on the membrane surface.
2.1.2 RO technology
RO is considered the most cost effective technique for purification of medium (6 – 8g/L) and relatively high (20 – 30g/L) salinity waters compare to other desalination technologies (Cohen 2007, Sheikholeslami 2002). Along with a remarkable development of the technology, however, there is increasing concern over membrane fouling and silica scale deposition (Baoxia 2013, Brant 2012, Barger 1991). Membrane fouling significantly reduces productivity of the RO technology and increases the unit cost of purified water.
9
system. One of the main difficulties when operating at high recovery, however, is the greater possibility of colloidal fouling and silica scale formation as silica concentration is increased (Brant 2012, El-Manharawy 2000, Parekh 1988). While much research effort has been undertaken is to gain a better understanding of silica scaling mechanisms, silica scaling remains a major unsolved problem facing membrane desalination (Sanciolo and Gray 2014, Semiat 2001, Rautenbach 1989). Operating near the silica solubility limit leads also to scaling (Coronell 2006, Demadis 2005). Besides fouling and scaling there are other causes of flux decline in membrane processes, including both membrane ageing and degradation of the membrane material (Brant 2012, Semiat 1996). Recent research suggests that the chemical and physical properties of the membrane materials may be the primary controlling parameters for membrane fouling in all membrane separations (Cob 2012, Wood 2011).
10
designed to operate for 10 or 11 months per year to allow time for them to stop for seasonal maintenance, because of the scale accumulation on the internal walls, which increases proportional energy consumption in the system. Silica scale formation is a significant and complex problem in these thermal systems (Braun 2012, Demadis 2005, 2009), which seems has been inherited by modern RO technology.
The growing popularity of RO in many municipal and industrial applications significantly increased design throughputs, RO systems become environmentally unsustainable, especially in inland applications, mainly because of the need to discharge RO concentrate in relatively high volume (Malaeb 2010, Katarachi 2005). Cumulative impact on local ecosystems of an RO plant (assuming concentrate discharges to evaporation and crystallisation ponds) over its life cycle could be quite significant. Buhrs (1993) and Moroni (2004) characterise these environmental problems as highly complex (ie, they are ‘science intensive’), comprehensive (having ecological and economic dimensions). In such circumstances (characterised by a high degree of uncertainty and disagreement) it is difficult, if not impossible, to formulate ‘good’ environmental policy and good practice. Not surprisingly, perhaps, CSG water and brine management policies, in Queensland, have continued to be developed without adequate consideration being given to environmental implication (Steven 2013, Anderson 2010).
2.1.3 RO process
RO is a physical-chemical separation process in which only water molecules pass through a semi-permeable membrane. Salt ions are rejected, i.e., they do not pass through the membrane. By applying pressure in excess of the osmotic pressure in RO, water (acting as a solvent) is forced from a region of high solute concentration through a membrane to a region of relatively lower solute concentration.
The osmotic pressure, Posm, of a solution can be determined experimentally by
11
where Posm = osmotic pressure (in psi), T is the temperature (°C), and Σ(mi) is the sum
of the molar concentrations of all constituents in the solution. An approximation for Posm may be obtained by assuming that 1,000 mg/L of total dissolved solids (TDS)
yields about 10 psi (0.72 bar) of osmotic pressure.
It is believed that the mechanism of water and salt separation by RO is not fully understood (Cob 2012, Semiat 1996). The theory suggests that the chemical nature of the membrane is such that it will absorb and pass water preferentially to dissolved salts at the solid/liquid interface. This may arise from weak chemical bonding between the water and the membrane surface, or by dissolution of water within the membrane structure (Cohen 2006, Barger 1991). Either way, a salt concentration gradient is formed across the solid/liquid interface leading sometime to membrane fouling (Brant 2013, Cob 2012).
It has been said that various diagnostic models for membrane fouling have not yet proven successful to predict this phenomena (Semiat, 1997, Gill 1993). Uncertainties regarding membrane fouling arises from different pre-treatments processes, water matrix or water composition and permeate recovery targets in each RO system (Brant 2012, Cohen 2006, Barger 1991). Most research in this area comes from pilot plants and bench scale studies performed with various natural water qualities. Natural waters which serve as feeds to RO systems are obviously complex chemical systems consisting of many soluble constituents as well as suspended colloidal, chemical and biological species (Coronell 2006, Barger 1991). Some believe that geochemical modelling of the feedwater's chemical composition needs to be done to accurately predict the fouling potential (Demadis 2007, Rowe 1973). No model so far has been developed to explain silica fouling and silica scale deposition on the membrane surface. Nevertheless, a number of models were developed to explain some set of conditions which potentially could explain silica scale deposition.
2.2 Membrane fouling
12
the following: “fouling is a condition in which a membrane undergoes plugging or coating by some element in the stream being treated, in such a way its output or flux is
reduced and in such as way the foulant is not in dynamic equilibrium with the stream
being ultra-filtrated”. According to Brant (2012) there are four different categories of membrane fouling, including (1) inorganic, (2) organic, (3) biological, and (4) colloidal fouling. Fouling occurs when rejected, dispersed or dissolved solids are not transported from the membrane surface back into the bulk solution. This accumulation of solid or dispersed layer on the membrane surface reduce the permeate flux through the membrane by providing an additional hydraulic resistance to mass transport. This solid or suspended layer can block membrane material, creates concentration polarisation (CP), provides a favourable environment for aggregation of varieties of colloidal matters, and eventually cake formation and growth as well as a gel layer on the membrane surface occurs (Brant 2012, Safari and Phipps 2005).
Substantial effort in current RO science has focused on investigating fouling mechanisms in order to mitigate the many negative consequences of fouling through careful membrane material selection, system design, and process operation. This improved understanding has resulted in dramatic improvements in membrane materials, new pre-treatment processes, modification of RO stages into more flexible arrangements, and improved selection of cleaning agents (ASTM 1989). Nevertheless, fouling may occur as a result of many factors, sometimes an unpredictable combination of RO feed and operating conditions (ASTM 1989). Fouling generally depends on the following most significant factors:
- Feed water quality and composition - Salinity (TDS)
- Physical and chemical characteristics of the membranes and foulants - Operation pressure
- Membrane process design and operation - Membrane configuration.
13
(Brant 2012, Semiat 2003, Safari and Phipps 2005). Understandably, then more complex the source water, the more challenging RO desalination is likely to be. The chemistry and composition of colloidal structures of the feed water determine the fouling mechanism that will be expected. Therefore, there are numerous interaction pathways in complex solutions, such as CSG water, that influence each other. In particular particle size distribution, organic content, RO configuration, particle hydrophobicity and charge can influence the formation of complex membrane foulants. Currently there is no reliable physical chemical model which could predict the nature of membrane fouling (namely foulant-foulant interactions) (Cob 2012, Brant 2012).
14
metal hydroxide particles are generally stable with regard to aggregation. Stabilization of any colloidal particle results in its behaviour being controlled by its surface charge density (Coronell 2006). The stabilized particles remain small and independent as they are carried by the flow to the membrane surface and can easily nucleate at active sites there. Metal hydroxide particles are generally attached to the membrane surface by van der Waal's forces, the mechanical forces delivered by the water flux push them onto the membrane surface. After sufficient colloids have attached to the surface, growth via polymerization begins (Healy 1994). Once attached, the stable metal (or other hydrolyzable ion) colloidal particle can form many polymeric hydroxide bridges to other similar particles. Ultimately, a flocculated solid phase builds up with some of the particles attached to the membrane. These attached flocs cause serious loss of permeate flux and, effectively, permanent retention of the metal species on the membrane. As discussed above, a number of other physical and chemical factors such as system hydraulics, pressure, CP and colloidal silica present in the solution can affect membrane fouling.
2.2.1 Colloidal fouling
15
Silica is of primary concern for colloidal matter in natural CSG water in Australia (DERM 2010, Stevenson 2013). Silica is usually represented as (SiO2)n, to represent the
different crystalline and amorphous forms in which this compound may exist (Ning and Troyer 2007). Colloidal silica results from the polymerisation of silica containing particles and as a result of elevated silica concentrations. In the presence of carbonic acid (H2CO3), silica has two acid-base characters that affect the characteristics of the
silica and its membrane interaction (Brant 2012). Some other factors that influence the solubility and form of silica in solution include pH, ionic strength, ionic composition, and temperature (Hamrouni and Dhahbi 2001).
16 2.2.2 Organic fouling
Organic fouling seems to occur through a variety of mechanisms, including adsorption, attachment, pore blockage, and cake or gel layer formation. As discussed previously, organic fouling depends upon the characteristics of the organic matter (composition, size, hydrophobicity, and charge), the membrane characteristics, the water chemistry, and the hydrodynamics of the membrane system. Problem arises when the membrane surface adsorbs organic matter and the membrane surface is altered, normally becoming more attractive for other organic compounds, cations and anions to deposit. According to Darton and Fazel (2001) organic fouling occurs prior to any other type of fouling because NOM, organic macromolecules, organic colloids, biopolymers are always present in the RO feed in minor quantity depositing on the membrane surface. Organic fouling remains a significant problem for groundwater RO desalination plants including CSG water. Mallevialle (1989) and Brant (2012) highlight the ability of organics to interact with other materials to enhance membrane fouling adds to the complexity of this problem. Silica, and particularly colloidal silica, deposit easily on the surface of organic materials creating colloidal aggregates (Ning 2010). For instance, humic acid represents almost 50% of dissolved organic carbon in CSG water. Residual humic acid following coagulation can pass through clarification and microfiltration treatment and deposit on the RO membrane surface creating a favourable environment for silica deposition and other inorganic matter.
2.2.3 Inorganic fouling and silica solubility
17
Table 2.1 – Silica solubility vs pH values
pH Solubility of SiO2 (mg/L)
6 to 8 120
9 138
9.5 180
10 310
10.5 876
However, silica solubility limits could vary generally from 120mg/L to 140mg/L as a result of water chemistry, as recorded in different research (Ning 2010, Semiat 1999, 2000). Pseudo-solubility silica limits at residual silica concentrations 200 – 240 mg/L were also observed by a number of authors probably due to a rapid increase in silica concentrations and slow kinetics (Bartman 2010, Baes 1976).
Solubility of silica can be characterised by the following equilibria at 25˚C (AWWA 2010). Monosilicic acid has been written as H2SiO2(OH)2, rather than Si(OH)4 or
H4SiO4 in order to emphasize its diabasic character, and the tendency of silicon, like
other metalloids, to coordinate with hydro and oxo-ligands (Stumm and Morgan 1976).
(1) Quartz + 2H2O H2SiO2(OH)2 Log K = -3.7
(2) Amorphous silica + 2H2OH2SiO2(OH)2- Log K = -2.7
(3) H2SiO2(OH)2HSiO2(OH)2- + H+ Log K = -9.46
(4) HSiO2(OH)2- SiO2 (OH)
18
amorphous silica represents the upper limit of dissolved silica concentration in natural waters.
The solubility of aqueous silica depends on monomer silica concentrations, pH, salinity (cations and anions present) in the solution, pressure and temperature (Hamroni and Dhahbi 2001). Analytical aspects of silica solubility limits in saline waters have been investigated by Hamroni and Dhahbi (2003, 2001), who point out that the efficiency of the RO desalination process was limited by the solubility of silica.
The code and practice developed by AWWA (2001) for the RO industry in the US, table 2.2, recommends that if a silica scaling potential exists, aluminium and iron must be removed by 1m cartridge filtration if possible. Since the solubility of silica increases below a pH of approximately 7.0 and above a pH of about 7.8, the actual solubility of SiO2 in a concentrated stream can be affected by the pH of that stream.
Thus the silica solubility can be obtained by multiplying the pH7 SiO2 solubility at the
specific temperature by the pH correction factor to give the corrected solubility (SiO2cor) (AWWA, 2001). A comparison of the silica solubility (SiO2cor) of the RO
system with the pH corrected silica solubility (SiO2c) (AWWA 2001) can be made. If
SiO2c is greater than SiO2cor silica scaling can occur and adjustment is required.
Because silica chemistry is quite complex, this practical way is currently adopted by the RO membrane industry (AWWA 2001).
Table 2.2 - Silica solubility vs temperature
Temperature (C) Solubility of SiO2 (mg/L)
5 85
10 96
15 106
20 118
25 128
30 138
19
While an extensive body of data exists describing the dependence of SiO2 solubility on
temperature, the effect of pressure on the solubility of silica has never been measured. It is a widely held view, mostly from past research in the geothermal field, that pressure has little effect on the solubilities of amorphous silica below about 300 degree (Fourier 1988). Contrary to this proposition, a recent report from marine research claims that the solubility of the silica decreases by about 10% after each ~200 bar of increase of pressure (Mauni, 2014).
Aluminium and iron oxides are a commonly encountered inorganic colloidal foulants, as evidenced by their frequent appearance in membrane autopsies (Nghiem and Schafer, 2006). Other metal oxides, such as those of aluminium and manganese, are also a source of fouling in membrane systems. Dissolved manganese may be present in anoxic brackish groundwater sources, whereas aluminium is encountered in systems using aluminium salts as a coagulant. Both of these types of metal oxides are encountered as a membrane foulants far less frequently than iron (Brant 2012, Healy 1994). Iron fouling can occur when the soluble form of iron (Fe2+) is oxidised to insoluble forms allowing precipitation out of solution onto a membrane surface (Kenneth 1987). The solubility of iron (III) is governed by the solubility of Fe(OH)3, which is less than 0.1mg/L in
freshwater over a pH range of approximate 5 - 9. The solubility of iron (III) is higher in more-saline waters as a result of ionic effects. It is, therefore, critical that dissolved metals like iron, aluminium and manganese be removed before reaching RO membranes, as these materials may foul and perhaps oxidize or catalyse the oxidation of the membrane material (Brant 2012, Sheikholeslami and Lee 2002).
2.2.4 Concentration polarisation (CP)
20
thickness of the CP boundary layer should result in an increase in the mass transfer coefficient for a membrane system. Because CP is a function of the system hydrodynamics, it can be reduced by controlling the flow (Cohen 2007, 2003). One way to reduce CP is to keep the horizontal feed flow turbulent. It appears increased cross flow reduces the thickness of the laminar boundary layer, thereby increasing the relative amount of back diffusion of solute to the feed stream.
Yet, the effect of CP resulting from specific water matrices is better to obtain empirically by monitoring RO performance (Sheikholeslami and Lee 2001). Complex physical chemical processes arise in the CP zone that can significantly depress the silica solubility limit and as a result increase silica scale deposition on the membrane surface.
Increased concentration of a solute next to the membrane surface can have several effects such as reduction of permeate water quality, and silica and/or salt precipitation on the membrane surface (Gabelich 1993, Brant 2012). According to theory, CP increases from the value of the bulk stream at the edge of the boundary to an elevated concentration next to the membrane surface. Furthermore, CP is function of many variables including water quality, hydrodynamics, diffusivity of the solute, and the thickness of boundary layer. CP seems to be an important cause of membrane fouling, especially for high flux RO systems (AWWA 2001, ASTM 1989).
21 2.2.5 Chemical precipitation
Formation of a cake layer on the membrane surface will depend on the physiochemical properties of the solution and physiochemical property of specific foulant such as silica. However, the rate of growth of the cake layer depends on many variables in this system, including the super saturation conditions, hydrodynamics of the flow, and pH conditions (AWWA 2001, Brant 2012). In the case of silica deposition, two major factors affect the rate of deposition: silica super-saturation and pH (Ning and Lee 2010, 2008). Frequently, to mitigate precipitation of one particular foulant creates favourable conditions for precipitation of other foulants – this is true when various anti-scalants are added to the RO feeds (Demakis 2001, 2005). Nucleation was found to be a function of the product water flux, particles size, and the number of nucleation sites available for polymerised silica to deposit (Cob 2010, Ning and Lee 2010). For instance at pH values away from the isoelectric point, colloidal aluminium particles stabilised and their aggregation behaviour was controlled by their surface charge (Barger 1991). These particles can easily nucleate on membrane surfaces providing a favourable environment for silica to precipitate as aluminium-silicate.
Chemical precipitation can be sometimes be avoided by selecting the right pH condition that silica for instance, remains in solution at relatively high concentrations (Sanciolo 2014, Gray 2006, Semiat 1996). For instance, very high pH conditions (pH10 to pH11) frequently help to mitigate chemical precipitation. However, these pH conditions are not always practical and acceptable for large commercial RO systems.
2.2.6 Fouling models