Scholarship@Western
Scholarship@Western
Electronic Thesis and Dissertation Repository
7-19-2012 12:00 AM
The effect of concurrent cognitive, linguistic and motor tasks on
The effect of concurrent cognitive, linguistic and motor tasks on
speech intensity in Parkinson’s disease
speech intensity in Parkinson’s disease
Teresa J. Valenzano
The University of Western Ontario
Supervisor Scott G. Adams
The University of Western Ontario
Graduate Program in Health and Rehabilitation Sciences
A thesis submitted in partial fulfillment of the requirements for the degree in Master of Science © Teresa J. Valenzano 2012
Follow this and additional works at: https://ir.lib.uwo.ca/etd
Part of the Speech and Hearing Science Commons
Recommended Citation Recommended Citation
Valenzano, Teresa J., "The effect of concurrent cognitive, linguistic and motor tasks on speech intensity in Parkinson’s disease" (2012). Electronic Thesis and Dissertation Repository. 670.
https://ir.lib.uwo.ca/etd/670
This Dissertation/Thesis is brought to you for free and open access by Scholarship@Western. It has been accepted for inclusion in Electronic Thesis and Dissertation Repository by an authorized administrator of
(Spine title: Concurrent Task Effects on Speech Intensity in PD)
(Thesis format: Monograph)
by
Teresa Valenzano
Graduate Program in Health and Rehabilitation Sciences
A thesis submitted in partial fulfillment of the requirements for the degree of
Master of Science
The School of Graduate and Postdoctoral Studies The University of Western Ontario
London, Ontario, Canada
ii
THE UNIVERSITY OF WESTERN ONTARIO School of Graduate and Postdoctoral Studies
Supervisor
______________________________ Dr. Scott G. Adams
Supervisory Committee
______________________________ Dr. Allyson Dykstra
______________________________ Dr. Mandar Jog
Examiners
______________________________ Dr. Allyson Dykstra
______________________________ Dr. Mary Jenkins
______________________________ Dr. Marilyn Kertoy
______________________________ Dr. Jeff Holmes (Chair)
The thesis by
entitled:
speech intensity in Parkinson’s disease
is accepted in partial fulfillment of the requirements for the degree of
Master of Science
______________________ _______________________________
iii
Abstract
This study investigated the effect of concurrent tasks on speech intensity in Parkinson’s
disease (PD). Thirteen PD participants and twenty-two controls performed three tasks
concurrent with a speech task. The speech task involved a repeated carrier phrase and a target
word. The concurrent tasks involved math addition (cognitive), verb generation (linguistic),
and manual visuomotor tracking (motor) at three levels of difficulty. All three concurrent
tasks were associated with reduced speech intensity relative to the isolated speech task. The
concurrent motor task was generally associated with the greatest reduction in speech
intensity. Task performance measures were not significantly different for the concurrent and
isolated tasks. PD participants demonstrated relatively worse performance on the linguistic
task. The results of this study failed to support the energizing hypothesis. Instead, the results
appear to support a cognitive/attention resource allocation hypothesis with regard to the
effect of concurrent tasks on speech intensity regulation in PD.
iv
Acknowledgments
Greatest appreciation and thanks for Dr. Scott Adams for his support and guidance
throughout the completion of this project. His contributions were invaluable and ensured this
project reached its highest potential. Many thanks are extended to Dr. Allyson Dykstra and
Dr. Mandar Jog for their encouragement and work on this project. As well, much gratitude is
given to Angela South for her direction and immeasurable wisdom that have helped guide
this project from start to finish.
I would also like to thank my parents and siblings for their unconditional support and faith
which has allowed me to work towards this academic accomplishment and achieve all that I
could hope. My closest friends and confidantes, Kassandra Birtch and Linh Nguyen, deserve
many thanks for sharing in my excitement and keeping me motivated every step of the way.
I cannot give enough thanks to my family and friends who have encouraged me throughout
this journey.
Finally, I would like to mention the groups that financially backed this project to ensure its
success. I would like to recognize the Ontario Graduate Scholarship and the University of
v
Table of Contents
CERTIFICATE OF EXAMINATION ... ii
Abstract ... iii
Acknowledgments... iv
Table of Contents ... v
List of Tables ... viii
List of Figures ... xiii
List of Appendices ... xvii
Chapter 1 ... 1
1 Introduction ... 1
1.1 Motor Symptoms in Parkinson’s Disease ... 1
1.2 Hypokinetic Dysarthria in Parkinson’s Disease ... 2
1.3 Hypophonia in Parkinson’s Disease ... 3
1.4 Cognitive Dysfunction in Parkinson’s Disease... 4
1.5 Speech and Concurrent Task Research ... 9
1.6 Task Development ... 11
1.7 Objectives and Hypotheses ... 14
Chapter 2 ... 16
2 Methods ... 16
2.1 Participants with Parkinson’s Disease ... 16
2.2 Control Participants ... 17
2.3 Apparatus ... 18
2.4 Procedure ... 19
2.4.1 Experimental Conditions ... 19
vi
2.5.1 Primary Measures ... 22
2.5.2 Secondary Measures ... 22
2.6 Analyses ... 25
2.6.1 Objectives 1, 2 & 3 – Effect of Task Condition on Speech Intensity for Control Participants and Participants with Parkinson’s disease ... 25
2.6.2 Objectives 4 & 5: Effect of Task Condition and Task Type on Performance for Control Participants and Participants with Parkinson’s disease ... 26
Chapter 3 ... 29
3 Results ... 29
3.1 Speech Intensity Results ... 29
3.1.1 Carrier Phrase Intensity... 29
3.1.2 Target Word Intensity ... 35
3.1.3 Overall Utterance Intensity ... 40
3.2 Task Performance ... 49
3.2.1 Statistical Analysis One: Cognitive and Linguistic Task Scores ... 49
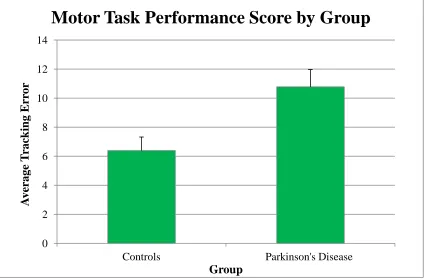
3.2.2 Statistical Analysis Two: Motor Task Scores ... 58
3.3 Durational Measures ... 64
3.3.1 Overall Utterance Duration ... 64
3.3.2 Carrier Phrase Duration ... 75
3.3.3 Response Time ... 85
3.3.4 Response Latency ... 91
3.3.5 Sentence-Response Latency ... 93
Chapter 4 ... 100
4 Discussion ... 100
4.1 Intensity... 101
vii
4.2.1 Cognitive and Linguistic Task Performance ... 106
4.2.2 Motor Task Performance ... 109
4.3 Durational Measures ... 111
4.3.1 Overall Utterance Duration ... 111
4.3.2 Carrier Phrase Duration ... 114
4.3.3 Response Time ... 116
4.3.4 Response Latency. ... 117
4.3.5 Sentence-Response Latency. ... 118
4.4 Strengths and Limitations ... 120
4.4.1 Sample and Participant Characteristics ... 120
4.4.2 Task-Related ... 121
4.5 Directions for Future Research ... 122
4.6 Implications for Clinical Application ... 123
4.7 Summary and Conclusions ... 124
References ... 127
Appendices ... 138
viii
List of Tables
Table 1. Description of participants with Parkinson's disease... 17
Table 2. Description of control participants... 18
Table 3. Mean carrier phrase intensity values and standard error by task condition for the control and Parkinson’s disease participants.... 31
Table 4. Mean carrier phrase intensity values and standard error by subject group for the controls and Parkinson’s disease participants. ... 33
Table 5. Mean carrier phrase intensity values and standard error by task type for the control and Parkinson’s disease participants. ... 34
Table 6. Mean target word intensity values and standard error by subject group (control and Parkinson’s disease). ... 37
Table 7. Mean target word intensity values and standard error by task condition for the control and Parkinson’s disease participants.... 38
Table 8. Mean target word intensity values and standard error by task type for the control and Parkinson’s disease participants. ... 39
Table 9. Mean overall utterance intensity values and standard error task condition for the control and Parkinson’s disease participants.... 42
Table 10. Mean overall utterance intensity values and standard error by subject group
(control and Parkinson’s disease). ... 44
Table 11. Mean overall utterance intensity values and standard error by task type for the control and Parkinson’s disease participants.... 45
ix
the control and Parkinson’s disease participants. ... 48
Table 14. Mean performance score for the cognitive and linguistic task per difficulty level
and standard error by subject group (control and Parkinson’s disease). ... 51
Table 15. Mean performance score for the cognitive and linguistic task per difficulty level
and standard error by task condition.... 52
Table 16. Mean task performance score for the cognitive and linguistic task per difficulty level and standard error by task type for the controls and participants with Parkinson’s
disease. ... 53
Table 17. Mean task performance score for the cognitive and linguistic task and standard error by level of difficulty for the controls and participants with Parkinson’s disease. ... 54
Table 18. Mean task performance score for the cognitive and linguistic task and standard
error per difficulty level by group and task type for the controls and participants with
Parkinson’s disease. ... 56
Table 19. Mean task performance score for the cognitive and linguistic task and standard
error per difficulty level by task type and difficulty level for the controls and participants
with Parkinson’s disease.... 57
Table 20. Mean task performance score for the motor task and standard error per difficulty level per group (controls and participants with Parkinson’s disease). ... 59
Table 21. Mean task performance score for the motor task and standard error per difficulty
level per task condition. ... 60
Table 22. Mean task performance score for the motor task and standard error by level of difficulty for the controls and participants with Parkinson’s disease. ... 61
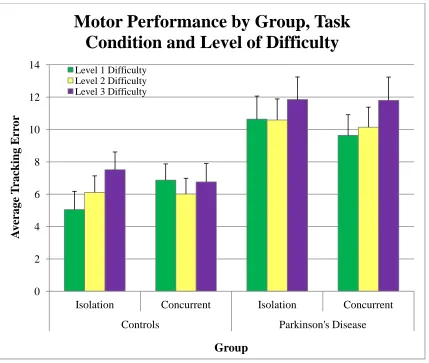
Table 23. Mean task performance score for the motor task by group, task condition and
x
and participants with Parkinson’s disease. ... 64
Table 25. Mean overall utterance duration and standard error by task type for the controls and participants with Parkinson’s disease. ... 66
Table 26. Mean overall utterance duration and standard error by task type for the controls and participants with Parkinson’s disease. ... 68
Table 27. Mean overall utterance duration and standard error subject group (controls and participants with Parkinson’s disease). ... 70
Table 28. Mean overall utterance duration and standard error by level of difficulty for the controls and participants with Parkinson’s disease. ... 71
Table 29. Mean overall utterance duration and standard error by subject group and task type
for the controls and participants with Parkinson’s disease.... 73
Table 30. Mean overall utterance duration and standard error by task type and level of
difficulty for the controls and participants with Parkinson’s disease. ... 74
Table 31. Mean carrier phrase duration and standard error by task type for the controls and participants with Parkinson’s disease. ... 76
Table 32. Mean carrier phrase duration and standard error subject group (controls and participants with Parkinson’s disease). ... 78
Table 33. Mean carrier phrase duration and standard error by task type for the controls and participants with Parkinson’s disease. ... 79
Table 34. Mean carrier duration and standard error by level of difficulty for the controls and participants with Parkinson’s disease. ... 81
xi
controls and participants with Parkinson’s disease. ... 84
Table 37. Standard error by subject group, task type and level of difficulty for the controls and participants with Parkinson’s disease. ... 85
Table 38. Mean response time and standard error by subject group (controls and
participants with Parkinson’s disease). ... 86
Table 39. Mean response time and standard error by task type for the controls and
participants with Parkinson’s disease. ... 87
Table 40. Mean response time and standard error by level of difficulty for the controls and participants with Parkinson’s disease. ... 88
Table 41. Mean response time and standard error by subject group and task type for the controls and participants with Parkinson’s disease. ... 89
Table 42. Mean response time and standard error by subject group and level of difficulty for the controls and participants with Parkinson’s disease. ... 90
Table 43. Mean response latency and standard error by subject group (controls and
participants with Parkinson’s disease). ... 92
Table 44. Mean sentence-response latency and standard error by subject group (controls and participants with Parkinson’s disease). ... 94
Table 45. Mean sentence-response latency and standard error by task type for the controls and participants with Parkinson’s disease. ... 95
Table 46. Mean sentence-response latency and standard error by level of difficulty for the
controls and participants with Parkinson’s disease. ... 96
Table 47. Mean sentence-response latency and standard error by subject group and task type
xii
xiii
List of Figures
Figure 1. Durational measures for the concurrent cognitive, linguistic and motor tasks. ... 24
Figure 2. Durational measures for the isolation cognitive and linguistic tasks. ... 24
Figure 3. Carrier phrase intensity by task condition for the control and Parkinson's disease
participants. ... 31
Figure 4. Carrier phrase intensity by subject group (controls and Parkinson’s disease). ... 33
Figure 5. Carrier phrase intensity by task type for the control and Parkinson’s disease
participants. ... 34
Figure 6. Target word intensity by subject group (control and Parkinson’s disease). ... 37
Figure 7. Target word intensity by task condition for the control and Parkinson’s disease
participants. ... 38
Figure 8. Target word intensity by task type for the control and Parkinson’s disease
participants. ... 39
Figure 9. Overall utterance intensity by task condition for the control and Parkinson’s disease
participants. ... 42
Figure 10. Overall utterance intensity by subject group (control and Parkinson’s disease). . 44
Figure 11. Overall utterance intensity by task type for the control and Parkinson’s disease
participants. ... 45
Figure 12. Overall utterance intensity by subject group and task type for the control and Parkinson’s disease participants. ... 46
Figure 13. Overall utterance intensity by level of difficulty for the control and Parkinson’s
xiv
(control and Parkinson’s disease). ... 51
Figure 15. Cognitive and linguistic performance score per difficulty level by task condition.
... 52
Figure 16. Cognitive and linguistic performance score per difficulty level by task type for the controls and participants with Parkinson’s disease. ... 53
Figure 17. Cognitive and linguistic performance score by level of difficulty for the controls and participants with Parkinson’s disease... 54
Figure 18. Cognitive and linguistic performance score per difficulty level by group and task type for the controls and participants with Parkinson’s disease. ... 56
Figure 19. Cognitive and linguistic performance score per difficulty level by task type and
difficulty level for the controls and participants with Parkinson’s disease. ... 57
Figure 20. Motor performance score per difficulty level by group (controls and participants with Parkinson’s disease). ... 59
Figure 21. Motor performance score per difficulty level by task condition for the controls and participants with Parkinson’s disease... 60
Figure 22. Motor performance score by level of difficulty for the controls and participants with Parkinson’s disease. ... 61
Figure 23. Motor performance score by group, task condition and difficulty level for the controls and participants with Parkinson’s disease. ... 63
Figure 24. Overall utterance duration by task type for the controls and participants with Parkinson’s disease. ... 66
xv
Parkinson’s disease). ... 70
Figure 27. Overall utterance duration by level of difficulty for the controls and participants with Parkinson’s disease. ... 71
Figure 28. Overall utterance duration by subject group and task type for the controls and participants with Parkinson’s disease. ... 73
Figure 29. Overall utterance duration by task type and level of difficulty for the controls and participants with Parkinson’s disease. ... 74
Figure 30. Carrier phrase duration by task type for the controls and participants with
Parkinson’s disease. ... 76
Figure 31. Carrier phrase duration by subject group (controls and participants with
Parkinson’s disease). ... 78
Figure 32. Carrier phrase duration by task type for the controls and participants with
Parkinson’s disease. ... 79
Figure 33. Carrier phrase duration by level of difficulty for the controls and participants with Parkinson’s disease. ... 81
Figure 34. Utterance duration by task type and level of difficulty for the controls and
participants with Parkinson’s disease. ... 83
Figure 35. Utterance duration by subject group, task type and level of difficulty for the controls and participants with Parkinson’s disease. ... 84
Figure 36. Response time by subject group (controls and participants with Parkinson’s
disease). ... 86
Figure 37. Response time by task type for the controls and participants with Parkinson’s
xvi
Parkinson’s disease. ... 88
Figure 39. Response time by subject group and task type for the controls and participants with Parkinson’s disease. ... 89
Figure 40. Response time by subject group and level of difficulty for the controls and
participants with Parkinson’s disease. ... 90
Figure 41. Response latency by subject group (controls and participants with Parkinson’s
disease). ... 92
Figure 42. Sentence-response latency by subject group (controls and participants with
Parkinson’s disease). ... 94
Figure 43. Sentence-response latency time by task type for the controls and participants with Parkinson’s disease. ... 95
Figure 44. Sentence-response latency time by level of difficulty for the controls and
participants with Parkinson’s disease. ... 96
Figure 45. Sentence-response latency time by subject group and task type for the controls and participants with Parkinson’s disease... 98
xvii
List of Appendices
Appendix A ... 138
Appendix B ... 139
Appendix C ... 140
Appendix D ... 141
Appendix E ... 142
Appendix F ... 145
Appendix G ... 147
Appendix H ... 149
Appendix I ... 152
Appendix J ... 153
Appendix K ... 156
Appendix L... 157
Appendix M ... 159
Appendix N ... 161
Appendix O ... 164
Appendix P ... 166
Appendix Q ... 167
Appendix R ... 169
xviii
... 174
Appendix U ... 176
Appendix V ... 178
Appendix W ... 180
Appendix X ... 183
Appendix Y ... 184
Appendix Z ... 186
Appendix AA ... 189
Appendix BB ... 192
Chapter 1
1
Introduction
Idiopathic Parkinson’s disease is a neurodegenerative movement disorder
physically characterized by four primary symptoms: tremors, rigidity, bradykinesia, and
postural instability (Duffy, 2005). Although there is an overarching lack of biomarkers
and neuroimaging signs to aid in both diagnosing and understanding Parkinson’s disease,
previous research has been able to highlight a depletion of the neurotransmitter dopamine in the substantia nigra as a distinctive defect of this disease. The cause of Parkinson’s
disease is currently unknown, however, certain risk factors such as environmental
triggers and genetic susceptibility have all been considered possible contributors to the
onset of the disease (MacPhee, 2008; Marks, Hyland & Fiske, 2008).
The incidence rate of this disease in Canadians is approximately 252 people in
every 100 000 (Jones, Wayne Martin, Wieler, King-Jesso & Voaklander, 2012), with 4.6
million cases currently reported globally, a number that is expected to rise to 8.67 million
by the year 2030 (Dorsey et al., 2007). Of these individuals, between 80 and 90% suffer
from a speech disorder (Adams & Dykstra, 2009). The changes in speech and voice quality caused by this neurological damage can be debilitating, hindering an individual’s
ability to successfully interact with others.
1.1
Motor Symptoms in Parkinson’s Disease
The diagnosis of Parkinson’s disease is entirely reliant on clinical examination of the individual’s symptoms and is based on the presence of at least two of the four motor
symptoms of Parkinson’s disease. Tremor is usually the first symptom noticed by individuals with Parkinson’s disease, and generally begin in one hand before progressing
to the lower limbs and opposite side of the body. The tremor often originates as a
rhythmic movement of the thumb and index finger, occurring while the hand is at rest
(Samii, 2008). Rigidity is observed as increased muscle tone and resistance to passive
movements and is independent of the direction and speed of movement. This resistance
pipe” when it is smooth, or “cogwheel” when it is intermittent across the range of a
movement (MacPhee, 2008; Marks et al., 2008; Samii, 2008). The slowness of voluntary
movements, characteristic of those with Parkinson’s disease, is called bradykinesia.
Bradykinesia is often observed in this patient population concurrent with akinesia, the
reduction in spontaneous voluntary movements (MacPhee, 2008; Marks et al., 2008;
Samii, 2008). The final motor symptom of Parkinson’s disease is postural instability. This symptom is rarely seen during the early stages of Parkinson’s disease except in older
populations. Postural instability and gait disturbance can be observed as short, shuffled
steps. The worsening of this symptom can lead to an increased number of falls for the
individual, as well as freezing when trying to initiate walking or when turning (Giladi &
Nieuwboer, 2008; Marks et al., 2008; Samii, 2008).
1.2
Hypokinetic Dysarthria in Parkinson’s Disease
Hypokinetic dysarthria is a motor speech disorder that is typically associated with Parkinson’s disease. Approximately 75% of individuals with Parkinson’s disease will
develop a speech or voice issue related to this neurological disorder (Dykstra, 2007; Sapir, Ramig, Hoyt, Countryman, O’Brien & Hoehn, 2002). The characteristics of this
disorder can be observed in the respiratory, phonatory, resonatory and articulatory
processes of speech production, with its predominant symptoms being found in voice
articulation and prosody (Duffy, 2005; Sapir, Ramig & Fox, 2008). Darley, Aronson and
Brown (1969) initially classified the following characteristics as the most prominent
features of hypokinetic dysarthria: monopitch, monoloudness, reduced stress, rate
abnormalities, imprecise consonants, harshness in voice quality, breathy voice, and
inappropriate silences. Reduced speech intensity and fast speech have also been
identified as important features of hypokinetic dysarthria. Reduced speech intensity, or
hypophonia, is a common characteristic that occurs in more than 40% of individuals with
hypokinetic dysarthria (Adams & Dykstra, 2009; Dykstra, 2007; Gamboa,
Jimenez-Jimenez, Niet, Montojo, Orti-Pareja, Molina et al., 1997; Ludlow & Bassich, 1984). Fast
speech is observed in about 20% of individuals with hypokinetic dysarthria (Adams &
1.3
Hypophonia in Parkinson’s Disease
Hypophonia is one of the most common speech symptoms in Parkinson’s disease.
The low speech intensity associated with hypophonia can have a negative effect on a person’s ability to communicate and interact with others. This speech disorder results in
an average intensity that is approximately two to four decibels lower than that of healthy
adults. This difference in intensity equates to a 40% perceptual change in loudness
(Adams & Dykstra, 2009; Dykstra, 2007; Fox & Ramig, 1997). The clinically significant
difference in speech intensity for those with hypophonia compared to normal healthy
adults has been attributed to laryngeal and respiratory abnormalities co-morbid with Parkinson’s disease (Fox & Ramig, 1997; Schulz & Grant, 2000).
Ho, Iansek and Bradshaw (2002) suggested that hypophonia is similar to
hypokinesia of the limbs and that it reflects a progressive decline in the amplitude of
movements. It has also been suggested that hypohonia may be linked to a sensorimotor integration deficit in Parkinson’s disease. In this context, the reduction in speech intensity
is believed to be linked to a deficit in the perception or sensation of one’s own speech
loudness. In a study assessing this deficit, Ho, Iansek and Bradshaw (2000) found that
patients with Parkinson’s disease exhibited problems accurately perceiving the volume of
their speech and consistently overestimated the loudness of their speech. These results
were in support of their initial hypothesis, stating that inaccurate speech perception may
result in reduced speech intensity. In turn, the authors concluded that there is a
relationship between speech production (primary) and speech perception (secondary) in
the scaling of speech intensity. These authors suggest that it is the faulty interaction of these two systems that results in the hypophonic speech of Parkinson’s disease (Ho,
Iansek, & Bradshaw, 2000).
Hypophonia has been examined in the context of isolated conversations as well as
in situations involving background noise (Adams, Haralabous, Dykstra, Abrams, & Jog,
2005). In studies evaluating the effect of background noise on conversational speech
intensity, individuals with hypophonia have been found to speak two to three decibels
lower than healthy age-matched controls, a perceptually detectable difference (Adams et
(2006) asked participants to engage in conversation when presented with five levels of
multi-talker background noise, imitate three speech intensity targets, and produce their
maximum speech intensity. All participants showed an increase in speech intensity as the
multi-talker background noise increased, however, participants with Parkinson’s disease
had significantly lower speech intensities at each level, of approximately two to three
decibels. In addition, the individuals with Parkinson’s disease also had significantly
lower speech intensity during the imitation task, approximately three to four decibels
lower, and had a lower maximum speech intensity, lower by six to seven decibels. This
study provided preliminary support for the notion that individuals with Parkinson’s
disease follow a similar pattern of increasing speech intensity when presented with
background noise as control participants, but the individuals with Parkinson’s disease
appear to consistently underestimate their speech intensity. It appears that individuals
with Parkinson’s disease seem to believe that they are speaking louder than they actually
are speaking (Adams et al., 2006).
1.4
Cognitive Dysfunction in Parkinson’s Disease
Individuals with Parkinson’s disease will often experience a decline in cognitive
functioning as a result of cholinergic, dopaminergic, and noradrenergic innervations
deficits in the substantia nigra (Braak, Rüb, Gai and Del Tredici, 2003; Emre, 2004).
Irregular activity in the frontal and associated parietal regions, such as in the dorsal
premotor cortex and the inferior parietal lobule, has indicated that cognitive dysfunction in Parkinson’s disease is not domain-specific but occurs globally as the disease spreads
(Braak et al., 2003; Huang, Mattis, Tang, Perrine, Carbon and Eidelberg, 2007). In
addition, cognitive decline may result as a side effect of certain medications used to treat
other parkinsonian symptoms (Zesiewicz, Sullivan and Hauser, 2006). Approximately 40% of individuals with Parkinson’s disease will develop dementia, with the chance of
onset increasing as the duration of the disease lengthens. For example, individuals who survive with Parkinson’s disease for longer than ten years have a 75% chance of
developing dementia. The incidence rate of developing dementia in this population is
four to six times greater than in normal healthy controls. Certain risk factors for
cases of Parkinson’s disease, older age, and evidence of mild cognitive impairment
(Bronnick, 2010; Marder & Jacobs, 2008). The deficits caused by cognitive decline do
not appear to be restricted to any particular cognitive domain, but instead are widespread
with problems arising in attention and executive functioning, visuospatial functioning,
memory, and language (Bronnick, 2010; Crescentini, Mondolo, Biasutti, & Shallice,
2012; Marder & Jacobs, 2008; Rodríguez-Ferreiro, Cuetos, Herrera, Menéndez &
Ribacoba, 2010).
An individual’s ability to plan, initiate and execute actions for goal-directed
behavior is the responsibility of attention and executive functioning. Problems with these
functions draw into question the ability for one to perform normal activities of daily
living and the capacity to take care of oneself. This issue becomes even more relevant especially as the individual’s mental capacity declines from mild cognitive impairment to
dementia. Previous research has indicated that this may not be the result of fewer
attentional resources for allocation, but instead the individual’s perceived difficulty of the
task. Individuals with Parkinson’s disease have been found to use more resources for the
same task as healthy older adults due to this increase in perceived difficulty (Brown &
Marsden, 1991; Goldenberg, 1990). A two-part study by Brown and Marsden (1991) was
conducted to determine if there was a significant difference in performance due to the process of sharing attentional resources in participants with Parkinson’s disease as
compared to healthy older adults. This study raised questions as to whether or not the
differences found in performance could be attributed to attentional resource depletion in the Parkinson’s disease group or a deficit in the processes related to resource-switching.
In the first experiment of the study, 40 healthy adult subjects were recruited to perform a
cued and non-cued version of the Stroop task while performing one of three various
secondary tasks; foot tapping, articulatory suppression or random number generation. A
fourth group served as controls by having no secondary task to perform. Brown and
Marsden found that the non-cued Stroop task caused greater demands on the limited
capacity central processer within the supervisory attentional system of the working
memory framework. In light of this, the more demanding of the secondary tasks would
have shown a greater deterioration in performance as even more demands were placed on
generation task which was hypothesized to be the most demanding secondary task. The
second experiment asked 18 participants with idiopathic Parkinson’s disease to perform
the cued and non-cued Stroop task and each of the secondary tasks in a balanced order.
For the control group, there were no significant differences between the reaction times
reported for the three different tasks, whereas the subjects with Parkinson’s disease had a
significantly greater increase in reaction time for the random number generation task than
they did for the foot tapping and articulatory suppression secondary tasks. From the
results of these two studies, Brown and Marsden (1991) concluded that the supervisory
attentional system, a major component of executive functioning and schema activation, is impaired in those with Parkinson’s disease.
This conclusion was also reached by Goldenberg (1990) in a study that looked at
the performance of non-motor concurrent tasks in Parkinson’s disease. Participants were
asked to perform a memory task in isolation, and then perform it concurrently with a
second non-motor task. Two types of tasks were used in isolation and in combination
with a secondary task; a verbal task and a visual task. Although these researchers did not
find that the introduction of a concurrent non-motor task affected the performance of
either the group of participants with Parkinson’s disease without dementia subjects or the
healthy controls, the results did indicate that there was a deficit in cognitive functioning
related to attentional control (Goldenberg, 1990).
Visuospatial functioning has been found to be impaired in individuals with Parkinson’s disease and dementia, to a greater degree than those with Alzheimer’s
dementia and no co-morbid neurological disease. This could be a result of the
inter-related nature of visuospatial processes with executive functioning and fine motor control
(Bronnick, 2010; Zesiewicz et al., 2006). Kemps, Szmalec, Vandierendonck and Crevitis (2005) demonstrated that individuals with Parkinson’s disease performed worse on a
visuospatial task than healthy older adults. These individuals were asked to complete the
Corsi blocks task in isolation, then perform this task concurrent with a spatial tapping
task, and, finally, concurrent with a random interval repetition task. No difference in
performance was found between groups for the secondary tasks, however, performance
performed concurrently with the secondary tasks. The participants with Parkinson’s
disease did not experience a significant difference in performance dependent on the type
of secondary task, indicating that the visuospatial deficit is closely linked with a central
executive deficit in manipulating information. Kemps et al. (2005) did identify various
factors that may have contributed to the severity of this deficit based on their results,
including severity of the disease and advancement of age. This research provided
evidence that impairments of the central executive function occur during the initial stages of Parkinson’s disease, whereas visuospatial deficits appear during the moderate stages of
this neurological disease, a function of both aging and disease progression.
Dalrymple-Alford, Kalders, Jones and Watson (1994) found a similar result in their study analyzing
visuomotor tracking performance and forward digit span performance in isolation and
concurrent settings. Individuals with Parkinson’s disease were less able to perform the
visuomotor tracking task and the forward digit span task concurrently than the control
group. This was observed through their degrading tracking performance. In addition, the
dual task impairment was only observed for the visuospatial task and was not seen in the
verbal task. Dalrymple-Alford et al. (1994) provided numerous explanations for this
trend, including the process of learning the tasks and fatigue levels. However, the
explanation of greatest interest involves the concept that the tracking task was more
difficult, as it required greater effort and cognitive resources to complete, as opposed to
the verbal task. This would indicate that a visuospatial deficit may be highly related to a
central executive impairment (Dalrymple-Alford et al., 1994).
As cognitive function declines, patients with Parkinson’s disease, as well as their
family members and friends, may report difficulty with short-term memory, whereas
long-term memory remains fairly unaffected (Zesiewicz et al., 2006). This may be a
result of poor encoding abilities and retention of the material, as research on recognition
capabilities appears to be inconclusive (Bronnick, 2010). The inability to properly
encode and retain memory traces may be a result of an impaired supervisory attentional
system of working memory, affecting the distribution and allocation of attentional
resources. In addition, dysfunction in working memory will cause problems with
manipulation of information and subsequent slowing of information processing
with Parkinson’s disease due to certain mood disorders, such as apathy and depression
(Butterfield, Cimino, Oelke, Hauser & Sanchez-Ramos, 2010; Pagonabarraga &
Kulisevsky, 2012).
Current research suggests that linguistic impairments for those with Parkinson’s
disease can be attributed to attention and executive functioning deficits as well as
limitations due to motor control impairment, affecting their speech abilities (Theodoros &
Ramig, 2011; Zesiewicz et al., 2006). Previous studies analyzing speech-motor influence
on linguistic abilities has shown that increased linguistic demands can cause disruptions
and dysfluency in the speech system. In assessing linguistic complexity on speech production in Parkinson’s disease, Walsh & Smith (2011) devised a study that used
behavioural and physiological measures to determine the effects on speech response
latency, interarticulatory coordinative consistency, accuracy of speech production,
response latency and response accuracy. They found that individuals with Parkinson’s
disease had greater motor speech variability for all the sentence conditions, took longer to
initiate speech, and made more speech errors on the speaking tasks. These results could
indicate longer and less controlled speech planning processes, an effect of the attentional
demands of the tasks being completed. This is similar to the findings found in a study
conducted by Dromey and Benson (2003) researching lip kinematics for concurrent task
performance. The linguistic impairments found in Parkinson’s disease are not limited to
the physical production of speech, but are also found in the comprehension of language.
Semantic and phonemic verbal fluency have been found to be impaired in non-demented individuals with Parkinson’s disease (McDowd, Hoffman, Rozek, Lyons, Pahwa, Burns
& Kemper, 2011; Theodoros & Ramig, 2011). Much work has been conducted
evaluating sentence comprehension deficits in Parkinson’s disease, which have been
linked to grammatical comprehension deficits as well as executive functioning challenges
(Colman, Koerts, Stowe, Leenders & Bastiaanse, 2011). All of these factors may
contribute to the impaired pragmatic communication, verbal and nonverbal social skills, found in individuals with Parkinson’s disease (Hall, Ouyang, Lonnquist & Newcombe,
1.5
Speech and Concurrent Task Research
Humans have the remarkable ability to produce speech, a highly complex
behaviour, while simultaneously performing a diverse number of concurrent cognitive
and motor activities. Numerous theories have been proposed to account for this
remarkable ability to perform concurrent speech, motor and cognitive tasks. One of the
most widely accepted theories of attention was presented by Daniel Kahneman (1973),
detailing the allocation of a limited number of cognitive resources among competing
tasks. In this model, a finite amount of cognitive resources can be divided and distributed
to each task, based on the demands needed for each to be carried out. This model
remains nonspecific and flexible, allowing the individual to have considerable control
over the allocation of these resources to each task. As the demands of one task increases,
cognitive resources may be drawn from other areas and reallocated as seen fit (Reed,
2007).
Kinsbourne and Hicks (1978) supplemented a neurophysiological model to the
pre-existing psychological process of resource allocation provided by Kahneman in
proposing the functional distance hypothesis for dual interference. In this theory,
Kinsbourne and Hicks state that the more separate the activated brain regions, the less
interference there will be for each task. Consequently, the closer the activated brain
regions are, the greater the interference for the two tasks. In this manner, tasks that seem
to utilize the same processes would overlap and compete for the same cognitive
resources, whereas tasks that were very distinct from one another would provide less
interference as they would be using separate neural pathways (Kinsbourne & Hicks,
1978).
The use of speech in concurrent task experiments has the potential to reveal
important information about the attentional resources and the distinct cognitive and motor
processes that are involved in speech production (Dromey & Bates, 2005). Dromey and
Benson (2003) examined the effect of the performance of several concurrent tasks on the
speech of healthy adults. Utilizing four conditions, a speech task and either a cognitive,
coordination of the speech-related movements of the upper lip, lower lip and jaw. They
found that whereas the motor task produced smaller lower lip displacement values and a
significant decrease in velocity, the cognitive and linguistic task produced a significant
increase in the spatiotemporal index for the lower lip. These results by Dromey and
Benson (2003) demonstrate that concurrent tasks can have a significant effect on speech
kinematics and that these kinematic effects can be dramatically influenced by the nature
of the concurrent task.
In a related concurrent speech task study involving healthy control participants,
Dromey and Bates (2005) found increased speech intensity in both concurrent linguistic
and cognitive task conditions, and no significant change for intensity in a concurrent
motor task condition. These results were thought to provide support for the functional
distance hypothesis but they also felt that their results could also reflect a generalized
increase in performance effort that was caused by attempting to perform a concurrent
task. The motor task results for this study directly contrast with the results obtained by
Dromeyand Shim (2008) in a subsequent concurrent speech task study. Dromey and
Shim (2008) conducted a study to investigate the applicability of the functional distance
hypothesis through concurrent task performance of 20 young adults. The participants
were asked to perform a speech task, a verbal fluency task, a right-handed task, and a
left-handed task, in isolation and then concurrently. In this study, Dromey and Shim (2008) found that the concurrent limb motor task significantly increased the participants’
speech intensity.
The results of previous preliminary research related to the effect of concurrent
tasks on speech in Parkinson’s disease have been inconsistent. One previous study by Ho
et al. (2002) found that a concurrent manual motor task was associated with a significant
reduction in the speech intensity of participants with Parkinson’s disease. In contrast, a
recent preliminary study by Adams, Winnell and Jog (2010) found that a concurrent
manual task was associated with a significant increase in conversational speech intensity
in participants with Parkinson’s disease. Based on this result and the similar results that
were obtained in Dromey and Bates (2005), an energizing hypothesis was proposed by
and cognitive tasks can be associated with an overall increase in effort level which in turn
can have an energizing or enhancing effect on concurrent speech intensity levels. Based
on the preliminary results from Adams and colleagues of a concurrent motor task in
Parkinson’s disease, it is hypothesized that individuals with Parkinson’s disease will
show a relatively greater energizing effect of concurrent tasks than control participants.
The effects of concurrent linguistic and cognitive tasks on speech intensity have not been examined in Parkinson’s disease. Thus, the energizing hypothesis has not been
systematically evaluated in previous studies of speech intensity regulation in Parkinson’s
disease.
1.6
Task Development
To determine the effect of various concurrent tasks on speech intensity for those with Parkinson’s disease, a speech, cognitive, linguistic and motor task needed to be
developed to evaluate these processes. The developed tasks referenced previous studies
in their design and were modified for the purpose of providing novel tasks with a varying
level of difficulty.
Speech Task. The nature of this study requires an individual to repeat a carrier phrase a minimum of 60 times throughout its completion. For this study, the phrase “The next word I am going to say is” was selected as the carrier phrase because it is a natural sentence that could be spoken prior to responding with the supplied target word “peach”, or with the individual’s own generated answer. The target word “peach” was chosen as it
was not related in any manner to the nouns presented in the linguistic task, therefore no
priming could occur, and the word initial voiceless bilabial stop allowed for a clear
analysis as to where the carrier phrase ended and the target word began.
Cognitive Task.Previous research has used mathematical questions in order to
manipulate cognitive abilities in the participant population (Dromey & Bates, 2005). For
the purpose of this study and maintaining consistency with previous research,
mathematical addition questions were used for the cognitive task. Three difficulty levels
were determined for the task based on ease of the question presented. The first level of
level of difficulty, posing more difficult questions, required the addition of double digit –
single digit questions, such as 45 + 8. The final level of difficulty, with the hardest
questions, consisted of double digit – single digit – single digit addition, for example 52 +
6 + 4. The questions were generated randomly using an online random integer generating
database (Haahr, 1998). The parameters for each level were input into the generator, and
then the resulting 15 integers were paired up, left to right, to create a novel mathematical
addition question. Fifteen math questions were selected for the isolation cognitive task
with five questions at each difficulty level, and 15 math questions were selected for the
concurrent speech + cognitive task with five questions at each difficulty level (refer to
Appendix C for the questions used in the isolation cognitive task and Appendix D for the
questions used in the concurrent speech + cognitive task).
Linguistic Task.In order to determine the effect of a linguistic task on concurrent performance, previous research has used various tasks in order to best capture the nature
of this relationship. In the past, linguistic tasks such as spontaneous monologues,
phonemic fluency tasks, and counting have been used. This study referenced the work of
Del Missiers and Crescentini (2011) in noun and verb generation for individuals with Parkinson’s disease to devise a linguistic task suitable for the methodology of the study.
A pilot study was conducted using the 67 noun stimuli from the study conducted
by Del Missiers and Crescentini (2011). Each noun was translated from the original
presentation in Italian to English. The noun stimuli were randomized and displayed in
hard copy. The questionnaire was distributed to a fourth year undergraduate class, asking
them to provide an associated verb for each noun stimuli. Fifty questionnaires were
returned completed (refer to Appendix E for the questionnaire). The verb responses for
each noun were collected and tallied, and then divided into 3 groups; strong
association-low selection, strong association-high selection, and weak association-high selection. A
noun is classified as strong association if a stimulus has a high activation for a particular verb response, as can be observed in the relationship between “book” and “read”. In
contrast, a noun is categorized as weak association if there is no verb response that is strongly related to the noun, such as in the case of the word “comet”. The selection
associated with the noun stimuli, independent of the strength of the association of the
verb (Del Missiers & Crescentini, 2011). After division into these three categories, 30
nouns were chosen for use in the study, 15 noun stimuli for the isolation linguistic task
with five questions for each difficulty level and 15 noun stimuli for the concurrent speech
+ linguistic task with five questions for each difficulty level (refer to Appendix F for the
questions used in the isolation linguistic task and Appendix G for the noun stimuli used
in the concurrent speech + linguistic task).
Motor Task.Various visuomotor tasks have been used in previous studies to simulate motor movements. Dromey and Bates (2005) used a visuomotor task in which the
participant was asked to click on random targets when they appeared on a display screen.
In another study conducted by Dromey and Shim (2008), participants were asked to place
pegs in a pegboard. Finger tapping and manipulating nuts and bolts are two of many
other motor tasks that have been used to examine dual-task speech motor performance
(Dromey and Benson, 2003; Galletly & Brauer, 2005). The task used in this study
needed to be challenging for both the healthy older adults and the individuals with Parkinson’s disease, without having cause for confounding results due to the fine motor
control constraints of the neurological disease. This study utilized the visuomotor
tracking task created by Adams et al. (2010) which required the participant to track a
continuous vertical sinusoidal target on a display screen by manipulating a handheld
pressure bulb. The exerted pressure on the hand held bulb causes a horizontal line to rise
and fall, allowing the participant to track the generated moving band as accurately as
possible. Levels of difficulty for the visuomotor tracking task in this study were defined
by the movement speed and frequency of the computer generated visual target. The
initial speed was 0.25 Hz for the first difficulty level. This speed increased for the second
difficulty level to 0.5 Hz, and to 0.75 Hz for the third difficulty level. Each tracking trial
lasted approximately 24 seconds in the isolation motor task condition. In the concurrent
condition, the trial consisted of the duration of the participant’s repetition of the spoken
1.7
Objectives and Hypotheses
The goal of this study was to investigate the effect of three concurrent tasks on speech intensity in individuals with Parkinson’s disease. The three concurrent tasks
included a concurrent linguistic task (verb generation), a concurrent cognitive task (math
addition), and a concurrent motor task (manual visuomotor tracking). Each task was
examined across three levels of increasing difficulty. Based on the energizing
hypothesis, it was predicted that each of the concurrent tasks would be associated with an
increase in speech intensity. It was further predicted that the energizing effect of the
concurrent tasks would be relatively greater in the Parkinson’s disease participants than
in healthy control participants. Thus, the following specific hypotheses were examined in
this study:
1) Performing a concurrent cognitive, linguistic, or motor task while speaking will
result in an increase in speech intensity in both experimental groups.
2) Participants with Parkinson’s disease will show a relatively greater increase in
concurrent speech intensity than control participants.
3) As the difficulty of the specific concurrent task increases across three levels there
will be a corresponding increase in concurrent speech intensity.
4) There will be reciprocal energizing effects of the concurrent speech task on the
concurrent cognitive, linguistic and motor tasks. This prediction is examined by
obtaining performance scores for each of the cognitive, linguistic and motor tasks
in isolation and during the concurrent speech task. Thus, it is hypothesized that,
relative to the performance scores obtained in isolation, the cognitive, linguistic
and motor tasks will show improved performance scores when they are performed
concurrently with the speech task.
5)
There will be greater interference for performance on the linguisticand cognitive concurrent tasks than for the motor concurrent task based on the
predictions of the functional distance hypothesis. The cognitive and linguistic
tasks are believed to both engage phonological processes and therefore they are
predicted to interfere with the speech task. The limb motor task will engage
processes involved in the speech task and therefore should have a minimal dual
Chapter 2
2
Methods
2.1
Participants with Parkinson’s Disease
Participants with mild to moderate idiopathic Parkinson’s disease (stage 1-3 of the
Hoehn & Yahr Parkinson’s disease severity scale)who were attending the Movement
Disorders program at the London Health Sciences Centre, University Hospital in London,
Ontariowere recruited by neurologist Dr. Mandar Jog for the purposes of this study.
Sixteen individuals with idiopathic Parkinson’s disease participated in this study. One
individual was removed from the study based on their limited understanding of English,
and two others were removed as they were not found to have hypophonic speech.
Therefore, 13 individuals with Parkinson’s disease were considered in this study; 12
males and 1 female with an age range of 57 to 78 years(M=72.85,SD=7.49). See Table 1 for participant demographics on the individuals with Parkinson’s disease. Participants
were required to be fluent in English and demonstrate functional literacy by reading
aloud The Grandfather Passage (Darley et al., 1975). All participants with Parkinson’s
disease were stabilized on anti-parkinsonian medication and tested approximately one to
two hours after receiving a regular dose of medication. Two of the participants with Parkinson’s disease were not currently prescribed any anti-parkinsonian medication. The
other 11 participants were on a variety of anti-parkinsonian medications including (but
not limited to): Levodopa-Carbidopa (Sinemet), Pramipexole (Mirapex), or Levodopa.
There was no prior treatment of hypophonia by a speech-language pathologist for the
participants with Parkinson’s disease. Participants were excluded from the study if there
was a history of a speech, language or hearing impairment, or an additional neurological
disorder. All included participants passed a 30 dB HL hearing screening at 500, 1000,
2000 and 4000 Hertz in both ears. The Montreal Cognitive Assessment (MoCA;
Nasreddine, 2003) was administered to all of the participants with Parkinson’s disease.
Each participant was provided with a letter of information (Appendix H) and asked to
Table 1. Description of participants with Parkinson's disease
Participant ID Group Age Gender Year of
Diagnosis
MoCA Score
23 2 71 Male 2007 21
24 2 60 Male 2007 22
25 2 68 Male 1996 22
26 2 61 Male 2007 27
27 2 76 Male 2011 25
28 2 57 Male 2010 24
29 2 77 Male 2004 15*
30 2 73 Male 2011 28
31 2 78 Male 2008 17
32 2 67 Male 2010 24
33 2 58 Male 2012 25
34 2 59 Female 2002 22
35 2 74 Male 1997 25
*Participant 29 did not complete the drawing components of the MoCA. The final MoCA score for this individual was scored out of 25.
Previous research has indicated that the MoCA is more sensitive in detecting cognitive impairment in individuals with Parkinson’s disease than the Mini-Mental State
Examination. In a study assessing cognitive impairment in 131 individuals with
Parkinson’s disease found the average MoCA score to be 24.9 out of 30, with a score of
26 and higher indicating no cognitive impairment (Nazem, Siderowf, Duda, Have,
Colcher, Horn et al., 2009). In this study, the average MoCA score was 23.5, excluding
the score from Participant 29 because the test was not fully completed. This sample of individuals with Parkinson’s disease is fairly representative of the overall group, as
indicated by similar average scores.
2.2
Control Participants
Control participants were recruited through the Retirement Research Association at
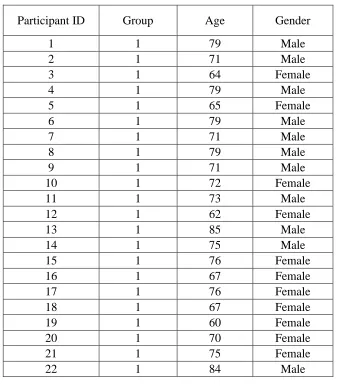
the University of Western Ontario, by Professor Scott Adams. Twenty-two healthy older
adults participated in the study. For the healthy older adults, there was a total of 11males
and 11 females with an age range of 60 to 85 years (M=72.73, SD=6.77) included in the
were required to be fluent in English and demonstrate functional literacy, as proven by a
reading of the Grandfather Passage. All participants had to pass a 30 dB HL hearing
screening at 500, 1000, 2000 and 4000 Hertz in both ears to be included in the study.
Each participant was provided with a letter of information (Appendix J) and asked to sign
a consent form (Appendix I) prior to participation in the study.
Table 2. Description of control participants
Participant ID Group Age Gender
1 1 79 Male
2 1 71 Male
3 1 64 Female
4 1 79 Male
5 1 65 Female
6 1 79 Male
7 1 71 Male
8 1 79 Male
9 1 71 Male
10 1 72 Female
11 1 73 Male
12 1 62 Female
13 1 85 Male
14 1 75 Male
15 1 76 Female
16 1 67 Female
17 1 76 Female
18 1 67 Female
19 1 60 Female
20 1 70 Female
21 1 75 Female
22 1 84 Male
2.3
Apparatus
All testing sessions took place in the Speech Movement Disorders Laboratory
located in Elborn College at the University of Western Ontario. Participants were seated
in a comfortable chair and wore a headset microphone (AKG c420) attached to a
recording of speech. The microphone was calibrated at the beginning of each testing
session. To calibrate the microphone, a sound level meter was placed 15 cm from the participant’s mouth while the participant produced a prolonged ‘ah’ sound at 70 dB as
indicated on the sound level meter for approximately 1-2 seconds. A computer screen
associated with a laptop computer was placed approximately 30 cm in front of the
participants to allow for the presentation of the question stimuli. A sheet with the printed
carrier phrase (Times New Roman, font size 80) was placed in front of the participants
during each task that required its use. The visuomotor tracking signals were presented on
an oscilloscope of a separate device and were controlled by a computer software program
called Tracker (Vercher, 1994a) and placed approximately 30 cm in front of the
participant. Performing the task required the manipulation of a standard hand held
pressure bulb attached to an air pressure transducer system (Glottal Enterprises
MS100-A2). Acoustic analysis software called Praat (Boersma & Weenink, 2011) was used to
obtain speech intensity and durational measures. Specialized motor tracking analysis
softwarecalled Sigma (Vercher, 1994b) was used to obtain visuomotor tracking
performance scores.
2.4
Procedure
During the first part of the experiment, participants performed each of the four
experimental conditions involving the production of the tasks in isolation (simple speech,
verb generation, math addition and motor tracking). Each task utilized 15 instances for
data collection; 15 sentences repeated, 15 math questions, and 15 nouns presented. The
order of these tasks was counterbalanced across all participants. Once these four tasks
had been completed, the participant performed three experimental conditions (concurrent
speech + cognitive, concurrent speech + linguistic, and concurrent speech + motor)
involving concurrent tasks. The order of these three concurrent experimental conditions
was randomized across the participants.
2.4.1 Experimental Conditions
am going to say is peach” 15 times consecutively, prompted by the sound of a beep for
each repetition.
Condition 2: Math Addition Task. The math addition task consisted of 15
mathematical questions. The participant was presented with a mathematical addition
question on a computer display and asked to verbally respond with the correct answer.
The questions increased in difficulty after every set of 5 problems, beginning with 5
single digit - single digit addition questions (3+3), followed by 5 double digit - single
digit addition problems (52+8), and finally, with 5 questions of double digit - single digit
- single digit addition questions (42+4+7).
Condition 3: Verb Generation Task. In the verb generation task, the participant was presented with a written representation of a noun on a computer display and requested to
verbally report a verb action that could be associated with the presented noun. For
example, the participant, presented with the noun “book”, may have responded with the verb action “read”. Fifteen different nouns were displayed in succession, varying in
degree of difficulty on two different levels, association and selection, to create a
hierarchy of three levels of difficulty; strong association-large selection such as “music”,
strong association-low selection as for the noun “cup”, and weak association-low
selection such as for the word “button”. The nouns were presented in the following
order: 5 nouns of strong association-low selection presented first, followed by 5 nouns
designated as strong association-high selection, and finally with 5 nouns delineated as
weak association-high selection.
Condition 4: Motor Task. The motor task involved a visual-motor tracking task using a standard hand-held blood pressure test bulb attached to an air pressure transducer system.
The participant was required to track a continuous vertical sinusoidal target signal on an
oscilloscope-like display by increasing and decreasing the pressure exerted on the hand
bulb. The sinusoidal target appeared as a horizontal band (5mm) moving rhythmically
and vertically across the mid-portion of the screen. The manipulation of the hand bulb
was translated onscreen as the rising and falling of a moving horizontal line. The tracking
pressure) in the center of the continuously moving horizontal band (sinusoidal target).
The difficulty of the task was increased twice throughout the task by increasing the speed
of movement for the horizontal band (sinusoidal target). Each tracking trial lasted approximately 24 seconds and was initiated when the participant’s performance was
observed to normalize. The initial speed was set to 0.25Hz, followed by an increase to
0.5Hz, and the final phase which consisted of the band moving at a speed of 0.75Hz.
Condition 5: Concurrentspeech + cognitive task. The participant performed the math addition task concurrent with the simple speech task. In this concurrent condition, the
participant would solve mathematical addition equations while repeating the carrier phrase “The next word I am going to say is ____”. Once the participant had determined
the answer to the question, the participant would respond with their answer, inserting it at
the end of the carrier phrase. For example, if displayed with the question “3 + 3”, the participant would respond “The next word I am going to say is 6”. The display of each
question was signaled with a tone, prompting the participant to begin by saying the
carrier phrase and solving the question. Each trial lasted as long as necessary for the
participant to provide their best guess at the correct answer for the mathematical addition
equation.
Condition 6: Concurrent speech + linguistic task. Each participant performed the simple speech task and the verb generation task concurrently; in which they performed the verb generation task while repeating the phrase “The next word I am going to say is ____”. In this concurrent task, the participant would insert their verb action response at
the end of the carrier phrase. For example, if the participant was presented with the noun “cup”, they might respond “The next word I am going to say is drink”. Each trial lasted
as long as necessary for the participant to either provide an answer, or indicate that they
could not originate one. The presentation of the noun commenced with a short beep,
notifying the participant that the trial had begun and to begin repeating the carrier phrase
while formulating their answer.
pressure bulb while tracking the onscreen sinusoidal target signal and repeating the original carrier phrase, “The next word I am going to say is peach”. The original carrier
phrase was repeated 5 times at each tracking speed, with each repetition prompted by the
sound of a short beep. After the participant had completed repeating the carrier phrase 5
times, the tracking speed was increased and the task repeated at the faster speed.
2.5
Measures
Data was collected for nine variables and divided into primary and secondary measures.
The primary measures consisted of three intensity variables: carrier phrase intensity,
target word intensity and overall utterance intensity. The secondary measures were
divided into two groups; task performance and durational measures. The task
performance variable consisted of the performance scores for the cognitive, linguistic and
motor tasks. The five durational variables included overall utterance duration, carrier
phrase duration, response time, response latency, and sentence-response latency.
2.5.1
Primary Measures
Intensity. Intensity measurements were obtained for three different variables; carrier phrase intensity, target word intensity and overall utterance intensity (carrier phrase plus
target word intensity). For the overall intensity, the average SPL was measured within
the spectrogram and was taken from the initial formant onset of the first spoken syllable,
defined as the speech onset, to the final formant offset of the last syllable of the sentence,
henceforth referred to as the speech offset. In the case of carrier phrase intensity, the
average SPL was measured from the speech onset to the speech offsetof the final section
of the repeated carrier phrase (“say is...”). For target word intensity, the average intensity
was measured from the initial speech onset of the provided response “peach”, or the
given response to the presented question, to the final speech offset.
2.5.2
Secondary Measures
Task Performance Scores. In the linguistic task, each response that is appropriately associated with the presented noun was scored as correct and received one point. The