c
Owned by the authors, published by EDP Sciences, 2012
Scale effects in necking
T. Dunnett
1, D. Balint
1, H. MacGillivray
1, P. Church
2, and P. Gould
21Department of Mechanical Engineering, Imperial College London, London SW7 2AZ, UK
2QinetiQ Fort Halstead, Sevenoaks, Kent TN14 7BP, UK
Abstract. Geometrically similar specimens spanning a scale range of 100:1 are tested quasi-statically to failure. Images of neck development are acquired using optical means for large specimens, and in-situ scanning electron microscope testing for small specimens, to examine the dependence of neck geometry on a broad range of specimen sizes. Size effects typically arise when the smallest specimen dimension is on the order of a microstructural length (e.g. grain size, dislocation mean free path, etc.), or in the presence of significant plastic strain gradients, which increase the density of geometrically necessary dislocations. This study was carried out for the purpose of investigating scale dependence in models used for predicting dynamic deformation and damage to very high strains for ballistic impact applications, such as the Goldthorpe path-dependent failure model, which includes temperature and strain-rate dependence but does not account for specimen size or a dependence on microstructural lengths. Although the experiments show that neck geometry does not exhibit a clear dependence on specimen size across the range of length scales tested, the statistical variation due to microstructural variations was found to increase monotonically with decreasing size, becoming significant for the smallest (0.35 mm diameter) size, allowing a limit to be identified for reliable model calibration.
1 Introduction
A fundamental role of military design development has been the ability to predict material behaviour under high strain rate loading for certification purposes. Calibrated material models are used to predict shaped charge jet formation, blast interactions as well as general impact with structures. This reduces the number of experimental trials required and lowers costs. Despite these advantages there are still concerns regarding the fidelity of the results, which has driven further research in the area.
To reach predictive modelling, defined as the lowest between being within 5% of the experimental data or within the experimental error of the test, the material and fracture models must be supplied with accurate data and a robust validation process followed. Interrupted tensile tests of numerous materials over a range of strain rates and temperatures allow quantitative sample measurements to be recorded and analysed. This links key material behaviour, stress state and damage evolution, via yielding or cracking mechanisms.
This paper looks at the effect of specimen size on the deformation and fracture behaviour of materials and is part of a wider study aimed at calibrating and investigating the assumptions of constitutive models commonly used to predict high strain rate, high strain material behaviour. It is hoped that shortcomings in the existing constitutive models can be identified and specific outcomes, such as the effect of specimen size on geometric neck evolution parameters, can be applied across a range of materials.
2 Material and fracture models
2.1 Analytic necking solutions
Bridgman’s most sophisticated necking solution tries to determine approximately the stress and strain at the neck
as a function of distance from the axis in the neck [1]. It is based on the initiation of fracture occurring on the axis of the specimen. This was achieved by characterizing the contour in the neighbourhood of the neck using a single parameter, which is the radius of curvature of the circle osculating the profile at the neck. By measuring this parameter the experimental procedure is substantially simplified.
To determine the local strain and stress in the neck, camera images of the necking samples were taken dur-ing the tensile tests [1]. This captures the initiation and evolution of the neck allowing Bridgman’s local strain (εBridgman) and stress (σBridgman) to be calculated (Eqs. 1
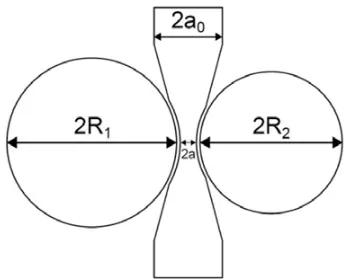
and 2). These expressions take into account the average radius of curvature (Rav) of the neck region as well as the initial (a0) and current (a) cross-sectional radii, which are defined in figure 1. For this definition F is the loading force andRavis the mean value of two radius of curvature measurements,R1andR2.
εBridgman=2 ln
a
0 a
(1)
σBridgman=
F
πa2
1+2Rav
a
Fig. 1.Definition of Bridgman’s local stress and strain.
an evolutionary parameter (ne). F
πa2 =σ¯
1+ 1 n2
ea2
2− 1 ¯ σ
dσ dεa
a Rav
(3)
Although different materials cause the radius of cur-vature to vary differently with strain, the equation does not, within experimental error, depend on specimen size or external conditions.
2.2 Goldthorpe modified-Armstrong-Zerilli body centred cubic constitutive model
For both shocked and unshocked materials the work hard-ening rate is independent of the strain rate [3]. This char-acteristic is a basic assumption of the constitutive equation proposed by Armstrong and Zerilli for body centred cubic metals at small strains, and fuelled the development of equation 4 for the flow stress, ¯σ.
¯
σ=C1+C2exp [T(C3+C4ln ( ˙ε))]+C5εnf (4) This equation features a thermally activated compo-nent, denoted by the inclusion of temperature,T, a strain-dependent component which includes the strain term,εn
f, and a constant,C1, which refers to the athermal resistances of the material [3]. The remaining variablesC2,C3,C4,C5 andnare additional experimental constants and ˙εrelates to the strain rate.
Armstrong and Zerilli based their model for body centred cubic metals on two characteristics that are well established at small strains; strain hardening being in-dependent of both strain rate and temperature [3]. This model represents the original formulation from which the basic forms of the modified constitutive equations were developed.
After comparing work hardening curves at different temperatures Goldthorpe found a small but steady diver-gence with increasing strain [3]. Further investigation then identified that as the temperature of a shocked material diverges from ambient it increasingly diverges from the unshocked data. To address this Goldthorpe introduced a shear modulus correction factor since it is well published that the temperature dependence of the shear modulus
temperature dependence [3]. This model is used to pre-dict isothermal stress-strain curves for body centred cubic metals when combined with measurements of the evolu-tion of the neck radius of curvature with strain. In this equation µT and µ0 are the shear moduli at prevailing and room (293K) temperature, respectively, the ratio of which generates the thermal softening coefficient, andC1 correlates to the summation of C0 andC6 which relates to the athermal resistances associated with factors such as grain boundaries and shock induced twinning, respectively.
2.3 Goldthorpe path-dependent ductile failure constitutive model
To accurately simulate and predict fracture processes a deformation model must be used in conjunction with a fracture model [4]. This is because the failure and fracture of a material is driven by the deformation model which dictates the stress system and the degree of localisation. The Goldthorpe path-dependent ductile failure model is an extension of the Rice and Tracey model [5], and acknowledges ductile failure is caused by a combination of shear and void growth under hydrostatic tension [6].
After extensive testing, Goldthorpe found that the frac-ture criterion was a material property [6]. This gave rise to the material constant,SC, which dictates when a ductile material will fail. The parameter is determined by a quasi-static tension test and is integrated along a hydroquasi-static path. As an interim approach, applicable to all stress distribution states, Goldthorpe’s ductile failure model expresses void growth as a function of stress triaxiality and strain incre-ment as shown in equation 6 [4].
dSc= 2 3
εef f
0 exp
3
2σpoy−0.04σ −1.5 poy
dεef f +Adεs (6) For this equation,εef f is effective plastic strain,dεsis shear failure strain, σpoy is pressure over yield and A is
a constant determined for torsion testing [4]. The damage at each state,dSnew, can then be incrementally calculated using Eq. (7) where dS is damage increment and Sold is the cumulative damage from the previous state.
Snew=Sold+dS (7)
3 Experimental approach
3.1 Microstructural analysis
Fig. 2.Machining procedure.
The EN24T samples were electrochemically etched using a solution of 5% perchloric acid and 95% acetic acid. This was mixed at room temperature using a magnetic stirrer. After applying a voltage of 20 volts between the anode (sample) and the cathode (stainless steel beaker) for 20 seconds the samples appeared sufficiently etched to analyse. Both the voltage applied and the surface area of the sample dictate whether the sample is polished or etched.
With an average grain size equal to approximately 35µm, the proposed specimen scale factor of 10 was adopted and 35 mm, 3.5 mm and 0.35 mm diameter EN24T specimens were machined.
3.2 Specimen preparation
Three geometrically similar tensile specimen sizes were generated from the same 50 mm EN24T round bar to in-vestigate the effect of size. The 35 mm diameter round bar tensile specimen profile was machined using a computer numerical control lathe.
To generate a 3.5 mm diameter sample, the original round bar had to be sectioned along its axis to form a 6 mm thick plate (Fig. 2). This was then cut to achieve a piece with a 6 mm square cross-section. All of these cuts were achieved with a large band saw. Using a male centre and a 4-jaw chuck, the cuboid was then roughly centred before being reduced to a circular cross-sectioned bar. To support the work piece with a 3-jaw chuck and a rotating centre the sample was parted offand re-centred using the same workshop lathe. This meant the work piece could either be machined to fit the collets of a watchmaker’s lathe, or profiled to produce a finished 3.5 mm diameter sample using a workshop lathe.
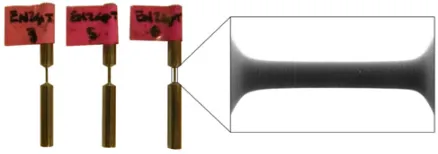
Each 0.35 mm diameter sample was machined using a watchmaker’s lathe. This machine provided additional accuracy and maintained a reasonable finish, in line with that achieved by workshop lathes for the 3.5 mm diameter samples. Practice 0.35 mm diameter samples were initially supported by a collet and a rotating centre. This meant that the prepared round bar had to be centred and sized to fit the gripping collet. Sample rigidity problems then lead to experimentation with rotating centre alternatives. This included another collet, a brass bushing and a lubricated male centre. After testing numerous configurations, no superior alternative was found for the initial cuts, however the brass bushing performed particularly well when turning down to the final diameter of 0.35 mm. By applying this knowledge, and replacing the high-speed steel cutting tools with carbide cutting tools, 0.35 mm diameter samples were successfully machined (Fig. 3).
Fig. 3.0.35 mm diameter EN24T samples.
3.3 Interrupted tensile tests
The selected constitutive models must be capable of de-scribing the behaviour of materials at fracture under high strain rate, high strain and high temperature conditions [3]. To achieve this experimentalists have performed precise dynamic and quasi-static tensile tests. This has allowed generic models for different classes of materials to be determined, before being validated against experiments in the regimes of interest.
The models discussed require constants that are deter-mined by interrupted tensile tests over a range of strain rates and temperatures. By performing tension tests to the late stages of necking, Goldthorpe found values for the work hardening rates to large strains [3]. This was then used, in conjunction with low strain rate tension tests, to calibrate constitutive models by measuring the minimum diameter of the specimen as a function of load and calculating the strain. Goldthorpe determined the true strains and stresses using the standard Bridgman correction method for hydrostatic tension [1].
To generate stress-strain curves for tests operating at strain rates up to 10 s−1, Goldthorpe stopped the test after small increments of strain [3]. At these interruptions, after adiabatic heating, the specimen was returned to room tem-perature before being reloaded. By taking the flow stress on re-loading, this procedure enabled isothermal stress-strain curves at fairly high stress-strain rates to be determined.
Model calibration is achieved by capturing images during neck formation. These images detail the geometric information necessary to characterise a material’s behav-iour. This unusual approach to tensile testing has made performing a size effect study particularly challenging.
The constitutive models currently assume that at a given strain, tensile specimens of the same material that only vary in scale, have the same ratio of neck diameter to radius of curvature. This led to a series of interrupted ten-sile tests that investigated this assumption and the effects of specimen size on mechanical properties. A preliminary analysis with mild steel specimens that differed by a scale factor of 10 was first to be performed (Fig. 4). After the 3.5 mm and 35 mm diameter samples were tested, a conclusion similar to the EN24T samples was reached, however more extensive interrupted tensile testing with a material more relevant to QinetiQ was preferable (Fig. 4). EN24T samples with diameters of 35 mm, 3.5 mm and 0.35 mm were tested and processed using the latest revi-sion of an image analysis program.
Fig. 4. 35 mm diameter EN24T (left) and mild steel (right) sample setups.
Fig. 5.0.35 mm diameter EN24T sample setup.
for the microtest so that round bar specimens could be tested (Fig. 5). To ensure success, calculations regarding the feasibility of testing the samples with the microtest rig in the scanning electron microscope were completed.
3.4 Image acquisition and analysis
To determine the radius of curvature values for necking tensile specimens at multiple interruptions the samples were either removed from the machine, photographed and then replaced (3.5 mm diameter specimens) or pho-tographed in-situ (35 mm and 0.35 mm diameter speci-mens). Osculating circles were then manually fitted to the images using Photoshop. It was only after gaining calibration experience that key improvements were made. Rather than recording measurements based primarily on the judgement of the person fitting the images, a MATLAB program capable of manipulating the images and determin-ing the neck radii through a series of numerical differential equations was generated.
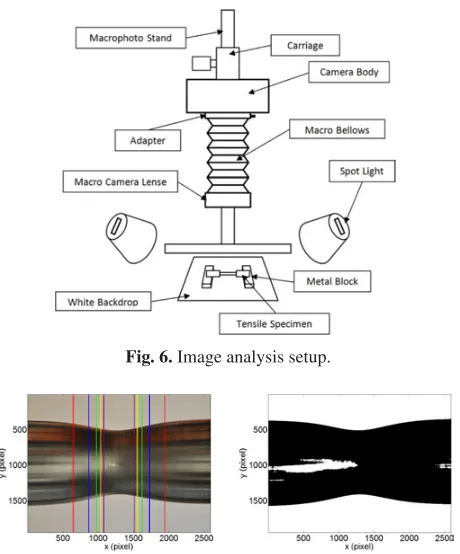
The images at the 3.5 mm diameter specimen scale were captured using a digital single lens reflex camera, a set of macro bellows and a macro photo stand. Used in conjunction with a white backdrop, two spot lights and two metal blocks to raise the sample, images of a reasonable quality were achieved (Fig. 6).
When the onset of necking became visible the camera was focused on the edge of the specimen’s neck. High-resolution images were then captured whilst the tensile test had been interrupted. During the tensile tests the focus and lighting conditions were not altered. This meant inconsistent image scaling and processing complications during analysis were avoided. As previously mentioned, Photoshop and then an edge detection program were used
Fig. 6.Image analysis setup.
Fig. 7.Boundary configuration and image manipulation.
to determine the radius of curvature values of the necks at various tensile test interruptions.
The aforementioned MATLAB program is capable of analysing all jpeg image files that are in the same directory as the program code. The only requirement is that the tensile specimen is horizontal and the neck is central in each of the images as shown in Fig. 7.
After each colour image is read, the MATLAB code outputs the file name and applies a user defined threshold to generate a black and white image. Numerous filters can be applied to the binary image and the suitability of the threshold assessed by the user (Fig. 7). The aim of the operator at this stage is to avoid significant specimen edge degradation. This can be achieved by eliminating pixel clusters away from the specimen edges, so that the regions of interest are representative of the actual geometry. This is made possible by selecting an appropriate threshold value before continuing. Points on the edges of the tensile specimen are then sampled at regular, specified intervals across the width of the image. The program allows the user to select either the whole, central half, central third, central quartile, central fifth or central sixth of the image for analysis. To ease the selection process and ensure the area of interest is captured, an image plot is marked with the corresponding boundaries (Fig. 7).
The edges are then determined by scanning each col-umn, starting at the top of the image, and registering the position at which the pixel colour changes. Both curves are found by rotating the image 180 degrees. A least squares 4thorder polynomial fit is then applied to the points sampled. Using the program’s output, the suitability of the fits can be assessed.
Fig. 8.Derivative output.
Fig. 9.35 mm diameter EN24T sample neck evolution.
curvature of the bottom and top curves. Numerous plots to better assess the reliability of the results are also generated and saved.
To find the radius of curvature of the bottom and top curves, the positions where the third derivatives are zero are found. This allows the second derivatives at those positions to be calculated. In conjunction with Eq. (8), the radius of curvature (R) of the two curves can then be determined and averaged. The derivatives of the curves are found using a central difference approach.
R=1+(dy/dx)23/2/(d2y/dx2) (8) The radius of curvature values are scaled using the minimum neck diameter determined both numerically and physically using digital callipers; the latter must be entered by the user for each of the images. The final output of the program is a data set that contains all of the neck radii information in the same units as the measurements recorded by the user. The evolution of the neck with true plastic strain can then be plotted as shown in Fig. 9. Also outputted is the threshold and boundary configurations used for each of the images.
Whilst the MATLAB program appears capable of cal-culating reliable, accurate results, the quality of the images being analysed could be improved. Only slight changes to either the threshold applied to the image or the initial interval size can alter the average radius of curvature. As a result, an alternative approach that reduces the noise of the tensile specimen’s edge has been considered.
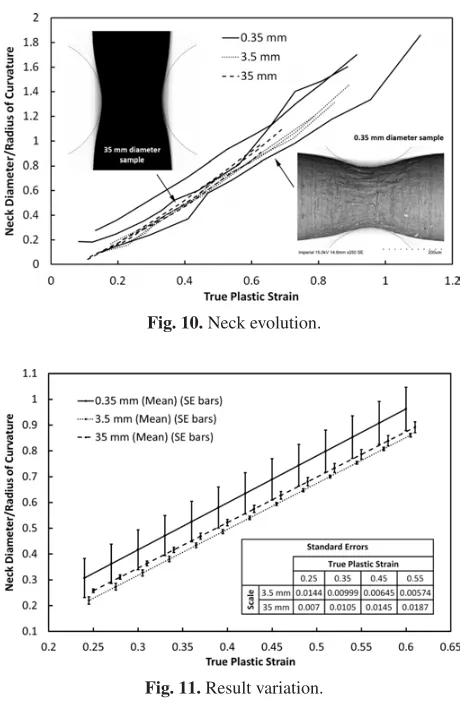
Fig. 10.Neck evolution.
Fig. 11.Result variation.
Future interrupted tensile tests will use a bespoke rotating image analysis rig to achieve accurate and repeat-able results and explore neck isotropy assumptions. The concept features a single backlight to illuminate the sample and is supported by an aluminium profile framework and a turntable. Unlike spot lighting, the evenly distributed light allows high contrast silhouette images to be produced. The turntable allows a frame-mounted camera to be rotated about the axis of the specimen so that backlit illuminated contour images can be captured and analysed from many different angles. Another key design element is the ability to perform in-situ image capture at the 3.5 mm diameter specimen scale. This reduces the total duration of the test and also avoids the inherent systematic errors associated with removal and replacement. The difficulties associated with initially positioning the rig become insignificant when the improvements in process efficiency and result quality are considered.
4 Results and discussion
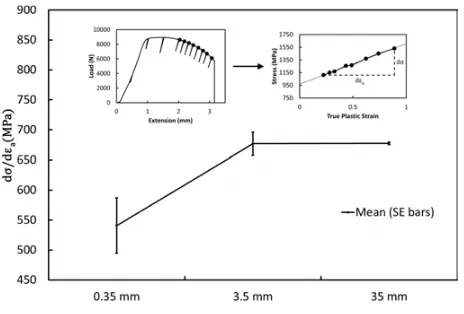
Fig. 12.Gradient of stress with strain.
evolves are in relatively good agreement. This is most clear between the 3.5 mm and 35 mm diameter samples however accounting for the result scatter of the 0.35 mm diameter samples this conclusion is consistent across the range.
Figure 10 details neck evolution for 0.35 mm, 3.5 mm and 35 mm diameter samples. Each specimen scale was repeated three times allowing an average to be determined. By plotting the average trendline and the associated stan-dard errors for each specimen scale (Fig. 11), the variation in the results can be analysed.
Figure 11 shows that the 0.35 mm diameter samples have the greatest standard errors followed by the 35 mm diameter samples and then the 3.5 mm diameter samples. Whilst the smallest scale samples display standard errors that differ little with true plastic strain, the 35 mm diameter samples show a gradual increase in standard error as the true plastic strain increases. The reverse of this relationship can be seen with the 3.5 mm diameter samples suggesting that the most accurate characterisation method requires multi-scale interrupted tensile testing.
A parameter also key to constitutive model calibration is the gradient of stress with strain (dσ/d˙εa). This is determined from load-extension data and neck diameter measurements. Figure 12 shows that the average gradient significantly drops for the smallest scale specimens whilst the 3.5 mm and 35 mm diameter samples yield similar gradient values. The plot also highlights that as the speci-men size increases the standard error in the gradient value reduces.
5 Conclusions
After machining and performing interrupted tensile tests on EN24T samples with diameters ranging from 0.35 mm to 35 mm diameter it was found that the geometric prop-erties of a neck do not significantly alter with true plastic strain. Regarding the ratio of neck diameter to radius of curvature, the 35 mm diameter samples offered the greatest accuracy at low strains whilst the 3.5 mm diameter samples had the smallest standard errors at high strains. Both scales outperformed the 0.35 mm diameter scale, which exhibited consistently large standard errors with true plastic strain. The average gradient of stress with strain for 0.35 mm diameter samples was also found to be significantly lower than the two remaining scales. It was recognised that the standard error in this gradient parameter reduced as the sample size increased.
References
1. P.W. Bridgman, Studies in Large Plastic Flow and Fracture, Harvard University Press (1952)
2. B.D. Goldthorpe, P.D. Church, The Effect of Algorithm Form on Deformation and Instability in Tension, J. Phys. IV,07:C3-753 (1997)
3. B.D. Goldthorpe, Constitutive Equations for Annealed and Explosively Shocked Iron for Application to High Strain Rates and Large Strains, J. Phys. IV,01:C3-829 (1991)
4. I.G. Cullis, P.D. Church, R. Townsley, P. Greenwood, W.G. Proud, Application of Goldthorpe PDF Model to Dynamic Fracture, J. Phys. IV, 134:443-448, 2006 (1991)
5. J.R. Rice, D.M. Tracey, On the Ductile Enlargement of Voids in Triaxial Stress Fields, J. Mech. Phys. Solids (1969)