Compressed Image Optimization Using
Intelligent Water Drop Algorithm
Gurveen Kaur1, Er. Mandeep Singh Sandhu2
P.G. Student, Department of Computer Engineering, BMS Engineering College, Sri Muktsar Sahib, India1
Associate Professor, Department of Computer Engineering, BMS Engineering College, Sri Muktsar Sahib, India2
Abstract
Image compression involves reducing the size of image data files, while retaining necessary information .The resulting file is called the compressed file and is used to reconstruct the image, resulting in the decompressed image. Here first problem is to study the JPEG image compression and need to compare the results in terms of PSNR, MSE, and Compression Ratio with the implementation of JPEG Compression using intelligent water drop optimization algorithm. IWD based JPEG Compression is a new technique and we expect the results of compression to be far better in comparison to the existing technique. The purpose of work is to enhance the results for the lossy image and to compare the values of the previous implemented results with the new implemented technique.
Keywords: Image Compression, Co-relation, Lossy, Lossless, IWD, JPEG, MSE.
1. INTRODUCTION
1.1 IMAGE COMPRESSIONWith the advance of the information age the need for mass information storage and fast communication links grows. Storing images in less memory leads to a direct reduction in storage cost and faster data transmissions. Image compression involves reducing the size of image data files, while retaining necessary information .The resulting file is called the compressed file and is used to reconstruct the image, resulting in the decompressed image.
Image Compression is one of the most useful and commercially successful technologies in the field of digital image processing. The number of images that are compressed and decompressed daily is staggering, and the compressions and decompressions themselves are virtually invisible to the user.
Image compression is a process intended to yield a compact representation of an image, thereby reducing the image storage/transmission requirements. The goal of image compression is to reduce the image file size without affecting the quality of an image.
1.2 NEED OF COMPRESSION
In a raw state, image can occupy a large amount of memory both in RAM and in storage. Image compression reduces the storage space required by an Image and the
bandwidth needed when streaming that image across a network.
1.3 BENEFITS OF COMPRESSION
• It provides a potential cost savings associated with sending less data over switched telephone network where cost of call is really usually based upon its duration.
• It not only reduces storage requirements but also overall execution time.
• It also reduces the probability of transmission errors since fewer bits are transferred.
• It also provides a level of security against illicit monitoring.
1.4 IMAGE COMPRESSION TECHNIQUES
The image compression techniques are broadly classified into two categories depending whether or not an exact replica of the original image could be reconstructed using the compressed image. These are:
1. Lossless technique 2. Lossy technique
In Lossless technique, the reconstructed image, after compression, is same to the original image.
Run Length Encoding: Run length encoding is one of the simplest image compression techniques. It consists of replacing a sequence (run) of identical symbols by a pair containing the symbol and run length.
Huffman Encoding: Huffman coding is based on the frequency of occurrence of a data item. The principle is to use a lower number of bits to encode the data that occurs more frequently. Codes are stored in a code book. This may be constructed for each image or a set of images. In all cases the code book plus encoded data must be transmitted to enable decoding.
Arithmetic Coding: In this technique, instead of coding each symbol separately, whole image sequence is codes with a single code. Thus, the correlation on neighboring pixels is exploited.
initialized with the 256 values of the ASCII table. The file to be compressed is split into string of bytes, each of these strings is compared with the dictionary and is added, if not found there. In encoding process, the algorithm goes over the stream of information, coding it; is a string is never smaller than the longest word in the dictionary then it is transmitted. In decoding Process, the algorithm rebuilds the dictionary in the opposite direction; it thus does not need to be stored.
Predictive Coding: Predictive coding technique another example of exploration of inter-pixel redundancy, in which the basic idea to encode only the new information in each pixel. This new information is usually defined as the difference between the actual and the predicted value of the pixel. The predictor’s output is rounded to the nearest integer and compared with the actual pixel value: the difference between the two called prediction errors.
In lossy technique, the reconstructed image, after compression is not same as the original image…
Transform Coding: Transform coding algorithm usually start by partitioning the original image into sub images of small size. For each block the transform coefficients are calculated, effectively converting the original 8×8 array of pixel values into an array of coefficients closer to the top left corner usually contain most o the information needed to quantize and encode the image. The resulting coefficients are then quantized and the output of the quantizer is used by a symbol encoding technique to produce the output bit stream representing the encoding image. At the decoder’s side, the reverse process takes place, with the obvious difference that the ‘dequantization’ stage will only generate an approximated version of the original coefficient values.
Block Truncation Coding: Block truncation coding is a technique for grayscale images. It divide the original images into blocks and then uses a quantizer to reduce the number of grey levels in each block while maintaining the same mean and standard d`eviation.
Sub-band Coding: The fundamental concept behind Sub-band Coding is to split up the frequency band of a signal and then to code each sub-band using a coder and bit rate accurately matched to the statistics of the band.
Vector Quantization: Vector quantization technique extends the basic principles of scalar quantization to multiple dimensions. This technique is to develop a dictionary of fixed size vectors, called code vectors. A given image is then partitioned into non overlapping blocks called image vectors. Then for each image vector, the closet matching vector in the dictionary is
determined and its index in the dictionary is used as the encoding of the original image.
Fractal Compression: The fractal compression technique relies on the act that in certain images, parts of the image resemble other parts of the same image. Fractal algorithm converts these parts, or more precisely, geometric shapes into mathematical data called “fractal codes” which are used to recreate the encoded image. Once an image has been converted into fractal code its relationship to a specific resolution has been lost; it becomes resolution independent. The image can be recreated to fill any screen size without the introduction of image artifacts or loss of sharpness that occurs in pixel based compression schemes.
2.
METHODOLOGY
The first step in the proposed work is to select the image of a particular format. There are different format of images available e.g. Jpeg, bmp, tiff, gif etc. But the image is considered on the proposed work is bmp image. After the selection of image that image is validated. The metadata in the image is selected and compressed in jpeg format. Then it is optimized using IWD algorithm. IWD algorithm is implemented for optimization process. Intrinsically, the IWD algorithm can be used for combinatorial optimization and in the last the image is sent to archive.
Figure 2.1 Flow Diagram of Proposed Work
ALGORITHM
The pseudo-code of an IWD-based algorithm may be specified in eight steps:
Step 1: Static parameter initialization
• Problem representation in the form of a graph
• Setting values for static parameters
Step 2: Dynamic parameter initialization: soil and velocity of IWDs
Step 3: Distribution of IWDs on the problem’s graph Validation
Compress metadata using JPEG
Compress image data using IWD
Step 4: Solution construction by IWDs along with soil and velocity updating
• Local soil updating on the graph.
• Soil and velocity updating on the IWDs
Step 5: Local search over each IWD’s solution (optional) Step 6: Global soil updating
Step 7: Total-best solution updating
Step 8: Go to step 2 unless termination condition is satisfied
3.Experimental Result
In the proposed work lossless compression has been used for image compression. In the development of proposed work various tools have to be used for achieving desired objectives. In the proposed work MATALB simulator has been used for image compression. MATLAB is tool that inscribed various tools and functions that can be used for image operations.
PEAK SIGNAL-TO-NOISE RATIO
The term peak signal-to-noise ratio (PSNR) is an
expression for the ratio between the maximum possible value of a signal and the power of distorting noise that affects the quality of its representation. Because many signals have a very wide dynamic range, (ratio between the largest and smallest possible values of a changeable quantity) the PSNR is usually expressed in terms of the
logarithmic decibel scale. Although a higher PSNR
generally indicates that the reconstruction is of higher quality, in some cases it may not.
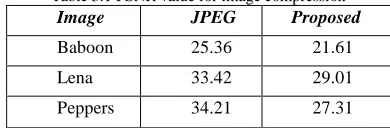
For the comparison of results tables of each parameter is drawn separately. The first comparison is of the results of PSNR values of JPEG compression with the proposed method.
Table 3.1 PSNR value for image compression Image JPEG Proposed
Baboon 25.36 21.61
Lena 33.42 29.01
Peppers 34.21 27.31
This table represents value of PSNR for different images. Peak signal noise ratio provides Information of distortion occurred in the image after compression.
This figure represents graphical representation of PSNR for different images using different compression approaches.
0 50
Va
lu
es
in
D
B
Images
PSNR
JPEG Proposed
Figure 3.1 Graph of PSNR using different image compression approaches
MEAN SQUARED ERROR (MSE)
Mean squared error (MSE) of an estimator measures the
average of the squares of the "errors", that is, the difference between the estimator and what is estimated.
MSE is a risk function, corresponding to the expected
value of the squared error loss or quadratic loss. The
difference occurs because of randomness or because the
estimator doesn't account for information that could
produce a more accurate estimate.
Table 3.2 MSE value for image compression
Image JPEG Proposed
Baboon 264.67 254.70
Lena 264.99 254.98
Peppers 259.35 250.54
Table 3.2 represents values of MSE for different images. MSE provide information of distortion occurred in the image after compression.
Figure 3.2 Graph of MSE using different image compression approaches
This Figure 3.2 represents graphical representation of MSE for different images using different compression approaches.
COMPRESSION RATIO
the reproduction. Sometimes the space savings is given instead, which is defined as the reduction in size relative to the uncompressed size: Space Saving=1- compressed size/ uncompressed size. Third parameter is compression ratio. The results of this parameter are given in the table 3.3
Table 3.3 Compression Ratio value for image compression
The above Table 3.3 represents value of compression ratio for different images.
0 10 20 30
Baboon Lena Peppers
Va
lu
es
Images
Compression Ratio
JPEG
Figure 3.3 Graph of compression ratio using different image compression approaches
This figure represents graphical representation of CR for different images using different compression approaches.
CORRELATION
Now the fourth parameter is correlation. The values of this parameter are given below in the Table3.4
Table 3.4 Correlation value for image compression
Image JPEG Proposed Baboon 0.86 0.88 Lena 0.89 0.98 Peppers 0.89 0.98
-This table represents value of correlation for different images. Correlation provides information of interdependence and association occurred in the image after compression.
0.8 0.9 1
Baboon Lena Peppers
Va
lu
es
Images
Correlation
JPEG
Figure 3.4 Graph of correlation using different compression approaches
This figure represents graphical representation of correlation for different images using different compression approaches.
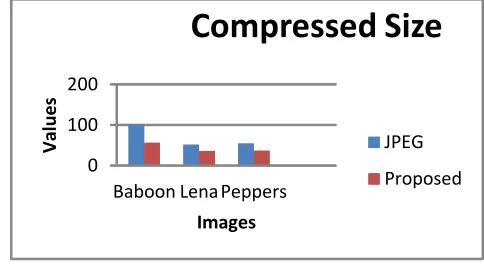
COMPRESSED SIZE
In the final section the values of compressed size of JPEG compression with the proposed method and the values of this comparison are given in the Table 5.6
Table 3.5 Compressed size value for image compression
Image JPEG Proposed
Baboon 101.27 56.08
Lena 51.69 36.11
Peppers 54.45 36.46
This table represents value of compressed size for different images. Compressed size means the reduced size of image that is memory requirement for the storage of image after compression.
Figure 3.5 Graph of compressed size using different image compression approaches
This figure represents graphical representation of correlation for different images using different compression approaches
Table 3.6 Parameters for image compression
Image JPEG Proposed
Baboon 7.58 13.69
Lena 14.85 21.26
Peppers 14.10 21.06
Ima ge
Orig inal Size
Compres sed Size
Compre ssion Ratio
PS N R
MSE Correlat ion
JPEG COMPRESSION
Bab oon
768. 053
101.27 7.58 5.3
6 264. 67
0.86
Len a
768. 053
51.69 14.85 3.4
2 264. 99
0.89
Pep pers
768. 053
54.45 14.10 4.2
1 259. 35
0.89
PROPOSED METHOD
Bab oon
768. 053
56.08 13.69 1.6
1 254. 70
0.88
Len a
768. 053
36.11 21.26 9.1
0 254. 98
0.98
Pep pers
768. 053
36.46 21.06 7.3
1 250. 54
0.98
0 100 200
Baboon LenaPeppers
Va
lu
es
Images
Compressed Size
The above table represents values of different parameters that have been computed for performance evaluation of proposed work. These parameters are compression ratio, PSNR, MSE and correlation.
CONCLUSION& FUTURE SCOPE
Image Compression, the art and science of reducing the amount of data required to represent an image is one of the most useful and commercially successful technologies in the field of digital image processing. In the image compression image can be compressed by using loss less compression approach as well as lossy compression ratio. The difference between lossless and lossy compression is that in lossless compression information loss in the image is less as compare to information loss in lossy compression but lossy compression achieves much higher compression ratio than that of the loss-less compression approach. IWD is nature inspired algorithm that optimizes the results of the image compression using JPEG compression approach. In the JPEG compression various algorithm has been used for reduction of size of the image. These algorithms perform various operations to reduce size of the image that are DCT. DCR divides the image into small different blocks of size M*M. these blocks has been undergoes the processing of image compression using RLE and Huffman coding. These approaches are implemented in sequential way such that image size get reduces and effect only comes to the luminance of the image that cannot be easily predicted by naked eyes. After implementation of JPEG compression to all the components of the RGB image undergoes optimization process that has been done by using IWD approach. This considers neighbor pixel values for compression to be effective. All pixels fitness is evaluated for a single block. The pixels that are less effective in the image are removed from the image data that does not affect image quality and reduces the size of the image. In the proposed work various parameter have been evaluated for performance evaluation of proposed work. Compression ratio, Peak signal to Noise ratio, Mean Square Error and correlation has been computed for proposed work. On the basis of these parameters one can conclude that proposed work provides much better results than previous approaches used for image compression. For future work better results of PSNR and MSE can be generated by changing algorithm and technique for bmp, JPEG and other image formats.
REFRENCES
[1] Talukder, H, K., and Harada, K. (2007) “Haar Wavelet Based Approach for Image Compression and Quality Assessment of Compressed Image,” International Journal of Applied Mathematics, vol.36, pp.1-8.
[2] Amar, Ben, C., and Jemai, O. (2007) “Wavelet Networks Approach for Image Compression,” ICGST International
Journal on Graphics, Vision and Image Processing, pp. 37-45.
[3] A, Khashman., and K, Dimililer. (2008) “Image Compression using Neural Networks and Haar Wavelet,” WSEAS Trans Signal Processing vol.4, pp. 330-339. [4] Senthilkumaran, N., and Suguna, J (2011) “Neural Network
Techniques for Lossless Image Compression using X-ray Images,” International Journal of Computer and Electrical Engineering, vol.3, no.1..
[5] Kuther, Abood., Hayder., Aboud and Falih, H. A (2012) “X-ray image compression using neural network,” ISSN 2229-5518,vol.3, Issue 10..
[6] M, Sindhu., and R, Rajkamal. (2009) “Images and Its Compression Techniques,” International Journal of Recent Trends in Engineering, vol.2, no. 4.
[7] Bhardwaj, Anuj. and Ali, Rashid (2009) “Image Compression Using Modified Fast Haar Wavelet Transform,” ISSN 1818-4952, vol.7, no.5.
[8] S,K,Tiwari,Shamik. and Shukla (2012) “Wavelet based Multi Class image classification using Neural Network,” International Journal of Computer Applications, vol.37, no.4.
[9] Mhd, Nagaria, Baluram., Hashmi, Farukh., and Dhakad, Pradeep., (2011) “Comparative Analysis of Fast Transform for Image Compression for optimal Image Quality and Higher Compression Ratio,” International Journal of Engineering Science and Technology (IJEST), vol.3, no.5. [10] Sivanandam, N, S., Sumathi, S., and Deepa, N, S., (2012)
“Introduction to Neural Networks using Matlab 6.0,” McGraw Hill.
[11] T. Meyyappan, SM.Thamarai and N.M.Jeya Nachiaban, (2011) “Lossless Digital Image Compression Method For Bitmap Images” Conf. on The International Journal of Multimedia & Its Applications (IJMA) Vol.3 , pp-83-92. [12] A, M, Raid, W, M, Khedr, (2014) “Jpeg Image
Compression Using Discrete Cosine Transform - A Survey” Conf. on International Journal of Computer Science & Engineering Survey (IJCSES) Vol.5, pp. 39-47.
[13] C, Ben, Amar and O, Jemai (2007) “Wavelet Networks Approach for Image Compression” ICGST Conf. on GVIP Special Issue on Image Compression, pp.15-23.
[14] Baluram, Nagaria, Mhd, Farukh, hashmi (2014) “Comparative Analysis of Fast Wavelet Transform for Image Compression for optimal Image Quality and Higher Compression Ratio” ISSN Conf. on International Journal of Engineering Science and Technology (IJEST), pp. 4014-4019.