Effect of weather conditions on the Hybrid solar PV/T Collector in variation of Voltage
and Current
872
Effect of weather conditions on the Hybrid solar
PV/T Collector in variation of Voltage and Current
Uzma Qureshi, Prashant Baredar, Anil Kumar
Energy Centre, Department of Mechanical Engineering Maulana Azad National Institute of Technology, Bhopal, India Corresponding Author1: Uzma Qureshi: uzmarose162@gmail.com
Abstract
A laboratory scale hybrid solar air collector has been developed and tested for unload conditions at the Maulana Azad National Institute of Technology, Bhopal, India. The collector has been tested under two weather conditions firstly in clear sky and secondly in cloudy and partly hazy. The cell temperature in the clear sky conditions is found to higher than other weather conditions. The reduction in cell temperature in cloudy and partly hazy weather condition vary from 4.4-15.2 0C as
compared to the clear sky conditions. Experimental result reveals that there is a slight increase in the voltage and current in cloudy and partly hazy weather conditions as compared to clear sky conditions due to low ambient temperature.
Keywords: hybrid solar air collector, cell temperature, voltage, current
1. Introduction
Photovoltaic technology (PV) provides a direct method to convert solar energy into electricity. In recent years, the use of PV systems has increased greatly with many applications of PV devices in systems as small as battery chargers to large scale electricity generation systems and satellite power systems. Commercially available PV modules convert around 13–20% of incident solar radiation into electricity. The remaining solar energy absorbed into the panel is converted to heat and increases the panel temperature. This increase in temperature causes the development of thermal stresses in the panel and also causes the module efficiency to decrease [1]. To reduce the panel temperature, cooling of the PV panels is usually done which improves the electrical performance of
the module and reduces the thermal stresses developing in the module.
Several types of thermal models have been developed for calculating the temperature of PV cells as a function of solar radiation and the environmental conditions. These include models for PV panels without cooling [2–4] as well as with cooling [5–10]. For PV module cooling two different approaches have been adopted. Either custom-made photovoltaic–thermal (PV/T) collectors are developed with the objective of PV module cooling and collecting hot water or air or commercially available PV modules are cooled using auxiliary thermal collectors attached to the back surface of the module.
Effect of weather conditions on the Hybrid solar PV/T Collector in variation of Voltage
and Current
873
and the PV cell temperature and their model required experimental data for estimating the model parameters. For electrical performance prediction, they used an equivalent electric circuit model. For a commercially available PV module cooled by auxiliary thermal collectors, a relatively smaller amount of work has been reported. In one work, Teo et al. [9] designed an air cooled PV/T system using a commercially available PV panel and a custom made air collector attached to it. They developed a one-dimensional thermal model for their PV/T collector and used it to analyze its performance. In a previous work done by the authors, they developed a three-dimensional thermal model for commercial PV modules cooled using an auxiliary thermal collector. They used the model to carry out parametric studies to see the effect of various environmental and operating parameters include the contact resistance between the PV module and thermal collector on the electrical and thermal performance of the PV module [10].
For modeling the electrical performance of PV modules, various electrical models have been developed. These include models based on the analytical knowledge of PV cell behavior, models based on empirical correlations, as well as models, which combine the two approaches. King et al. [3] developed an empirical model for simulation of PV systems called the Sandia Labs PV Model. Hishikawa et al. [12] and Marion et al. [13] used current–voltage curve interpolation for estimating the module electrical performance.
Another approach adapted for PV electrical performance prediction was to represent the PV device by an equivalent electric circuit in which five model parameters represent the specific characteristics of a PV device. The model parameters can be modified for different input conditions and the model can then be solved to find the PV electrical characteristics [14–16]. The inputs to the electrical model are the absorbed solar radiation in the PV cells and the PV cells temperature. An improvement to the five parameters model, the seven parameters model, was suggested by the authors [17] in which the equations to modify the model parameters were adjusted to improve the
Effect of weather conditions on the Hybrid solar PV/T Collector in variation of Voltage
and Current
874
distribution inside the PV module as well as its electrical power output and electrical efficiency. The three-dimensional thermal model, developed in CFD environment, allows the use of complex thermal collector geometries which cannot be modelled by one-dimensional analytical models. For the electrical performance prediction, the improved seven parameters model is used. Moreover, a scheme to incorporate the electrical model effects in the CFD model is also presented. The developed model was applied for simulating the performance of a commercially available PV module for four different days representing different temperatures and cloud conditions at Jeddah, Saudi Arabia.
2 Mechanics and material
The photograph of the hybrid solar PV/T collector is shown in Fig. 1. The orientation of hybrid solar PV/T collector was kept in the east-west during experiment to extract maximum advantage of incident solar radiation. The PV/T collector is inclined with 23o.
Fig 1: Photograph of the Experimental set up
2.2 Instrumentation
The solar radiation measured on the inclined surface of the PV/T collector with the help of TM 207
model solar power meter manufactured by Tenmars, Taiwan having experimenting accuracy ±10 W/m2
and measuring range of 0–2,000 W/m2. Calibrated
digital hygrometer ofAM-3003 model manufactured by Lutron, Taiwan probe type is used to measure the temperature and relative humidity at inside, outlet of greenhouse and ambient conditions. The measuring accuracy and range for measurement of relative humidity are ±3 and 10–95 %; ±0.8 and 0–50 0C are
the measuring. Ground temperature was recorded with the help of MT Raytek infrared thermometer non-contact gun type having accuracy and precision ±2 % and 0.2 0C respectively. Air speed is measured
with the help of hot-wire 490 Testo anemometer probe having resolution and range are 0.1 and 0.2– 60 m/s respectively.
2.3 Experimentation
The experiments were conducted in no-load condition on 14-15 June 2014 on the site of Maulana Azad National Institute of Technology (Bhopal, India) located at 23.15 0N latitude, 77.25 0E
longitude and 500 m altitude. Experiments were conducted only during the day time hours from 10 a.m. to 5 p.m.
Result and Discussion
After construction of the hybrid solar air collector, it was tested. The analysis was carried out such as solar radiation intensity, relative humidity, wind velocity, ambient temperature and cell temperature. First day (Day 1) of experimentation was found to be the clear sky conditions and on second day (Day 2), the weather was hazy and partly cloudy condition. The variation of these five parameters were observed hourly basis during experimentation and it is presented in Fig 2-6. Fig. 2 depicts the variation of solar radiation with respect to time. It shows that the maximum solar intensity was 915 and 640 W/m2 for day 1 and day 2 of experimentation
Effect of weather conditions on the Hybrid solar PV/T Collector in variation of Voltage
and Current
875
Fig 2: Variation of Solar radiation
Fig 3 shows the variation of ambient temperature on the both day of experimentation. On the day of clear sky, which is day 1 is found to be always greater temperature than cloudy and hazy weather
conditions. The average ambient temperature on day 1 is 43.85 0C and 35.72 0C for day 2
respectively.
Fig 3: Variation of Ambient Temperature
Fig 4 shows the variation of ambient relative humidity of day 1 and day 2 respectively. The average ambient relative humidity is 20.95 % for
day 1 and 35.58 % for day 2 respectively. It is found that day 2 have higher ambient relative humidity as compared to day 1 of the experimentation.
0 200 400 600 800 1000
10 11 12 13 14 15 16 17
S
o
la
r
R
a
d
ia
ti
o
n
(
W
/m
2)
Experimentation (Hrs)
Day 1
Day 2
0 10 20 30 40 50
10 11 12 13 14 15 16 17
A
m
b
ie
n
t
T
e
m
p
e
ra
tu
re
(
0C
)
Experimentation (Hrs)
Day 1
Effect of weather conditions on the Hybrid solar PV/T Collector in variation of Voltage
and Current
876
Fig. 4 Variation of ambient relative humidity
Fig 5 demonstrates the variation of ambient wind velocity. It is observed that day 2 of
experiementation having higher wind velocity as
compared to day 1. The range of wind velocity on day 1 is 0.51-2.1 m/s for day 1 and 1.71-2.44 m/s for day 2 respectively
.
Fig 5 Variation of ambient wind velocity
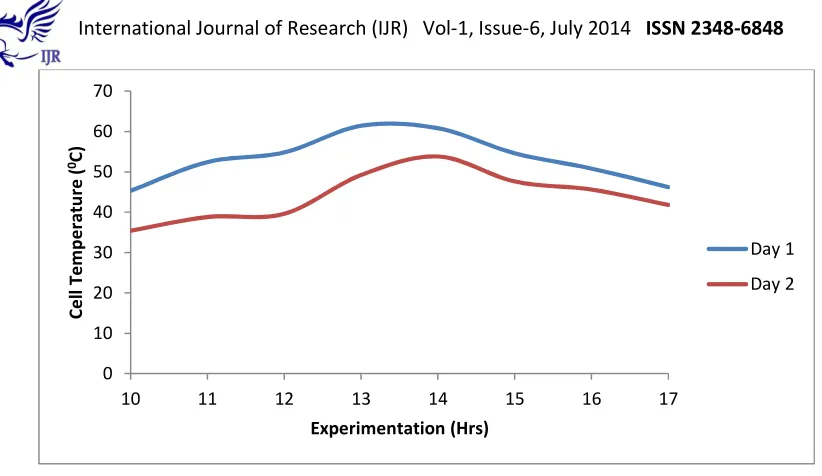
Fig 6 shows the variation of the cell temperature of the hybrid solar air collector. Due to clear sky conditions on day 1, cell temperature is always found to be the higher than the day 2. The higher
cell temperature decreases the efficiency of the solar panel. The variation of cell temperature on day 1 is 45.3-61.4 0C for day 1 and 35.4-53.8 0C for day 2
respectively.
0 10 20 30 40 50 60
10 11 12 13 14 15 16 17
A
m
b
ie
n
t
R
e
la
ti
v
e
H
u
m
id
it
y
(
%
)
Experiementation (Hrs)
Day 1
Day 2
0 0.5 1 1.5 2 2.5 3
10 11 12 13 14 15 16 17
W
in
d
V
e
lo
ci
ty
(
m
/s
)
Experimentation (Hrs)
Day 1
Effect of weather conditions on the Hybrid solar PV/T Collector in variation of Voltage
and Current
877
Fig 6 Variation of cell temperature
Fig 7 shows the variation of the open circuit voltage of the hybrid solar PV/T collector. It is found to be almost constant on the both day of experimentation.
The average voltage on day 1 was 18.89 V and 19..23 on day 2 of the experimentation respectively.
Fig 7 variation of Voltage
Fig 8 illustrate the variation of current during experimentation. On day 1, it vary from 1.86-2.12 A and on day 2 it vary from 1.92-2.34 A
0 10 20 30 40 50 60 70
10 11 12 13 14 15 16 17
C
e
ll
T
e
m
p
e
ra
tu
re
(
0C
)
Experimentation (Hrs)
Day 1
Day 2
0 5 10 15 20 25
10 11 12 13 14 15 16 17
V
o
lt
a
g
e
(
V
)
Experimentation (Hrs)
Day 1
Effect of weather conditions on the Hybrid solar PV/T Collector in variation of Voltage
and Current
878
Fig 8 Variation of current
Conclusion
This study can be used to provide the design and testing data for this type of hybrid solar air collector in other locations of the world. Experimental result reveals that there is a slight increase in the voltage and current in cloudy and partly hazy weather conditions as compared to clear sky conditions due to low ambient temperature. In order to increase the efficiency of the collector, suitable modification can be applied in the collector to provide proper cooling.
References
[1] Skoplaki E, Palyvos JA. On the temperature dependence of photovoltaic module electrical performance: a review of efficiency/power correlations. Sol Energy 2009;83:614–24.
[2] Jones AD, Underwood CP. A thermal model for photovoltaic systems. Sol Energy 2001;70:349–59.
[3] King DL, Boyson WE, Kratochvil JA. Photovoltaic array performance model. Albuquerque, New Mexico: Sandia National Laboratories; 2004.
[4] Acciani G, Falcone O, Vergura S. Analysis of the thermal heating of poly-Si and a-Si photovoltaic cell by means of FEM. In: International conference on renewable energies and power quality; 2010.
[5] Tiwari A, Sodha MS. Performance evaluation of solar PV/T system: an experimental validation. Sol Energy 2006;80:751–9.
[6] Sarhaddi F, Farahat S, Ajam H, Behzadmehr A, Mahdavi Adeli M. An improved thermal and electrical model for a solar photovoltaic thermal (PV/T) air collector. Appl Energy 2010;87:2328–39.
[7] Amori KE, Taqi Al-Najjar HM. Analysis of thermal and electrical performance of a hybrid (PV/T) air based solar collector for Iraq. Appl Energy 2012;98:384–95.
[8] Amrizal N, Chemisana D, Rosell JI. Hybrid photovoltaic–thermal solar collectors dynamic modeling.Appl Energy 2013;101:797–807.
[9] Teo HG, Lee PS, Hawlader MNA. An active cooling system for photovoltaic modules. Appl Energy 2011;90:309–15.
[10] Usama Siddiqui M, Arif AFM, Kelley L, Dubowsky S. Three-dimensional thermal modeling of a photovoltaic module under varying conditions. Sol Energy 2012;86:2620–31.
[11] Huang BJ, Lin TH, Hung WC, Sun FS. Performance evaluation of solar photovoltaic/thermal systems. Sol Energy 2001;70:443–8.
[12] Hishikawa Y, Imura Y, Oshiro T. Irradiance-dependence and translation of the I–V
0 0.5 1 1.5 2 2.5
10 11 12 13 14 15 16 17
C
u
rr
e
n
t
(A
)
Experimentation (Hrs)
Day 1
Effect of weather conditions on the Hybrid solar PV/T Collector in variation of Voltage
and Current
879
characteristics of crystalline silicon solar cells. In: Photovoltaic Specialists Conference (PVSC), 2000 28th IEEE, 2000; p. 1464–7.
[13] Marion B, Rummel S, Anderberg A. Current– voltage curve translation by bilinear interpolation. Prog Photovoltaics Res Appl 2004;12:593–607.
[14] DeSoto W, Klein SA, Beckman WA. Improvement and validation of a model for photovoltaic array performance. Sol Energy 2006;80:78–88.
[15] Boyd MT, Klein SA, Reindl DT, Dougherty BP. Evaluation and validation of equivalent circuit photovoltaic solar cell performance models. J Sol Energy Eng 2011;133:021005.
[16] Villalva MG, Gazoli JR, Filho ER. Comprehensive approach to modeling and simulation of photovoltaic arrays. IEEE Trans Power Electron 2009;24:1198–208.
[17] Siddiqui MU. Multiphysics modeling of photovoltaic panels and arrays with auxiliary thermal collectors. King Fahd University of Petroleum & Minerals; 2011.
[18] Eitner U, Altermatt PP, Köntges M, Meyer R, Brendel R. A modeling approach to the optimization of interconnects for back contact cells by thermo mechanical simulations of photovoltaic modules. In: 23rd European photovoltaic solarenergy conference, Valencia, Spain, vol. 54; 2008. p. 258–60.
[19] Gonzalez M, Govaerts J, Labie R, De Wolf I, Baert K. Thermo-mechanical challenges of advanced solar cell modules. In: 12th international conference on thermal, mechanical and multiphysics simulation and experiments in microelectronics and microsystems, EuroSimE 2011; 2011. p. 1–7.
[20] Meuwissen M, Van Den Nieuwenhof M, Steijvers H. Simulation assisted design of a PV module incorporating electrically conductive adhesive interconnects. In: 21st European photovoltaic solar energy conference and exhibition, Dresden, Germany; 2006. p. 2485–90.
[21] Dietrich S, Pander M, Sander M, Schulze SH, Ebert M. Mechanical and thermo mechanical assessment of encapsulated solar cells by finite-element simulation. In: Dhere NG, Wohlgemuth JH, Lynn K, editors. Reliability of photovoltaic cells, modules, components, and systems III, vol. 7773, SPIE; 2010, p. 77730F1–10.
[22] Siddiqui MU, Arif AFM. Effect of changing atmospheric and operating conditions on the thermal stresses in PV modules. ESDA 2012 vol. 2, Nantes France. American Society of Mechanical Engineers; 2012, p. 729–40.