Article
Investigating Suspended-Sediment Transport in a
Shallow Lake Using a Three-Dimensional Model
Hong-Ming Liu1, Wen-Cheng Liu1,*, Chih-Yu Chiu2
1 De partment of Civil and Disaster Pre vention Engine ering, National Unite d Unive rsity, Miaoli 36063
Taiwan; [email protected] du.tw; [email protected]
2 Re search Ce nter for Biodive rsity, Academia Sinica, Taipe i 11529 Taiwan; [email protected]
* Corre spondence: [email protected] du.tw; Te l.: +886-37-382357
Abstract: A three-dimensional, unstructured grid, hydrodynamic and suspended-sediment transport model (i.e., SELFE-SED) was developed to simulate temporal and spatial variations of suspended sediment and was applied to the subtropical subalpine Tsuei-Feng Lake (TFL) of Taiwan. The model was validated with measured water level and suspended-sediment concentration in 2009, 2010, and 2011. The overall model simulation results are in quantitative agreement with the observational data. The validated model was then applied to explore the most important parameter that affects the suspended-sediment concentration and to investigate the effect of wind stress on the mean current and suspended-sediment distribution in this shallow lake. Modeling results of sensitivity analysis reveal that the settling velocity is a crucial parameter and erosion rate is less important in the suspended-sediment transport model. Remarkable lake circulation was found based on the strength of wind speed and wind direction. Strong wind would result in higher mean current in the top layer and suspended-sediment distribution in the top and bottom layers. This study demonstrated that the wind stress played a s ignificant influence on mean circulation and suspended-sediment transport in a shallow lake.
Keywords: Suspended sediment, Hydrodynamics, Numerical model, SELFE-SED, Wind-driven current, Tsuei-Feng Lake.
1. Introduction
Sediment has been identified as one of the important nonpoint source pollutants [1]. Sediment-water interactions in shallow lakes may become enormously important with time, since bed sediments constituent the ultimate repository for nutrients and contaminants, and fine particles and nutrients in the sediment bed may repeatedly be recycled [2,3]. Nutrient-rich sediment layers in the lakes participate in chemical and biological processes and exchange mass with in the water column. The s ediment layers affect the nutrient cycles via the diffusive fluxes of nutrients from sediment and via sediment resuspension [4-6]. The resuspension of toxic bottom sediments is an ecological concern, since toxic contaminants can accumulate in the biota and food web of a lake [7]. Suspended sediment can also reduce the light intensity under water and affect the growth of phytoplankton.
The dynamic processes involved in suspended-sediment transport such as flocculation, deposition, and erosion (resuspension) have been studied by many scientists [8-16]. A number of laboratory studies have improved our knowledge of t he resuspension behavior of fine-grained material. However, transferring the results of laboratory experiments to field studies still has been problematic because of the complexities of real sediments and of natural flows.
Sediment transport models have b een broadly developed and applied to investigate sediment dynamics in lakes including a one-dimensional model [17-19], a vertical two-dimensional model [20,21], a horizontal two-dimensional model [22-26], and quasi-three-dimensional [27] and three-dimensional models [28-32]. The erosion and resuspension of bottom sediment from the
active layers is one of the major sources of the total suspended sediment in the water column [33]. To accurately simulate the suspended-sediment concentration in lakes, incorporating resuspension and deposition into the suspended-sediment transport model is essential. However, three-dimensional models are particularly appropriate in cases such as regions with complex bathymetries, the vertical gradients in water temperature and suspended-sediment concentration, and density currents in the lakes.
Recent advances in computational fluid dynamics and sediment transport model formulations enable the computation of flows and sediment fluxes in three-dimensions. However, spatial and temporal scales, and model processes must be carefully selected for a particular study to ensure that the model will solve the problem at hand and that computations can be carried out in the practical sense. In the present study, a three-dimensional, unstructured-grid hydrodynamic and suspended-sediment transport models (i.e., SELFE-SED) were developed and applied to simulate the hydrodynamics and sediment dynamics in the Tsuei-Feng Lake. The model simulation was validated against profiles of water level, and time-variation and spatial-variation suspended solids from 2009 to 2011. The validated model then was applied to explore the most sensitive parameter affecting the suspended-sediment concentration and the influence of wind stress on mean currents and sediment dynamics.
2. Description of Study Area
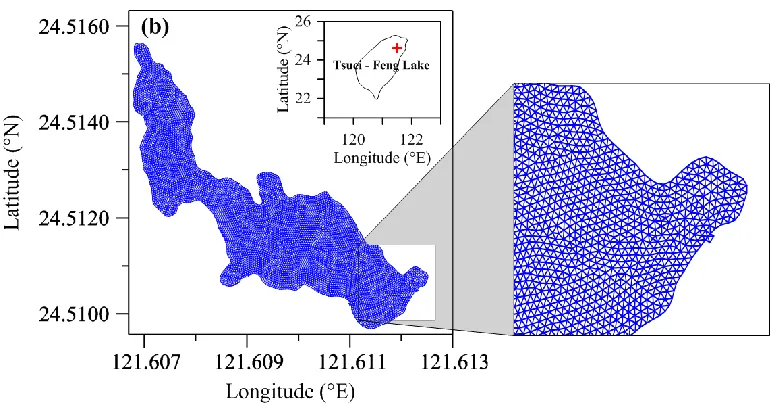
Tsuei-Feng Lake (TFL) is located between the Taiping Mountain and Dayuan Mountain in the north-central region of Taiwan (Figure 1a). The indicated altitude is 1,900 m above sea level. The area of the lake is approximately 20 ha. It is one of the largest mountain lakes in Taiwan. It is also the most popular focus in the Taipingshan National Forest Recreation Area.
Figure 1. (a) Map of Tsue i-Fe ng Lake (TFL) in the north-ce nte r re gion of Taiwan and (b) horizontal grid of TFL for three -dime nsional hydrodynamic and suspe nde d-se dime nt transport mode l. The grid size is approximate ly 5 m.
Figure 2. The spatial distribution of suspe nde d-se dime nt concentration on (a) June 6, 2010 and (b) De ce mber 11, 2010. The white color in the figure re pre sents the dry area (no wate r).
3. Materials and Methods
3.1. Hydrodynamic Model
Multi-scale lake circulation modeling has become a mature field. The models used typically describe the free-surface elevation, velocities, and water temperature of various water bodies by solving the Reynolds-averaged Navier–Stokes equations which represent conservation of mass, momentum, and water temperature subject to the hydrostatic and Boussinesq approximations. The equation of state describes water density as a function of water temperature. In this study, the three-dimensional, semi-implicit Eulerian-Lagrangian finite-element model [35] was implemented to simulate the hydrodynamics and hydrothermal characteristics in the Tsuei-Feng Lake.
with an Eulerian-Lagrangian method, allowing larger time steps without compromising computational stability and accuracy. For the advection terms in the transport equations (i.e., water temperature), the Eulerian-Lagrangian scheme is applied. When the Eulerian-Lagrangian scheme is used, the transport equations can be efficiently solved by a finite-element method. To calculate turbulent mixing processes, SELFE uses the generic length scale (GLS) turbulence closure of Umlauf and Burchard [36], which has the advantage of encompassing most of the 2.5-equation closure (
K
) model.3.2. Suspended-Sediment Transport Model
The suspended-sediment transport model is treated in two distinct models: the advection-diffusion components are based on the SELFE transport formulation, taking advantage of its numerical characteristics, such as the option to use different methods to solve the transport equation, while the remaining terms are computed based on the sediment transport formulation of a three-dimensional hydrodynamic-eutrophication model [37].
The suspended-sediment transport model was incorporated using the hydrodynamic model as a passive tracer under the same spatial and temporal resolutions. The governing equation for the total suspended-sediment concentration is as follows:
(
)
(
)
(
)
ss
w w C
C
uC
vC
C
F
t
x
y
z
z
z
(1)where
C
denotes suspended-sediment concentration,u
,v
andw
are the velocity components in thex
,y
andz
directions provided by SELFE, respectively,w
sis the settlingvelocity of the suspended sediment,
is the vertical eddy diffusivity andF
s representshorizontal diffusion.
At the water surface, there is no net transport across the free surface, and, therefore, diffusion flux always counterbalances the settling flux and the boundary condition
0 at
sC
w C
z
z
(2)where
is the free-surface elevation.At the sediment bed, the net sediment flux is equal to the summation of the sediment erosion flux and the sediment deposition flux.
at
sC
w C
D
E
z
h
z
(3)The erosion term
2 1
E kgm s is expressed according to the Partheniades [8] formulation, using the excess-bottom shear–stress concept:
1 for
0 for
b b ce ce b ce
M
E
(4)where
b is the bottom shear stress
2Nm ,
ce is the critical shear stress
2Nm for erosion,
and M is the erosion coefficient
2 1
kgm s . The deposition term
2 1
D kgm s is calculated following the Krone [9] formulation:
1
for
0 for
b
s b cd b
cd cd b
w C
D
(5)where
cd is the critical shear stress
Nm2
for deposition, andC
b is the near-bedstratification and gravitationally driven flow, the effects of suspended-sediment concentration on density have to be considered. Water density including the suspended sediment was computed as follows:
+ C 1
w w s
(6)where
w is the water density, which is determined by the equation of state, and
s is the suspended sediment density.3.3. Model Implementation
In this study, the bottom topography data in the TFL measured in 2008 were obtained from the Academia Sinica, Taiwan. The greatest depth of study area is 4.3 m where is close to the buoy station (Figure 1a). The unstructured model meshes for TFL consist of 11617 meshes/6058 nodes in the horizontal direction (Figure 1b). High-resolution unstructured meshes, which include a mesh size of approximately 5 m, were used for TFL. Model simulations were conducted using ten S-levels in the vertical direction. For this model mesh, a time step (t = 20 seconds) was used in simulations
to guarantee the numerical stability.
3.4. Indices of Model Performance
To evaluate the performance of the hydrodynamic and suspended-sediment concentration, two criteria were adopted to compare the predicted results and the observational data, which are the mean absolute error (MAE) and root mean square error (RMSE). MAE is the average of the absolute values of differences between the observed data and simulated values. RMSE basically specifies the overall difference in the sum of squares normalized to the number of observations. RMSE is similar to a standard error of the mean for the uncertainty of the model. These criteria are defined by the following equations:
N i i o i mY
Y
N
MAE
1)
(
)
(
1
(7)
N i i o i mY
Y
N
RMSE
1 2]
)
(
)
[(
1
(8)where
N
is the total number of data points and(
Y
m)
i and(
Y
o)
i are the values the ith datapoint, modeled and observed, respectively.
4. Model Validation
Simulation models are increasingly being used to solve problems and to aid in decision-making. To make sure of the model accuracy for further practical applications, the observational data is used to validate the model and to ascerta in its capability for predicting water level and suspended-sediment concentration [38].
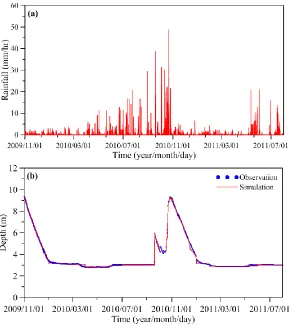
The observational data collected from November 2009 to July 2011 was used for model validation. To warm up the model, the spin-up time is specified as 15 days. Th e model was therefore was run from November 1, 2009 to July 31, 2011. The initial conditions for water level and suspended-sediment concentration are specified as 3.0 m and 13.0 mg/L, respectively, to start running the hydrodynamic and suspended-sediment transport model.
4.1. Water Level
elevation are 0.05 m and 0.15 m, respectively. It indicates that the simulated results mimic the observed water levels. Based on the model validation of water level, the roughness height used in the hydrodynamic model was adopted to be 0.01 m for the model simulation.
Figure 3. (a) Recorde d rainfall from Novembe r 1, 2009 to July 31, 2011 and (b) comparison of water le ve l be twe en model pre diction and observation.
4.2. Suspended-Sediment Modeling
Several parameters in the suspended-sediment transport model including the settling velocity (
w
s), critical stress for erosion (
ec), deposition (
dc), and empirical erosion rate (M
) are difficultto be determined in the lakes because they have a wide range of value to be adopted. The consolidation of the sediment bed affected by interactions with physical, biological, chemical, and the composition of sediment, is an important factor influencing these parameters [39-42]. In this study, the suspended-sediment transport model is implemented to confirm these parameters.
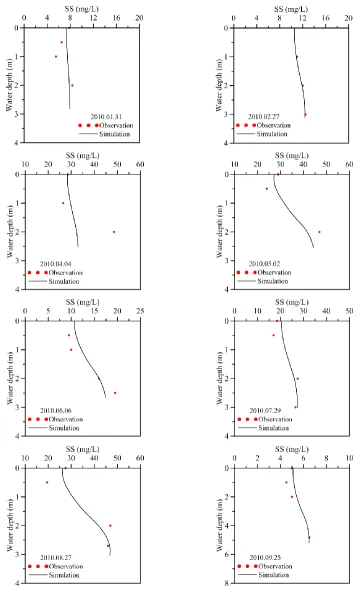
In order to validate the suspended-sediment concentration in the TFL, the monthly measured data collected from November 2009 to July 2011 was compared with the simulated results. The water sample was taken from different water depths to measure the concentration of suspended sediment. Concentrations of suspended sediment were determined using the drying method after filtering samples through GF/F filters [43]. The comparison of the simulated suspended-sediment concentration and the measured concentration taken as a vertical average at the buoy station is shown in Figure 4. It reveals that simulated results fairly match the measured suspended-sediment concentration. The MAE and RMSE values between the computed and measured suspended-sediment concentrations are 1.73 mg/L and 2.23 mg/L, respectively.
date from 2009 to 2011. It shows that the largest MAE and RMSE values are 6.41 mg/L and 9.54 mg/L, respectively, occurring on April 4, 2010.
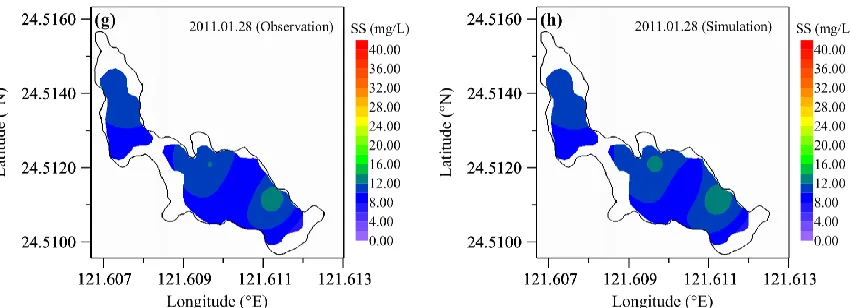
Figure 6 illustrates the comparison of the spatial distribution of the vertically averaged suspended-sediment concentration between simulated and observed results on April 4, July 29, November 6, 2010 and January 28, 2011. It can be seen that the simulated and observed suspended-sediment concentrations in their spatial distribution are quite similar. Through the model validation, the constant values of 1.0x10⁻³ m/s for settling velocity (
s
w
), 5.0x10⁻³ N/m2 forec
, 5.0x10⁻⁴ N/m2 fordc
, and 5.0x10⁻⁶ kg/m2.S forM
were chosen for the suspended-sediment transport model.Table 1. Statistical e rror betwee n simulate d and measure d suspe nde d-se dime nt conce ntrations from Nove mbe r 2009 to July 2011.
Ye ar/Month/Date MAE (mg/L) RMSE (mg/L)
2009/11/29 0.72 0.98
2009/12/28 1.09 1.50
2010/01/31 0.95 1.13
2010/02/27 0.11 0.12
2010/04/04 6.41 9.54
2010/05/02 2.52 2.59
2010/06/06 1.38 1.54
2010/07/29 1.84 2.20
2010/08/27 1.94 2.42
2010/09/25 0.32 0.42
2010/11/06 3.51 4.27
2010/12/11 1.69 2.08
2011/01/28 1.59 2.10
2011/02/17 2.10 3.02
2011/03/19 1.26 1.36
2011/04/30 1.70 2.19
2011/05/21 3.02 4.07
2011/06/28 0.18 0.20
Figure 6. Comparison of spatial distributions of vertically ave rage d suspe nde d-se dime nt conce ntration be twee n mode l simulation and observation on April 4, July 29, Nove mber 6, 2010 and January 28, 2011. Note that figures (a) and (b) show the observation and simulation on April 4, 2010. Figures (c) and (d) prese nt the observation and simulation on July 29, 2010. Figures (e ) and (f) are the obse rvation and simulation on Nove mbe r 6, 2010. Figures (g) and (h) prese nt the observation and simulation on January 28, 2011.
5. Model Investigations and Discussion
5.1. Model Sensitivity analysis
Sensitivity analysis is the study of how the uncertainty in the output of a mathematical model can be apportioned to different sources of uncertainty in its inputs . Three-dimensional suspended-sediment transport models have been applied to examine the sensitivity of their models to alter the physical forcing [44-46]. In this study, model sensitivity analysis was implemented to explore the effects of settling velocity (
w
s), the critical stress for erosion (
ec), deposition (
dc), andthe empirical erosion rate (M) on the suspended-sediment concentration and to determine the most important factor that affects the suspended-sediment concentration in the TFL.
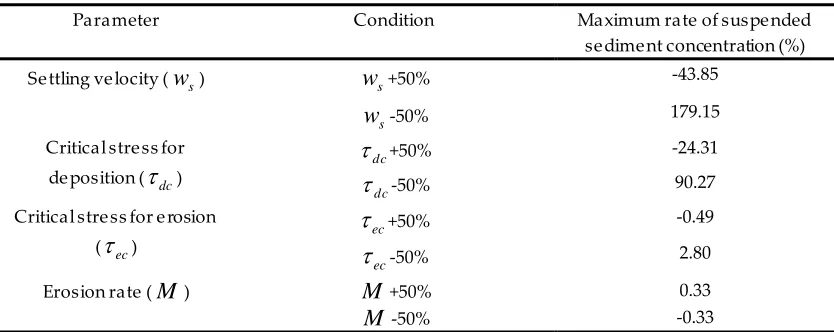
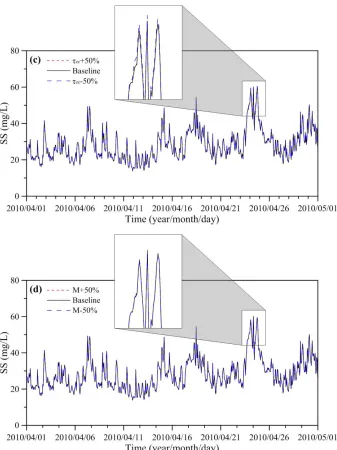
The original bases depend on the simulation of model validation from April 1, 2010 to April 30, 2010. The effects of these parameters on the suspended-sediment concentration w ere investigated with two alternative cases; one involves the value used in model validation plus 50% and the other involves the value minus 50%. Figure 7 presents the model sensitivity results for the four parameters during April 2010. It indicates that the settling velocity would be the most important parameter affecting the suspended-sediment concentration in the TFL. Table 2 lists the model sensitivity results. It indicates that an increase in settling velocity results in a decrease in the suspended-sediment concentration. The maximum rates for decreasing and increasing suspended-sediment concentration are 43.85% and 179.15%, respectively. The maximum rate
(
MR
)
means that the maximum values were determined by the formula represented by
%
100
base sens base
C
C
C
MR
(9)where Cbase is the suspended-sediment concentration for the base runs shown in Figure 4 and Csens is the suspended-sediment concentration for the sensitivity run shown in Figure 7.
further found that the erosion rate is the least important parameter in the suspended-sediment modeling.
Table 2. Re sults of mode l se nsitivity run for four parameters .
Parameter Condition Maximum rate of suspe nded
se dime nt concentration (%)
Se ttling ve locity (
w
s)w
s+50% -43.85s
w
-50% 179.15Critical stre ss for de position (
dc)dc
+50% -24.31dc
-50% 90.27Critical stre ss for e rosion (
ec)ec
+50% -0.49ec
-50% 2.80Erosion rate (
M
)M
+50% 0.33M
-50% -0.33Figure 7. Mode l se nsitivity for the (a) se ttling ve locity (
w
s), (b) critical stress for de position (
dc),(c) critical stre ss for e rosion (
ec), and e rosion rate constant (M).5.2. Influence of wind stress on current and suspended sediment
directions are northeast, northwest, and southwest adopted for model simulations to compare with the baseline condition.
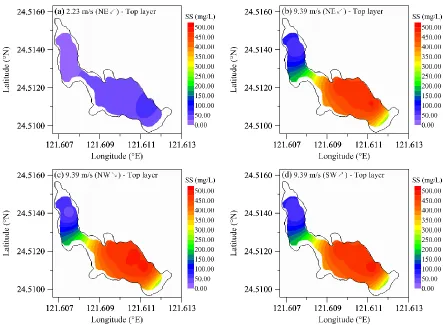
The mean currents at the top and bottom layers for the baseline condition and for different wind speeds and directions, respectively, are shown in Figure 8 and Figure 9. The obvious anticyclonic circular gyre appears at the top layer for the baseline (Figure 8a), while the cyclonic circular gyre is seen at the top layer for the southwest wind (Figure 8d). Basically, the direction of the mean current at the top layer follows the wind direction. A strong wind results in high mean current at top layer. The bottom currents are smaller than the surface currents. The mean surface currents are between 0.018 and 33.0 cm/s, while the mean bottom currents are between 0.01 and 31.1 cm/s.
Figure 8. Mean circulation at the top layer for diffe re nt wind spee ds and directions (a) northeast wind: 2.23 m/s, (b) northeast wind: 9.39 m/s, (c) northwest wind: 9.39 m/s, and (d) southwest wind: 9.39 m/s.
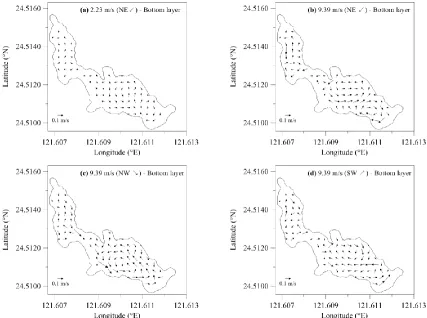
Figure 11. The distribution of mean suspe nde d-se dime nt conce ntration at the bottom layer for diffe re nt wind spee ds and directions (a) northeast wind: 2.23 m/s, (b) northeast wind: 9.39 m/s, (c) northwe st wind: 9.39 m/s, and (d) southwe st wind: 9.39 m/s .
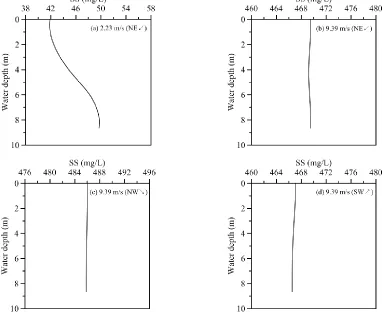
Figure 12. Vertical suspe nde d-se dime nt profiles at the buoy station unde r diffe rent wind spee ds and directions (a) northeast wind: 2.23 m/s, (b) northeast wind: 9.39 m/s, (c) northwest wind: 9.39 m/s, and (d) southwe st wind: 9.39 m/s .
6. Conclusions
A three-dimensional hydrodynamic and suspended-sediment transport model was developed and applied to the Tsuei-Feng Lake in the north-central region of Taiwan. The model was validated with observed water level and suspended-sediment concentrations in 2009, 2010, and 2011. The predicted results quantitatively agreed with measured data in the lake.
The validated model was applied to explore the crucial factor that most affects the suspended-sediment distribution in the TFL. Model sensitivity analysis indicates that the settling velocity is the most important parameter affect ing the suspended-sediment concentration and the erosion rate is the least important parameter in the suspended-sediment transport modeling. Therefore, this parameter (i.e. settling velocity) should be carefully adjusted when the model is used for the model validation procedure. The model was also used to probe the mean current and suspended-sediment distribution in the TFL. Wind speed and direction are the dominant factors driving the current patterns and affecting the suspended-sediment concentration. The obvious anticyclonic and cyclonic circular gyres appear in the lake based on the wind stress. The distributions of suspended-sediment concentration are clearly different depending on the wind speed and direction. Strong winds result in high mean currents and suspended-sediment concentrations in the top and bottom layers due to the effect of resuspension in a shallow lake.
Author Contributions: We n-Che ng Liu and Chih-Yu Chiu supe rvise d the progress of the MOST and Academia Sinica projects and serve d as the gene ral e ditors. Hong-Ming Liu pe rforme d the data collection, mode l establishme nt, and mode l simulations and discusse d the results with We n-Che ng Liu and Chih-Yu Chiu. All authors re ad and approved the final manuscript.
Conflicts of Interest: The authors de clare no conflict of inte re st. References
1. Chao, X.; Jia, Y.; Shie lds, Jr. F.D.; Wang, S.S.Y.; Cooper, C. M. Numerical mode ling of water quality and se dime nt related processes. Ecol. Model. 2007, 201, 385-297.
2. Chao, X.; Jia, Y.; Shie lds, Jr. F.D.; Wang, S.S.Y.; Coope r, C.M. Three -dime nsional nume rical mode ling of cohesive se dime nt transport and wind wave impact in a shallow oxbow lake . Adv. Water Resour. 2008, 31, 1004-1014.
3. Chalov, S.R.; Jarsjo, J.; Kasimov, N.S.; Romanche nko, A.O.; Pie tron, J.; Thorslund, J.; Promakhova, E.V. Spatio-te mporal variation of se dime nt transport in the Se le nga River Basin, Mongolia and Russia. Environ. Earth Sci. 2015, 73, 663-680.
4. Horne , A.J.; Goldman, C.R. Limnology. McGraw-Hill Highe r Education. 1994. 5. DiToro, D.M. Sediment flux modeling. Wile y & Sons, Inc, 2001.
6. Ji, Z.G.; Hamrick, J.H.; Page nkopf, J. Se dime nt and me tals in shallow rive r. J. Environ. Eng. ASCE 2002, 128, 105-119.
7. Gbah, M.B.; Rao, Y.R.; Murthy, R. Tue bule nt e xchange characteristics in the hypolimnion laye r of Lake Ontario. Nordic Hydrol. 2001, 32, 13-28.
8. Parthe niades, E. Erosion and de position of cohe sive soils. J. Hydraul. Div. ASCE 1965, 91, 105-139.
9. Krone , R.B. Flume studies on the transport of sediment in estuarine shoaling processes. Hydraulic Enginee ring Laboratory, Be rkele y, Unive rsity of California, 1962.
10. Me hta, A.J.; Parthe niades, E. An investigation of the de positional properties of flocculate d fine se dime nt. J. Hydraul. Res. 1975, 13, 361-381.
11. Thorn, M.F.C. Physical processes of siltation in tidal channe ls. In: Procee dings of Hydraulic Mode lling Applie d to Maritime Engine e ring Proble ms, London, ICE, 47-55, 1981.
12. Matty, J.M.; Ande rson, J.B.; Dunbar, R.B. Suspe nde d se dime nt transport, se dimentation, and re suspension in Lake Houston, Taxe s: Implications for wate r quality. Environ. Geol. 1987, 10, 175-186. 13. Burban, P.Y.; Xu, Y.J.; Mcne ll, J.; Lick, W. Se ttling spee ds of flocs in fresh water and seawater. J. Geophys.
Res. 1990, 95(C10), 18213-18220.
14. Zie gle r, C.K.; Nisbe t, B.S. Long-te rm simulation of fine -graine d se dime nt transport in large reservoir. J. Hydraul. Eng. ASCE 1995, 121, 773-781.
15. Li, Y.; Me hta, A.J. Assessme nt of hinde re d se ttling of fluid mudlike suspe nsions. J. Hydraul. Eng. ASCE 1998, 124, 176-178.
16. Houwing, E.R.; Rijn, L.C. In situ e rosion flume (ISEF): de termination of be d-shear stress and e rosion of a kaolinite be d. J. Sea Res. 1998, 39, 243-253.
17. Clarke , G.K.C.; Bush, A.B.G.; Bush, J.W.M. Freshwate r discharge, se dime nt transport, and mode le d climate impacts on the final discharge of glacial Lake Agassiz. J. Climate, 2009, 22, 2161-2180.
18. Chung, E.G.; Bombarde lli, F.A.; Schladow, S.G. Mode ling linkages betwee n se dime nt resuspe ns ion and wate r quality in a shallow, e utrophic, wind-e xpose d lake . Ecol. Model. 2009, 220, 1251-1265.
19. Filistovic, V.; Mace ika, E.; Tarasiuk, N.; Lukise nce, B.; Konstantinova, M.; Buivydas, S.; Koviazine , E.; Puzas, A. Mode l of non-equilibrium multiphase contaminant transport in lake wate r-se dime nt syste m. Water Air Soil Poll. 2015, 226, 202.
20. Hawle y, N.; Harris, C.K.; Lesht, B.M.; Clites, A.H. Se nsitivity of a se dime nt transport mode l for Lake Michigan. J. Great Lakes Res. 2009, 35, 560-576.
21. Zouabi-Aloui, B.; Gue ddari, M. Two-dime nsional mode lling of hydrodynamics and water quality of a stratifie d dam rese rvoir in the southern side of the Me dite rranean Sea. Environ. Earth Sci. 2014, 72, 3037-3051.
22. Lee , C.; Schwab, D.J.; Be le tsky, D.; Stroud, J.; Lesht, B. Nume rical mode ling of mixe d se dime nt re suspe nsion, transport, and de position during the March 1988 e pisodic e ve nts in southe rn Lake Michigan. J. Geophys. Res. 2007, 112, C02018.
se dime nt transport of Lake Michigan. Water Resour. Res. 2009, 45, W02419.
24. Faghihirad, S.; Lin, B.; Falconer, R.A. Application of a 3D layer inte grate d nume rical mode l of flo w and se dime nt transport processes to a re servoir. Water, 2015, 7, 5239-5257.
25. Wang, H.; Zhang, Z.Z.; Song, D.P.; Zhou, Y.Y.; Liu, X.D. Wate r and se dime nt transport mechanisms in a large r live r-connected lake . Water Environ. J. 2015, 29, 391-401.
26. Zhang, P.; Che n, X.L.; Lu, J.Z.; Zhang, W. Assimilation of remote se nsing observations into a se dime nt transport mode l of China’s large freshwater lake : spatial and temporal e ffects. Environm. Sci. Pollut. Re s. 2015, 22, 18779-18792.
27. Lou. J.; Schwab, D.J.; Be le tsky, D.; Hawle y, N. A mode l of se diment resuspe nsion and transport dynamics in southe rn Lake Michigan. J. Geophys. Res. 2000, 105(C3), 6591-6610.
28. Carde nas, M.P.; Schwab, D.J.; Eadie , B.J.; Hawle y, N.; Le sht, B.M. Se dime nt transport mode l validation in Lake Michigan. J. Great Lakes Res. 2005, 31, 373-385.
29. Lee , C.; Schwab, D.J.; Hawle y, N. Se nsitivity analysis of se dime nt resuspe nsion parame ters in coastal area of southe rn Lake Michigan. J. Geophys. Res. 2005, 110, C03004.
30. Lv, C.; Zhang, F.; Liu, Z.; Hao, S.; Wu, Z. Three -dime nsional nume rical simulation of se dime nt transport in Lake Tai base d on EFDC mode l. J. Food Agricu. Environ. 2013, 11, 1343-1348.
31. Wang, C.; She n, C.; Wang, P.F.; Qian, J.; Hou, J.; Liu, J.J. Mode ling of se dime nt and heavy me tal transport in Taihu Lake , China. J . Hydrodyn. 2013, 25, 397-387.
32. Liu, W.C.; Chan, W.T.; Tsai, D.W. Three-dime nsional mode ling of suspe nde d se dime nt transport in a subalpine lake . Environ. Earth Sci. 2006, 75:173.
33. Sanford, L.P. Ne w se dime ntation, re suspension and burial. Limnol. Oceanogr. 1992, 37, 1164-1178. 34. Che ng, W.Y. Using water quality variables to estiablish light attenuation model in subtropic subaline Yuan-Yang
Lake and Tsuei-Feng Lake. Mate r Thesis of De peramtn of Civil and Disaster Pre ve ntion Engineering, National Unite d Unive rsity, Taiwan, 2010.
35. Zhang, Y.L.; Baptista, A.M. SELFE: A se mi-implicit Eule rian-Lagrangian finite -e le me nt mode l for cross-scale ocean circulation. Ocean Mode l. 2008, 21, 71-96.
36. Umlauf, L.; Buchard, H. A ge neric length-scale equation for ge ophysical turbule nce mode ls. J. Mar. Res. 2003, 61, 235-265.
37. Lin, J.; Kuo, A.Y. A mode l study of turbidity maximum in the York Rive r estuary, Virginia . Estuaries 2003, 26, 1269–1280.
38. Thomann, R.V.; Mue lle r, J.A. Principles of surface water quality modeling and control. Harper Collins Publishe rs, Inc., Ne w York, 1987.
39. Liu, W.C. Mode ling the influence of settling ve locity on cohesive se dime nt transport in Tanshui Rive r e stuary. Environ. Geol. 2005, 47, 535-546.
40. Young, S. M.; Ishiga, H. Environme ntal change of the fluvial-estuary syste m in re lation to Arase Dam re moval of the Yatsushiro tidal flat, SW Kyushu, Japan. Environ. Earth Sci. 2014, 72, 2301-2314.
41. Che n, W.B.; Liu, W.C.; Hsu, M.H.; Hwang, C.C. Mode lling investiagtion of susppe nde d se dime nt in a tidal e stuary using a three-dimensional model. Appl. Math. Model. 2015, 39, 2570-2586.
42. Duy Vinh, V.; Ouillon, S.; Van Thao, N.; Tie n, N.N. Nume rical simulaitons of suspe nde d se dime nt dynamics due to se asonal forcing in the Me kong coastal area. Water, 2016, 8, 255.
43. APHA. Standard methods for the examination of water and wastewater. 19th e d. American Public Health Association, Washington, DC., USA, 1995.
44. Stane v, E.V.; Brink-Spalink, G.; Wolff, J.O. Se diment dynamics in tidally dominate d e nvironme nts controlle d by transport and turbule nce : a case study for the East Frisian Wadde n Sea. J. Geophys. Res. 2007, 112, C04018.
45. Wang, X.H.; Pinardi, N.; Malacic, V. Se diment transport and resuspe nsion due to combine d motion of wave and curre nt in the northern Adriatic Sea during a Bora e ve nt in January 2001: a nume rical study. Cont. Shelf Res. 2007, 27, 613-633.
46. Warner, J.C.; Butman, B.; Dalyande r, P.S. Storm-drive n se dime nt transport in Massachusetts Bay. Cont. She lf Re s. 2008, 28, 257-282.
47. Kjaran, S.P.; Holm, S.L.; Mye r, E.M. Lake circulation and se dime nt transport in Lake Myvatn. Aquat. Ecol., 2004, 38, 145-162.
49. Scheon, J.; Stretch. D.; Tirok, K. Wind-drive n circulation patterns in shallow estuarine lake : St Lucia, South Africa. Estuar. Coast. Shelf Sci. 2014. 146, 49-59.
50. Podse tchine , V.; Huttula, T. Mode ling se dime ntation and resuspe nsion in lake . Wate r Pollut. Res. J. Canada 1994, 29, 309-342.
51. Jin, K.R.; Ji, Z.G. Case study: mode ling of se dime nt transport and wind-wave impact in Lake Okeechobee . J. Hydraul Eng. ASCE 2004, 130, 1055-1067.