Article
Extension of space syntax methods to generic urban
variables
Roberto D’Autilia1,†,‡and Marco Spada2,*
1 Dipartimento di Matematica e Fisica, Università Roma tre; [email protected]
2 IRCAS - Goldmann & Partners International Research Centre for Applied Sustainability; [email protected]
* Correspondence: [email protected]; Tel.: +30-347-875-2989 † Current address: Affiliation 3
‡ These authors contributed equally to this work.
1
2
3
4
5
6
7
8
9
10
11
12
13
Abstract: Westudiedgeneralizationofamethodforextendingconfigurationalstudiestovariables thatarenotexclusivelygeographical,inordertoallowinvestigationofgenericrelationshipsinthe builtenvironment.Weobservedanumberoflimitationsoftheclassicalapproachofconfigurational studiesandweconsideredhowacomplexanalyticalmethodcouldbeimplementedinthestudyof non-topologicalvariables,suchaslanduse,noisepollutionandfinancialorpropertyrents.Inorder todothisweestablishedasystemofrelationshipsbasedonalabeledprimarygraph. Categorization ofthelabelsofthelinkswasperformedonagenericvariable,specifically,thepredominantuseof roads. Thegraphwasthencontractedusinganoptimizationalgorithm,whichwedescribe. The algorithmallowsthenetworktobereducedtoamorestreamlinedsystemthatcanbetteranalyze therelationshipsbetweenthedifferentcategories.Applicationofthemethodshowedthatitisfaster toidentifyweaknessesinurbannetworks,andthentakemeasurestoresolvethem.Thecasestudy concernsthepedestrianizationoftheColosseumareainRome.
Keywords: keyword1;keyword2;keyword3(listthreetotenpertinentkeywordsspecifictothe article,yetreasonablycommonwithinthesubjectdiscipline.)
14
1. Introduction 15
The introduction of Space Syntax [10] in urban studies has certainly had the merit of highlighting 16
the importance of urban topology for activities connected with the use of open spaces, and in particular 17
for the movement of pedestrians [4]. In addition, its reformulation in terms of graph theory has opened 18
new theoretical and use perspectives, linked to the processes of diffusion on dual graphs [2]. Shifting 19
attention from the Euclidean geometry of urban space to its connectivity has shown that the city is 20
a tool to connect urban phenomena: a given phenomenon, for instance the location of commercial 21
activities, can have different effects when it manifests in differently connected spaces [6]. 22
Among the many variables that define the behavior of a city, Space Syntax has considered almost 23
exclusively spatial ones. Axial lines or lines of sight are the fundamental element of the model [4], 24
variables whose topology is conditioned by the shape of the city. In graph formulation these lines are 25
represented by graph nodes, while where they cross determines the graph’s edges. 26
Since the choice of this variable is to some extent arbitrary, many proposals have been advanced 27
to make it objective [3,5,7]. In any case the resulting graph (V,E)always consists of open spaces 28
v∈Vand connections between them(u,v)∈Ewhereu,v∈V. It is important to note that the graph 29
represents neither the geometry nor the topology of the city, but rather the way in which the city 30
connects the axial lines. 31
On the basis of this observation we can imagine that nodesvof the graph are generic urban 32
variables, for example the amount of urban greenery, pollution levels, the income of inhabitants or even 33
the usual Space Syntax axial lines. These quantities are naturally geolocalized, but their connection is 34
conditioned by the structure and shape of the city. It is therefore possible to establish these connections 35
and study how the city of green areas, income or services, and of course also the “classic” city of axial 36
lines, are organized. 37
In this paper we propose a rigorous method to extend Space Syntax to generic variables. As a case 38
study we investigate the consequences of pedestrianizing a central archaeological area in Rome (Italy). 39
The paper is organized as follows. In the next section we illustrate the method to obtain the 40
generalized graph and show how, in the particular case of axial lines, the same results are obtained 41
as with the Space Syntax approach. In section3we use the method to study pedestrian mobility in 42
the central archaeological area of Rome, comparing the current situation with the layout proposed by 43
Roma Tre University. In section4we show the results of the proposed technique, and how the method 44
makes it possible to examine an urban project using the characteristic quantities of generalized Space 45
Syntax. Finally, in section5we discuss the criticalities and future developments of the method. 46
2. The model 47
Basic variables of Space Syntax are the axial linesv∈V, which in their more general definition [9] 48
belong to a genericVset. These variables represent a property of the space (the visual lines embraced 49
by the gaze) but are not located in a point. The interaction between two of them(u,v)∈V×V=Eis 50
represented by their intersection: if the correspondingluandlvvisual lines meet, thenlu∩lv6=∅and
51
(u,v) =1, otherwise f(u,v) =0. This property, however, is not defined byuandvvariables, but by 52
the inner structure of the city that contains them. In many parts of Manhattan, for example, these lines 53
connect two separate sets of a bipartite graph [8], while in a medieval city the nodes are much more 54
interconnected [9]. 55
In general, consciously or unconsciously, city planners establish a connectivity criterion for these 56
lines [9]. However, variablesv∈Vare generic variables and may indicate urban properties different 57
from visual lines. So, for instance, nothing precludes us from identifyingvwith the use of a street, 58
which is pedestrian, driveable, semi-pedestrian, etc.; the variable therefore measures a property of 59
that street. We would then like to use the results and techniques of Space Syntax to understand how 60
the structure of the city affects the interaction between these uses. To do so, we introduce a rigorous 61
process of constructing the corresponding graph. 62
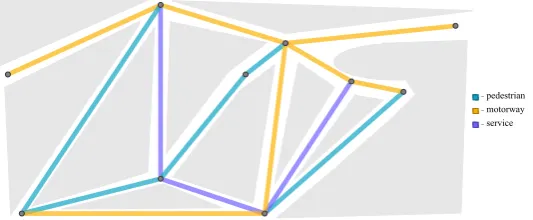
Considering a generic road graphG= (V,E), where the vertices are the intersections or other 63
road-spots and the edges are their connections, and superimposing it on a map of the city as in Figure 64
1: if the nodes are sufficiently dense, all the results are insensitive to the choice of this graph. 65
-pedestrian -motorway -service
Different colors indicate different uses of the streets: pedestrian, driveable and service, while grey 66
areas represent inaccessible spaces. Each color is therefore a property of space. In the particular case of 67
Space Syntax, properties are the axial lines. 68
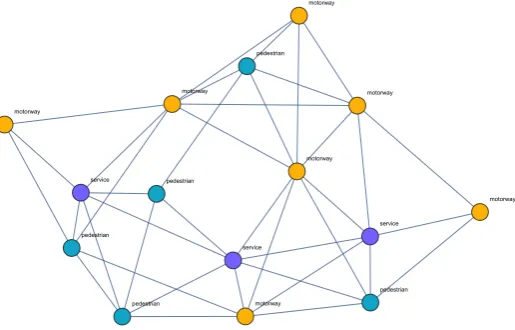
From the graphGof Figure1we can construct the line graphL(G), the graph whose nodes derive 69
from the edges ofG. If two nodes ofL(G), that is two edges ofG, have a node in common, then they 70
will be connected inL(G). In substance the edges ofGbecome nodes ofL(G), and they are connected 71
only when the two starting edges cross each other. The line graph of Figure1is shown in Figure2. 72
From graphGof Figure1we can construct the line graphL(G), the nodes of which derive from 73
the edges ofG. If two nodes ofL(G), that is two edges ofG, have a node in common, then they are 74
connected inL(G). In substance, the edges ofGbecome nodes ofL(G), and are only connected when 75
the two starting edges cross each other. The line graph of Figure1is shown in Figure2. 76
motorway
pedestrian
pedestrian
service
service
pedestrian service
motorway
pedestrian
motorway motorway
pedestrian
motorway motorway
motorway
Figure 2.The corresponding line graphL G(V,E) .
We can immediately see that the properties of theGedges become properties of the vertices 77
ofL(G), which is a colored (non-proper vertex coloring) non geolocalized graph. GraphL(G)then 78
describes the topology of the city in relation to the property we chose to study. 79
80
81
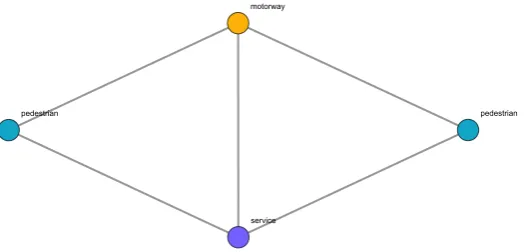
Next step is to contract the nodes ofL(G)that are connected and have the same colour. A set 82
of nodes connected with the same property can be represented by a single node, but only if in the 83
contraction process all the nodes maintain the original connections with the nodes of different colour. 84
We thus obtain the contracted line graphLC(G). The result of our example is given in Figure3.
85
The next step is to contract the nodes ofL(G)that are connected and have the same color. A set 86
of nodes connected with the same property can be represented by a single node, but only if in the 87
contraction process all the nodes maintain the original connections with the nodes of different color. 88
We thus obtain the contracted line graphLC(G). The result of our example is shown in Figure3.
motorway
pedestrian
service
pedestrian
Figure 3.The line graphLC G(V,E)
after contraction of same-color adjacent nodes.
We observe that in Figure3pedestrian zones are separated from motorway and service areas, 90
which was also evident when looking at graph G. However, when analyzing a large space with 91
thousands of connections, the connective structure is not immediately evident. Moreover, as we see 92
in the following section, in the contracted graphLC(G)it is possible to measure all the parameters
93
of Space Syntax (and not only), such as relative asymmetry, centrality, degree distribution or spectral 94
gap. In this case, however, these measurements do not refer to axial or visual lines, but to the property 95
we have chosen to label theGedges. Finally, we note that if we had chosen visual lines as labels, we 96
would have obtained exactly the same results as with the Space Syntax approach. 97
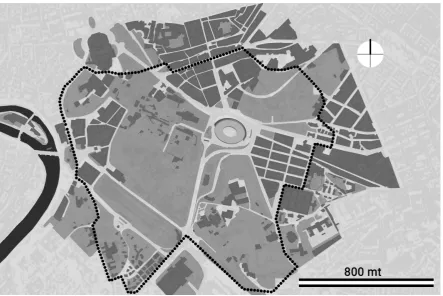
3. The Colosseum case study 98
We used the method described in the previous section to compare the current state of the road 99
network in the central archaeological area of Rome with the one planned by the Department of 100
Architecture of Roma Tre University [1]. In its present state, pedestrian access in the area is hindered 101
partly by many structural constraints and partly by some roads that are only accessible to motor 102
vehicles. In particular, via di San Gregorio (the longest red road in Figure5), the road that extends 103
from the Circus Maximus to the Arch of Constantine, is a road that occupies two carriageways with 104
Figure 4.The central archaeological area of Rome (Italy), details of Colosseum area.
The project [1] foresees reducing the carriageway and transforming four of the six lanes into a 106
wide pedestrian avenue that connects the Circus Maximus with the Arch of Constantine and then the 107
Colosseum (Figure4). 108
109
The street colors of Figure5indicate the use of the road according to the legend in Figure6below. 110
- For vehicles only(i.e. secondary).
- Mostly for vehicles(i.e. tertiary).
- Service.
- Mostly pedestrian(i.e. residential).
- For pedestrian only.
Figure 6.The variables used in the model.
The effects of this small change in traffic flow can be analyzed by applying Space Syntax methods 111
to the graph generated by variables that are no longer axial lines, but road uses. Applying the method 112
described in the previous section, we obtain the two corresponding contracted line graphs, where 113
the nodes represent the contraction of the line graph of adjacent roads with the same color (use) as in 114
Figure6. 115
Figure 7.The contracted line graphsLC(G)of the road network in the central archaeological area, as in
the current situation (left) and in the project (right).
4. Results 116
We can examine the graph obtained in the previous section with Space Syntax methods, bearing 117
in mind that the measurements do not refer to spaces and their connections, but to road uses and their 118
connections. 119
The degree distribution shows the first difference between the status quo and the Master plan. 120
Currently there are few hubs connecting different road uses, while in the project some of these hubs 121
are transformed into nodes with a low degree of connectivity, making the graph more entangled and 122
therefore inherently more fluid [biblio]. The hub with 24 edges decreases in degree to 20 and the grid 123
0. 2. 4. 6. 8. 10. 12. 14. 16. 18. 20. 22. 24. 0.0
0.1 0.2 0.3 0.4 0.5 0.6
Normalized Degree Distribution(current state)
0. 2. 4. 6. 8. 10. 12. 14. 16. 18. 20. 0.0
0.1 0.2 0.3 0.4 0.5 0.6
Normalized Degree Distribution(masterplan)
Figure 8.Degree distribution of the central archaeological area, as in the current situation (left) and in the project (right).
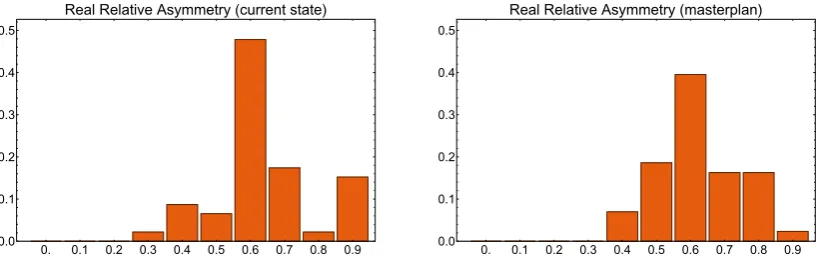
Real Relative Asymmetry (RRA) provides a measure of the integration or segregation of the city 125
[10]. In the case of Space Syntax the city integrates or separates the axial lines in a generic sense; 126
in our case it integrates or separates the uses of roads. The distribution of this quantity shows that 127
the histogram of Figure9moves a little to the left, towards a topology that is less segregated in the 128
Master plan than in the current situation. The pedestrianization of via di San Gregorio does not in 129
fact eliminate the carriageways, but widens and improves the parallel pedestrian route. This layout 130
makes it possible to maintain the connectivity of motor traffic, but at the same time connects different 131
footpaths and reduces pedestrian segregation. 132
0. 0.1 0.2 0.3 0.4 0.5 0.6 0.7 0.8 0.9 0.0
0.1 0.2 0.3 0.4 0.5
Real Relative Asymmetry(current state)
0. 0.1 0.2 0.3 0.4 0.5 0.6 0.7 0.8 0.9 0.0
0.1 0.2 0.3 0.4 0.5
Real Relative Asymmetry(masterplan)
Figure 9. The distribution of Real Relative Asymmetry of the central archaeological area, as in the current situation (left) and in the project (right).
The distribution of Integration [10] clarifies the proposed method and the efficiency of the 133
measures suggested by the Master plan. In our case, contrary to what happens in classic Space Syntax 134
theory, it does not measure the number of (normalized) steps needed to move from one space to 135
another, but the number of different (normalized) road-uses that need to be changed. The difference 136
with respect to the space syntax of the axial lines is not large. In our case, spaces are characterized 137
by the use in terms of mobility and interactions between different uses; in the “classic” case, by their 138
visibility and interaction of views. 139
In both cases, the information we obtain is related to topological character and we have no 140
information about the size of the spaces or the time it takes to travel the roads. However, metric 141
information can be used as a primary graph labelG(V,E)and become an additional parameter of the 142
topological description. From Figure9, we can see that the Master plan distributes the integration in a 143
0.6 0.8 1. 1.2 1.4 1.6 1.8 2. 2.2 2.4 2.6 0.0
0.1 0.2 0.3 0.4 0.5
Integration(current state)
0.6 0.8 1. 1.2 1.4 1.6 1.8 2. 2.2 2.4 0.0
0.1 0.2 0.3 0.4 0.5
Integration(masterplan)
Figure 10.The distribution of Integration of the central archaeological area, as in the current situation (left) and in the project (right).
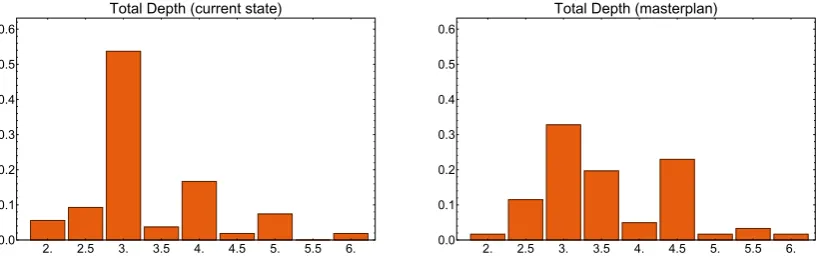
Finally, in Figure11, the last measure of Space Syntax we consider is Total Depth, which indicates 145
the sum of depths from a root line to all others, depth meaning the fewest number of changes of lines 146
intervening between the root and another [10]. Here, too, we represent its distribution, because the aim 147
of the Master plan is to make these quantities more uniform. In fact, the plan for via di San Gregorio 148
amplifies the histogram making the probability of crossing a road use, passing from one use to another, 149
more uniform. 150
2. 2.5 3. 3.5 4. 4.5 5. 5.5 6.
0.0 0.1 0.2 0.3 0.4 0.5 0.6
Total Depth(current state)
2. 2.5 3. 3.5 4. 4.5 5. 5.5 6.
0.0 0.1 0.2 0.3 0.4 0.5 0.6
Total Depth(masterplan)
Figure 11.The distribution of Total Depth of the central archaeological area, as in the current situation (left) and in the project (right).
In this section we indicated the urbanistic quantities which are most relevant for evaluating the 151
effects of the Master plan with respect to the status quo, but all the characteristic variables of space 152
syntax can be calculated on the graph of Figure7. 153
The tool developed makes it extremely easy to compare qualitatively and quantitatively. 154
Analyzing the project, it is evident that a minor pedestrianization intervention has a very significant 155
effect on the general connectivity of the area and on the interchange between different mobility criteria. 156
However, we underline that as with Space Syntax, the method is not used to design, but only to 157
objectively evaluate the effects of a plan. 158
5. Discussion 159
We introduced a generalization of Space Syntax to extend the quantities that describe axial lines to 160
generic urban variables. The method is based on the construction of a primary graph whose edges are 161
labeled and categorized by the values of selected variables. The choice of the primary network can be 162
absolutely generic, as long as it is sufficiently dense. For simplicity we chose to identify the edges with 163
road sections, but we could have superimposed any grid on the map of the city. Superimposing a dense 164
variables, we obtain a graph that, once transformed into a line graph and then contracted, always 166
produces the same result. 167
In fact, it is the city itself that connects urban properties: relationships do not change when we 168
modify the method of measuring them. We also observe that use of the proposed method clarifies some 169
aspects of Space Syntax that are not evident in the original formulation, in particular the statistical 170
nature of many urban quantities. In this sense, greater reliability of the results is obtained when dealing 171
with very large graphs. However, this does not mean that Space Syntax is more reliable for studying a 172
large city than a building, but rather that in the analysis of small spaces it is necessary to superimpose 173
a denser network, or equivalently to measure the quantities that interest us in a very detailed way. 174
Finally, let us point out that the proposed method makes it possible to compare different variables. 175
For example, we could have measured noise pollution currently and under the Master plan, and 176
compared the corresponding graphs and corresponding quantities of the generalized Space Syntax. 177
The model of interaction between different graphs will be discussed in a later paper. 178
Author Contributions:Conceptualization and Data curation: R.DA., M.S.; Formal analysis and Investigation:
179
R.DA.; Methodology: R.DA., M.S.; Resources, Supervision, Visualization and Writing - original draft: R.DA.;
180
Writing - review & editing: MS.
181
Funding:This Research received no external funding.
182
Acknowledgments: The authors thank Giovanni Caudo, Giovanni Longobardi, Martina Pietropaoli, Maria
183
Margarita Segarra Lagunes, Nicola Vazzoler, Tiziana Casaburi, Dario Aureli, Mauro Baioni, Milena Farina, Sofia
184
Sebastianelli and all the working group for the Colosseum Masterplan and Isabella Goldmann for her helpful
185
advice. This work was partially supported by MIUR and BIMACT funds ...
186
Conflicts of Interest:The Authors have no conflicts of interest to declare.
187
References 188
1. Amarilli, F., Aureli, D., Baioni, M., Casaburi, T., Caudo, G., D’Autilia, R., Di Segni, D., Farina, M., Longobardi,
189
G., Pietropaoli, M., Pelusio, B. Sebastianelli, S., Segarra Lagunes, M. M., Vazzoler, N.,Piano di assetto dell’area
190
archeologica monumentale del Colosseo, University Roma Tre, 2017.
191
2. Blanchard, P. and Volchenkov, D.Mathematical Analysis of Urban Spatial Networks.; Springer Science & Business
192
Media: Berlin, 2008, ISBN-9783540878292
193
3. Cardillo, A., Scellato, S., Latora, V., et al.,Structural properties of planar graphs of urban street patterns., Physical
194
Review E 73: 066107, 2006.
195
4. Hillier, B.Space is the Machine: A Configurational Theory of Architecture.; Createspace Independent Publishing
196
Platform; pp. 32-58, ISBN-9781511697767.
197
5. Jiang, B., Claramunt, C.,Topological analysis of urban street networks., Environment and Planning B 31: 151–162,
198
2004.
199
6. Porta, S., Latora V., Fahui Wang, Rueda S., Strano E., Scellato S., Cardillo A., Belli E., Càrdenas F., Cormenzana
200
B., and Latora L., Street Centrality and the Location of Economic Activities in Barcelona.Urban Studies, Vol.
201
49, Issue 7, pp. 1471-1488, https://doi.org/10.1177/0042098011422570
202
7. Stavroulaki, I.,Marcus, L., Berghauser Pont, M., Nilsson,L., C., S.,Representations of street networks in space
203
syntax towards flexible maps and multiple graphs, 11th International Space Syntax Symposium, SSS 2017, Lisbon,
204
Portugal, 3-7 July 2017, Vol. 5 p. 174.1-174.16, 2017.
205
8. Volchenkov, D., Blanchard, P.,Random walks along the streets and canals in com-pact cities: Spectral analysis,
206
dynamical modularity, information, and statistical mechanics.Physical Review E 75(2) (2007).
207
9. D’Autilia, R., Spada, M. Shaping ideal cities: The graph representation of the urban utopia,
208
Environment and Planning B: Urban Analytics and City Science First Published June 29, 2017,
209
https://doi.org/10.1177/2399808317716163
210
10. Hillier, B., Hanson, J.,The Social Logic of Space, Cambridge University Press: Cambridge, 1984.