The detection and X-ray evolution of galaxy groups at high redshift
L. R. Jones,
1PI. M
cHardy,
2A. Newsam
3and K. Mason
41School of Physics and Astronomy, University of Birmingham, Birmingham B15 2TT 2Department of Physics and Astronomy, The University, Southampton SO17 1BJ
3Astrophysics Research Institute, Liverpool John Moores University, 12 Quays House, Egerton Wharf, Birkenhead CH41 1LD 4Mullard Space Science Laboratory, University College London, Holmbury St Mary, Dorking RH5 6NT
Accepted 2002 March 20. Received 2002 March 20; in original form 2001 April 12
A B S T R A C T
We describe some of the first X-ray detections of groups of galaxies at high redshifts
ðz,0:4Þ, based on the UK deep X-ray survey of McHardy et al. Combined with other deep
ROSATX-ray surveys with nearly complete optical identifications, we investigate the X-ray
evolution of these systems. We find no evidence for evolution of the X-ray luminosity function up to z¼0:5 at the low luminosities of groups of galaxies and poor clusters
ðLX*1042:5erg s21Þ, although the small sample size precludes very accurate measurements.
This result confirms and extends to lower luminosities current results based on surveys at brighter X-ray fluxes. The evolution of the X-ray luminosity function of these low-luminosity systems is more sensitive to the thermal history of the intragroup medium (IGM) than to cosmological parameters. Energy injection into the IGM (from, for example, supernovae or active galactic nuclei winds) is required to explain the X-ray properties of nearby groups. The observed lack of evolution suggests that the energy injection occurred at redshiftsz.0:5.
Key words:galaxies: clusters: general – X-rays: galaxies.
1 I N T R O D U C T I O N
Groups of galaxies are ubiquitous; at least half of all local galaxies are located within groups (Tully 1987). A significant fraction of the total mass of the Universe may also be located in groups. In hierarchical models of the growth of structure in the Universe, groups form before clusters and are the building-blocks from which clusters assemble.
The evolution with redshift of galaxy groups has, however, received little observational attention. This is largely because of the lack of reliable samples of high-redshift galaxy groups. Groups at high redshift are difficult to find in two-dimensional optical surveys because of their very low contrast against the foreground and background galaxy distribution. Although surveys around radio galaxies have had some success (e.g. Allington-Smith et al. 1993), X-ray surveys have the potential to unambiguously identify clusters and groups at high redshifts via the thermal X-ray emission from the hot gas trapped in the cluster gravitational potential. X-ray observations have shown that groups contain a hot intragroup medium (IGM) which is a scaled down version of that found in clusters of galaxies (Mulchaey et al. 1996; Ponman et al. 1996). This X-ray-emitting gas in groups may well constitute the largest observed component of the baryon mass of the Universe (Fukugita, Hogan & Peebles 1998).
The smaller potential wells of groups, compared with clusters,
imply that the global X-ray properties of the IGM are not only determined by the dark matter potential but are also sensitive to other heating (or cooling, Bryan 2000) processes (e.g. Cavaliere, Menci & Tozzi 1997). Evidence has recently accumulated for non-gravitational energy input into the IGM. This energy is responsible for breaking the self-similar scaling of cluster properties, most strongly in low-mass systems (Kaiser 1991; Evrard & Henry 1991). Such additional heating can explain the shape of scaling relations such as the steepening slope of the X-ray luminosity– temperature relation from clusters to groups (Cavaliere, Menci & Tozzi 1999; Wu, Fabian & Nulsen 1998, 2000; Balogh, Babul & Patton 1999; Bower et al. 2000; Tozzi & Norman 2001; Lowenstein 2000). The discovery of a minimum entropy, or ‘entropy floor’, in the IGM in the cores of low-redshift groups has provided direct evidence of energy input in excess of that predicted from the scaled properties of clusters (Ponman et al. 1999; Lloyd-Davies, Ponman & Cannon 2000). Possible origins of the additional energy include active galactic nuclei (AGN) or supernova-driven galaxy winds at early epochs. Studies of the evolution of the X-ray properties of groups can discriminate between different origins (Valageas & Silk 1999; Menci & Cavaliere 2000).
Current X-ray surveys are sensitive enough to measure the ensemble properties of the local X-ray group population, but until recently X-ray surveys had insufficient sensitivity to detect the low luminosities of galaxy groups at even moderately high redshifts
ðz<0:3Þ. Currently, only the deepestROSAT surveys reach the
fluxes required ð&10214erg cm22s21, 0:5 – 2 keVÞ and have
P
sufficient optical follow-up information. None of the current
ROSAT cluster surveys (Jones et al. 1998; Rosati et al. 1998a; Vikhlinin et al. 1998; Burke et al. 1997; Romer et al. 2000) sample these faint fluxes. Here we report on results based on the UK Deep
ROSATSurvey (McHardy et al. 1998, hereafter M98). We include
updated positional information from a deepROSAThigh-resolution
imager (HRI) exposure. We describe the groups and clusters found
in the survey and combine them with other deep ROSATsurvey
detections to measure their X-ray evolution. In Section 4 we show
the logðNÞ– logðSÞrelation and X-ray luminosity function (XLF).
The implications are discussed in Section 5. We use H0¼
50 km s21Mpc21andq
0¼0:5 unless stated otherwise.
2 O B S E R VAT I O N S
2.1 X-ray observations
A detailed description of the observations made with theROSAT
position sensitive proportional counter (PSPC) and of the optical follow-up observations are given in M98, so here we provide only a summary, but also include a more detailed description of the
ROSATHRI data.
The survey field is in a region of very low Galactic absorption
ðNH<6:5£1019cm22Þ at position RA 13h34m37:s0, Dec.
3785404400 (J2000). The total PSPC exposure time was 115 ks,
making this survey the second deepestROSATX-ray survey made.
Only the central region of the PSPC field, at off-axis angles
,15 arcmin, was used. A total of 96 sources above a flux limit of
2£10215erg cm22s21 ð0:5 – 2 keVÞ were detected. The HRI
observations were made in June 1997 and the total exposure time
was 201 ks. The HRI field of viewð38£38 arcmin2Þ covers the
complete survey area, and the spatial resolution is significantly superior to that of the PSPC, ranging from 6 arcsec (half-energy diameter) on axis to 30 arcsec (half-energy diameter) at 15-arcmin off-axis, although the narrow core of the HRI point spread function (PSF) is maintained at these off-axis angles. The HRI
detects X-rays over the fullROSATenergy bandð0:1 – 2:4 keVÞ, but
has lower sensitivity than the PSPC, because of its higher unrejected particle background and lower quantum efficiency. The HRI sensitivity is particularly low to faint diffuse X-ray emission, for which the improved HRI spatial resolution affords little gain in signal-to-noise ratio. In this work we are primarily interested in the extended X-ray emission from groups and clusters of galaxies, and so we base our survey on the more sensitive PSPC data, and use the HRI data to reduce error circle sizes and help resolve confused sources. We maintain the same source numbering system as used in M98.
2.2 Optical, radio and NIR observations
Optical charge-coupled device (CCD) imaging has been obtained at the 3.6-m Canada – France – Hawaii Telescope (CFHT), the University of Hawaii 2.2-m telescope, the 2.5-m Nordic Optical Telescope and the Michigan – Dartmouth – MIT 2.4-m telescope. The deepest images, from the CFHT in subarcsecond seeing, reach
R¼24:5 mag over the whole field. We have also made deep Very
Large Array (VLA) radio maps at 20 and 6 cm, reaching a flux limit
of 0.3 mJy at 20 cm. The ROSAT positions were corrected for a
PSPC systematic position error (13 arcsec) and the smallROSAT
roll angle error of 0.1858(see M98). Most of the X-ray sources
were identified with objects brighter than R¼23 mag. Selected
sources have near-infrared imaging (Newsam et al. 1997).
Low-resolution spectroscopy ð10 – 15AÞwas performed at the
3.6-m CFHT with the MOS multislit spectrograph and at the 4.2-m William Herschel Telescope (see M98 for details). Spectra were obtained within a contiguous region covering 85 per cent of the central 30-arcmin diameter survey area, and containing 78
X-ray sources above the flux limit of 2£10215erg cm22s21
ð0:5 – 2 keVÞ. The survey region was largely defined by the
positioning of the MOS fields and did not include some areas at large off-axis angles. Here we include the small region labelled ‘mask K’ and not used by M98, in order to utilize as large an area as possible. A total of 63 of the 78 sources have been identified
spectroscopically. The geometric area covered is 0.167 deg2.
3 A N A LY S I S A N D R E S U LT S
3.1 Source searching
We have supplemented the PSPC source list of McHardy et al.
(1998), which was produced using an algorithm optimized for point sources, with (a) HRI information and (b) a separate search of the PSPC data using the Voronoi tessellation and percolation (VTP) method (Ebeling & Wiedenmann 1993), which is optimized to locate faint extended sources.
The HRI image was searched for point sources independently of the PSPC data using a maximum-likelihood fit to the PSF, including the radial variation of the PSF. The point source flux
limit of the HRI observation was <3.5£10215erg cm22s21
ð0:5 – 2 keVÞ, depending on the spectrum. A total of 43 HRI sources
(of 61 detected) above a significance of 4smatched PSPC sources.
The fraction of PSPC sources detected in the HRI (at the 4s
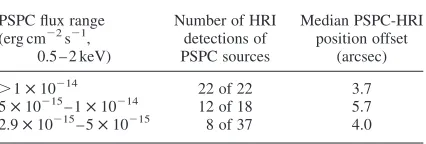
threshold) falls as a function of flux because of the lower sensitivity of the HRI exposure (see Table 1). A full description of the impact of the HRI data on the total identification content of the survey is beyond the scope of this paper; here we merely note that the HRI positions confirm that the PSPC positions were accurate to within, or better than, the statistical uncertainty given by M98, at least for
PSPC fluxes *3.5£10215erg cm22s21, where we have HRI
detections. In particular, the groups and clusters considered here all
fall in the flux rangeð.5£10215erg cm22s21Þwhere the HRI
positions of point sources have in general confirmed the PSPC positions.
The Voronoi tessellation and percolation algorithm was applied to the PSPC data, as described by Scharf et al. (1997), to check whether the point-source optimized algorithm of M98 had missed any extended sources. Only one such source was found (number 173) and it was added to the list of candidate clusters.
PSPC count rates in the 0:5 – 2 keV band were measured for all
group/cluster candidates within an aperture of radius 40 – 60 arcsec
ð270 – 410 kpc atz¼0:4Þ, after masking out any nearby sources
and using a local background subtraction and an exposure map created using the method of Snowden et al. (1992). These count rates were in general higher than those measured by M98 assuming
Table 1.HRI and PSPC coincidences.
PSPC flux range Number of HRI Median PSPC-HRI (erg cm22s21, detections of position offset
0:5 – 2 keVÞ PSPC sources (arcsec)
.1£10214 22 of 22 3.7
5£10215– 1£10214 12 of 18 5.7 2.9£10215– 5£10215 8 of 37 4.0
point-like sources, but agreed to within ,10 per cent with the available VTP count rates. To convert from count rate to (absorbed)
flux we used a constant value of 1:15£10211erg cm22s21
ð0:5 – 2 keVÞ(count s21)21. This conversion is accurate to within 5
per cent for temperatures in the range<1 – 2 keV (the temperatures
expected from the luminosity – temperature relation for the luminosities we find; see, e.g., Fairley et al. 2000) given the low Galactic column density and assuming abundances of 0.3 times the solar value. The correction for Galactic absorption in the direction
of this field is very small (&2 per cent in the 0:5 – 2 keV band for a
temperature of 1 keV, and less for higher temperatures) and has been assumed to be negligible.
A correction for missing flux outside the measurement aperture can only be made approximately because the PSPC surface brightness profiles are not measured accurately enough to allow
extrapolations to larger radii. Assuming a King profile withb¼
2=3 and a core radius of 100 kpc, appropriate for groups (although
there is a large scatter in observed values e.g. Mulchaey et al. 1996) the missing flux, calculated separately for each cluster, was
typically 30 per cent atz¼0:3 and 23 per cent atz¼0:5. The final
fluxes and K-corrected luminosities are given in Tables 1 and 2.
TheK-corrections and bolometric luminosities were derived in a
self-consistent manner using temperatures estimated from anLX–T
relation. The K-corrections for the estimated temperatures of
1 – 2 keV were in general small (&10 per cent; see Jones et al.
1998). However, given the relatively low signal-to-noise ratios of
the X-ray detections (in the range 6 – 10Þ, the scatter in possible
values ofband the core radius, and the unknown temperatures, we
estimate that the fluxes and luminosities are accurate to no better
than<40 per cent.
3.2 The group and poor cluster sample
The properties of all the group and cluster identifications within the complete survey area are given in Table 2. Other sources, which are candidate groups or clusters, but for which we have insufficient information to be sure, are listed in an appendix. With new HRI data we confirm the hypothesis noted in M98 that source 5 contains a contribution from an AGN as well as from a possible cluster. A point-like, variable, source dominates the HRI emission. The remaining faint extended emission (source 5b) may be associated with a distant cluster of unknown redshift (see below).
Significantly, none of the 5 group or cluster identifications were detected in the HRI image. A visual inspection of the smoothed HRI image confirmed the non-detections. In fact, of all the 96
PSPC sources, the brightestnotdetected in the HRI (source 34) is
identified with a group/cluster. Six of the 18 PSPC sources with
PSPC fluxes between 5£10215 and 1£10214erg cm22s21 are
undetected in the HRI. Of these six, three (or possibly four) are identified optically as groups/clusters, and the others are probably X-ray variable AGN. Because of the poor HRI sensitivity to faint diffuse emission, this result is expected, and supports the identifications with groups/clusters.
In order to confirm the likelihood of non-detection in the HRI, a simulation was performed of an extended source with the PSPC total flux of R34, the brightest source in the sample. A King profile
with a core radius of 0.5 arcmin (or<200 kpc at the redshift of
R34), b¼2=3 and a temperature of 2 keV were assumed.
Fluctuations based on Poisson statistics were included in the
simulation. The total number of HRI counts was<150, but since
the background level was 630 count arcmin22(the same as in the
real HRI image), the maximum significance of the source was
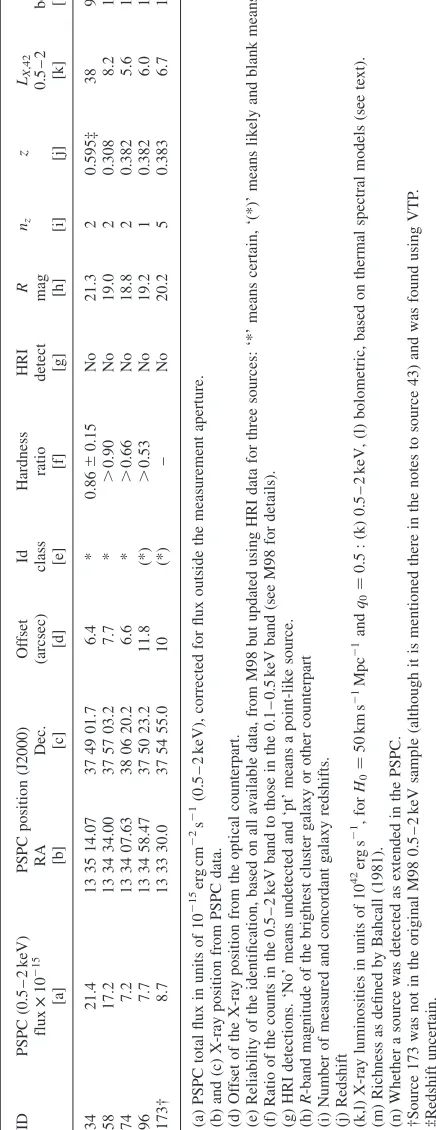
T able 2. Prope rties of the group s and clusters. ID PSPC ð 0 : 5–2 k eV Þ PS PC position (J2000 ) O ff se t Id H ardness H R I Rn z zL X ,42 N
c 0:5
Figure 1.R-band CCD images and overlaid X-ray contours from theROSATPSPCð0:5 – 2 keVÞand from theROSATHRI (dotted lines) of the groups and clusters in the UK deep field. The X-ray contours are at logarithmic intervals of a factor of 1.2 in surface brightness.
R34
R62
R58
R5
R42
R96
R127
R173 R43
R57
3.1s, within a radius of 30 arcsec, and less significant at larger radii. Thus such a source would fall just below the threshold of significant detection.
Recently obtainedChandraandXMM – Newtondata on the UK
deep field confirm that sources 34, 58 and 96 are indeed extended X-ray sources with little point-source contamination. Source 74 may, however, be contaminated by a point-like X-ray source; source 173 is at the very edge of the field and is a marginal detection. A detailed investigation of these data will be presented in a future paper.
The X-ray luminosities of the sources in Table 2 range from
5£1042 to 4£1043erg s21ð0:5 – 2 keVÞ. This luminosity range is
that of groups of galaxies up to poor clusters (e.g. Mulchaey et al. 1996; Ponman et al. 1996).
The optical richness of each system in Table 2 was measured
from ourR-band photometry. TheNc
0:5parameter of Bahcall (1981)
was used as a measure of the galaxy overdensity within a radius of
0:5h21
50 Mpc. A local galaxy background was subtracted for each
system, and a richness correction applied as described by Bahcall (1981). The errors quoted in Table 2 are based on Poisson statistics
only.Nc0:5is not an accurate measure of richness for poor systems
such as these, given the large number of projected foreground and
background galaxies, and only two of the five systems haveNc0:5
detected above 3s significance. The low values ofNc
0:5¼3 – 20
reflect the group and poor cluster nature of the systems; Abell
richness class 0 – 1 clusters typically haveNc
0:5¼10 – 50.
3.3 Sample completeness
The sample of five reliably identified groups and low-luminosity
clusters all have fluxes.7£10215erg cm22s21ð0:5 – 2 keVÞand
are thus in the flux regime where HRI data have confirmed the PSPC positions of point X-ray sources. Three of the five are extended sources in the PSPC data and four have high hardness ratios consistent with the predictions for thermal spectra given in table 6 of M98. The number of confirming galaxy redshifts per group ranges from one to five (see Table 1).
We have identified a further eight candidate groups and clusters (see the appendix), although one (5b) is of low flux, two contain HRI point-like X-ray sources and thus may be dominated by AGN
emission, two are predicted to be atz.1:3, and two are outside
the complete survey area. In addition, there are several unidentified sources in the catalogue of M98 that could be clusters. However, these sources are mostly unidentified because of their faint optical or near-infrared counterparts (Newsam et al. 1997) and thus are likely to be at much higher redshifts (and higher luminosities) than considered here (e.g. one of the unidentified sources is R112, listed
in the appendix as az.1:3 cluster candidate).
We conclude that the sample of five groups and clusters is a
lower limit to the true number, but that for redshiftsz,0:7 it is
reasonably free of uncertainties owing to incompleteness.
We use a limit in total flux of 6£10215erg cm22s21
ð0:5 – 2 keVÞ, higher than that used by M98 for point sources, in
order to be reasonably sure of not missing extended low surface brightness systems. At this flux limit, sources could be detected over the full geometric sky area of the survey unless they exceeded a critical angular size, and thus had a central surface brightness below the background-limited threshold. Assuming a King profile, and within a radius of 45 arcsec, corresponding to our measurement
apertures (300 kpc or <two core radii at z¼0:4Þ, the surface
brightness within two core radii of sources at the flux limit is
detectable at all redshiftsz.0:1. In the 0:3,z,0:7 range used
for the X-ray luminosity function in Section 5, the sample should
be flux-limited, rather than surface-brightness-limited. Atz,0:1,
the large angular sizeðr.1:5 arcminÞof sources at the flux limit
makes them undetectable in our data; however, these sources
would have luminosities LX&3£1041erg s21, which is well
below the luminosities studied here.
3.4 Notes on individual sources
Images of all the confirmed groups and clusters are shown in Fig. 1.
34.The PSPC X-ray data are significantly extended over<1.5
arcmin and the X-ray hardness ratio is high, consistent with a thermal spectrum (see table 6 of M98). A compact group of at least six faint galaxies lies within the 10-arcsec radius PSPC error circle (see Fig. 1). The optical spectra are of insufficient quality to be completely certain of the redshift, but two of the galaxy spectra
show features consistent with CaH- andK- andG-band absorption
lines atz¼0:595. The faint magnitudes of the central galaxies are
consistent with this relatively high redshift. The X-ray luminosity
ð4£1043erg s21Þimplied by this redshift is that of a poor cluster of
galaxies, but the optical appearance of the cluster core is more like that of a compact group, such as Hicksons compact groups. The X-ray luminosity of this source is, however, higher than the luminosity of the diffuse emission in any of the Hickson compact groups studied by Ponman et al. (1996), although here we include in the luminosity any emission from the cluster galaxies. The
galaxies in the core have the absolute magnitudes ofL* galaxies,
and some of them may be in the process of merging to form a luminous central galaxy. No central giant elliptical galaxy is currently observed.
58.The PSPC data show an extended, hard X-ray source (or
possibly a complex region of at least three point sources). Two (early-type) galaxies near the X-ray centroid have identical
redshifts ofz¼0:307^0:001. A third (spiral) galaxy<1 arcmin
further north also has a similar redshift ofz¼0:31.
74.Although no X-ray extension is detected, the hardness ratio
is high and the X-ray centroid is coincident with an excess of
galaxies within a region of radius<30 arcsec. Two of the galaxies
nearest the X-ray centroid have identical absorption-line redshifts
of 0.382. RecentChandradata indicate that a significant fraction of
the quoted X-ray luminosity may arise in a point X-ray source, and further investigation is necessary. However, there is still a probable optical group at this location. The group redshift is very similar to the redshifts of sources 96 and 173, both identified with a group or
cluster. The three sources are 13 – 16 arcmin apart, or 4:9 – 6:0 Mpc
atz¼0:382.
96. A poor cluster is apparently coincident with the X-ray
position, as confirmed by the value ofNc0:5¼21^5:5. The X-rays
show no extension, possibly owing to the low X-ray flux. The redshift of the brightest cluster galaxy is 0.382. This galaxy is a
giant elliptical with MR¼223:2 which hosts an extended radio
source. However, no point X-ray source, indicative of AGN activity, was detected in the HRI exposure.
173. This extended X-ray source was detected by the VTP
algorithm and not listed by M98 because it was not reliably
detected in the 0:5 – 2 keV band by the point-source optimized
algorithm used by M98. Sources 173 and 43 are only 1 arcmin apart and are merged by VTP. We have five concordant galaxy redshifts in this area including the counterpart to source 43, as listed by M98. Although source 43 was not detected at a significant level in
the HRI, a faint X-ray source (at<2.6ssignificance) is present at
lines and is a bright double radio source (the brightest in the
ROSAT field). Together with the X-ray contours and optical appearance shown in Fig. 1, this suggests that source 43 is an outlying AGN in the group, and that the emission from extended source 173, centred near to the brightest galaxy of the group, originates in the hot X-ray gas. The flux was measured in an aperture of radius 36 arcsec centred on source 173, which excluded the flux from source 43.
3.5 Clusters of unusually low X-ray luminosity
During an inspection of theR-band optical images obtained for the
survey, several candidate distant clusters of galaxies unrelated to any X-ray source were noted. These clusters were selected optically, by eye, and in no way form a complete sample. For one
cluster, we have a redshift ofz¼0:519 based on two galaxies with
concordant redshifts (cluster G; RA 13h34m05:s6, Dec. 3785104100,
J2000), allowing us to place an upper limit on the total X-ray
luminosity of the cluster of LX,8£1042erg s21 ð0:5 – 2 keVÞ.
The cluster is only 45 arcsec from quasi-stellar object (QSO) number 101 of M98; allowing for the possibility of confusion has resulted in a relatively high upper limit. Without further redshifts, we cannot be certain that this system is a real cluster and not just a projection effect. Its detectability by eye is a result of it being dominated by a luminous elliptical galaxy. Its apparent optical richness is not greatly higher than that of the other X-ray-selected groups and poor clusters and its X-ray flux may be just below the survey limit. However, the upper limit on the X-ray luminosity is lower than found in other studies of optically selected clusters (e.g. Bower et al. 1994). It may be a cluster in the early stages of formation. However, if it is a real, bound system and its X-ray luminosity is unusually low, then some other interesting possi-bilities are raised, including an unusually high efficiency of galaxy formation, leaving little primordial gas behind, a large injection of energy from AGN or supernovae-driven winds (see Section 5), or a low ICM metal abundance, reducing the soft X-ray luminosity. Further observations are required to clarify the situation.
3.6 Data from otherROSATsurveys
Results based on observations of only one narrow field are subject to biases owing to large-scale structure in the direction of that field. For this reason we have compiled additional group/cluster
detections from the deepROSATPSPC surveys of Hasinger et al.
(1998a), Zamorani et al. (1999) and Bower et al. (1996). For consistency, we only use deep surveys based on PSPC data. In all of these surveys a considerable effort has been made by the authors to identify all of the X-ray sources.
The Lockman hole survey of Hasinger et al. (1998a), Schmidt et al. (1998), and Lehmann et al. (2000) was obtained using 207 ks of PSPC data combined with HRI data. A source detection algorithm employing a maximum-likelihood fit to the PSF was
used. All 50 X-ray sources with fluxes.5.5£10215erg cm22s21
ð0:5 – 2 keVÞhave been identified, resulting in three group/cluster
identifications. All three (numbers 41, 58, 67) are extended X-ray sources with multiple galaxy redshifts per system. We do not include the high-redshift clusters reported in Hasinger et al. (1998b) because these were outside the complete survey area, or below the flux limit of the Hasinger et al. (1998a) PSPC survey.
The survey of Zamorani et al. (1999) used a PSPC exposure of 56 ks on the Marano field. 50 X-ray sources were detected above a
flux limit of 3:7£10215erg cm22s21ð0:5 – 2 keVÞusing the same
source detection algorithm as Hasinger et al. (1998a). Of the 42 sources identified, three were clusters or groups of galaxies with up to three galaxy redshifts per system. None of the unidentified
sources are coincident with an excess of galaxies onR-band CCD
images at R&24, making their identification with clusters or
groups atz,0:7 very unlikely. One of the three clusters has no
spectroscopic redshift; we estimate a redshift ofz<1:1 based on
the magnitude of R¼22:1 of the brightest galaxy given by
Zamorani et al. (1999).
In the deep (79-ks) NEP survey of Bower et al. (1996) identifications were made for 18 out of 20 X-ray sources brighter
than 1£10214erg cm22s21 ð0:5 – 2 keVÞ, including one cluster.
The diffuse extended source in this field identified by Burg et al.
(1992) as a nearby cluster (NEP X1) atz¼0:088 has also been
included. We note that by minimizing the size of the PSPC PSF (by
using the hard 0:5 – 2 keV band) and including the extra exposure of
Bower et al. (1996), NEP X1 breaks up into several components, some of which are consistent with point sources (this can be seen to some extent in fig. 1 of Bower et al.). Thus the true extent of the
diffuse emission is probably considerably less than the 20£
10 arcmin2 claimed by Burg et al. The excess X-ray emission
concentrated in this part of the field may be partly a result of AGN, perhaps associated with the group. We have extrapolated from
the flux within a radius of 2.0 arcmin (270 kpc atz¼0:088Þ to
derive a total flux of 5£10214erg cm22s21and a luminosity of
<2£1042erg s21ð0:5 – 2 keVÞ for NEP X1.
We have remeasured the fluxes of the groups/clusters in these
additional fields from archivalROSATPSPC data using the same
method as for the UK Deep survey field, except that in several (higher signal-to-noise ratio) cases we used a larger aperture, of up to 85-arcsec radius. The limiting total flux adopted here was taken from the published limit for identifications of point X-ray sources, multiplied by the mean ratio of total flux to published flux for the
group/clusters in each survey. This ratio was 1:5 – 1:6 for all three
surveys (see Table 3). The Lockman Hole survey has two flux
limits, corresponding to off-axis angles ,12.5 arcmin and
12:5 – 18:5 arcmin. We have applied the VTP algorithm to the
NEP field to check for undetected low surface brightness extended sources. Two additional candidates were found, but one of these is NEP X1, already included, and the other, although marginally extended, is consistent with most of its flux originating in a point-like X-ray source. We thus expect that at most one or two extended sources at moderate redshifts will be missing.
3.7 Limitations of the data
Given that the number of groups/clusters in some fields is smaller
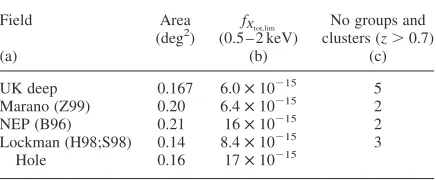
Table 3. Groups and clusters in deepROSATPSPC surveys.
Field Area fXtot,lim No groups and
(deg2) ð0:5 – 2 keVÞ clustersðz.0:7Þ
(a) (b) (c)
UK deep 0.167 6.0£10215 5 Marano (Z99) 0.20 6.4£10215 2 NEP (B96) 0.21 16£10215 2 Lockman (H98;S98) 0.14 8.4£10215 3
Hole 0.16 17£10215
(a) Z99, Zamorani et al. (1999); B96, Bower et al. (1996); H98, Hasinger et al. (1998a); S98, Schmidt et al. (1998).
(b) Limiting total flux adopted here for extended sources (i.e. including flux outside the measurement aperture) in erg cm22s21.
(c) Number of confirmed group/clusters atz.0:7.
than the number of unidentified sources, the group/cluster numbers we derive are strictly lower limits. However, the unidentified sources are usually lacking optical counterparts bright enough for spectroscopic identification, and if they are clusters, they are thus
likely to be atz*1 (e.g. source R112 in the UK deep field and the
tentativez,1:1 cluster identification in the Marano field). They
are almost certainly atz.0:7, the upper limit used here.
The X-ray data are of insufficient resolution and signal-to-noise ratio to allow a correction for the contribution of individual galaxies and AGN to the X-ray luminosities, so the true IGM luminosities are probably lower than the values given here, particularly for the lowest-luminosity systems. In our statistical measurements, we compare with low-redshift X-ray data that were also not corrected in this way, so the comparison is a reasonably
valid one. However, AGN evolution of the form LX/ ð1þzÞ3
implies a higher rate of contamination at higher redshifts, which we have not corrected for.
4 R E S U LT S
4.1 LogN– logSrelation
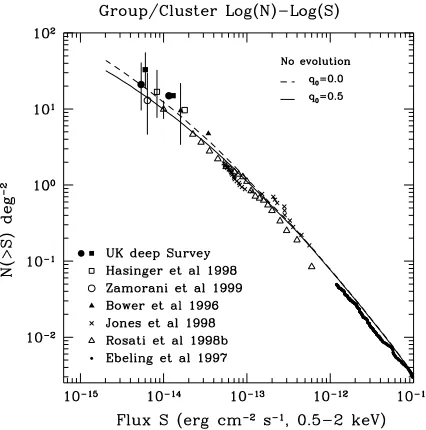
In Fig. 2 we show the binned integral logN– logSrelation of the
various deep surveys as well asROSATcluster surveys at brighter
fluxes. The group/cluster number density of<20 – 30 deg22is the
highest measured in any current X-ray survey and is similar to that found in deep optical searches [e.g. the number density of cluster
candidates found by Postman et al. (1996) was 16 deg22 atI,
22:5 mag and estimated redshifts 0:2,z,1:2, but X-ray
surveys do not have the problems caused by projection effects. The large error bars reflect the small numbers of groups/clusters in each survey, but in general they are consistent with each other and
with the faintest point in the logN– logSrelation of Rosati et al.
(1998), who have located clusters via their extended X-ray
T able 4. Prope rties of the additional candi date group s and clust ers. ID PSPC ð 0 : 5–2 k eV Þ PSPC positi on (J2000 ) O ff se t Id H ardness H R I Rn z zL 0 : 5–2 X (10 42 PSPC flux £ 10 2 15 RA Dec. (arcsec) class ratio detect mag erg s 2 1) ex tend ed? [a] [b] [c] [d] [e] [f] [g] [h] [i] [j] [k] [m] 5b & 4.9 13 34 40.2 37 55 50 – – N o 0 – 49 10.4 13 34 46.97 37 47 48.4 † 0.6 * . 1.10 pt 21.1 1 0.70 9 2 8 51 11.4 13 33 59.88 37 49 11.0 † 0.7 (*) 0 : 54 ^ 0 : 10 pt 17.8 2 0.25 7 3.7 ? 62 9.3 13 35 09.32 37 48 21.7 9.3 * 0 : 62 ^ 0 : 14 N o 18.6 1 0.25 1 2.9 77 7.1 13 35 32.63 37 45 49.0 15.4 (*) 0 : 47 ^ 0 : 12 N o 18.1 2 0.30 7 3.5 99‡ 5.2 13 35 3.81 37 44 18.3 † 2 (*) . 0.52 Y es 2 3 0 * 1.3 * 52 105‡ 4.2 13 34 19.00 37 40 18.6 3.5 (*) 0 : 33 ^ 0 : 09 N o 18.6 0 – – 112 5.1 13 34 35.85 37 54 22.7 8 . 0.43 N o 23.1 0 * 1.3 * 51 ‡Not in com plete samp le area (see fig. 2 o f M98 ) †HR I positi on
Figure 2. Integral logN– logS relation for X-ray-selected groups and
emission in a larger number of shallowerROSATPSPC fields than used here. The deep survey points include a small additive
correc-tion of 3 deg22 for clusters missed at bright fluxes.4£10214
erg cm22s21 because the area of sky sampled was too small to
detect bright clusters.
The field with the highest surface density of groups and clusters is the UK Deep field. The probable reason for this can be seen in Table 2. Of the five systems in this field, three are at almost the
same redshift and are separated by<5 Mpc, suggesting that there
is large-scale structure in this direction atz¼0:382. To account for
this effect, we have constructed the logN– logSrelation (Fig. 2)
and the X-ray luminosity function (Fig. 3) in two ways, both
excluding two of the z¼0:382 systems in the UK Deep field
(shown as solid circles) and including all threez¼0:382 systems
(solid squares). The two systems removed were those with the least reliable identifications (96 and 173), but in practice which two are removed makes little difference as all three have very similar fluxes and luminosities.
Only one of the other X-ray sources of M98 is close in redshift to these three systems, so any large-scale structure does not appear to
effect the redshift distribution of the AGN detected byROSAT.
The no-evolution predictions in Fig. 2 are based on an integration of the local luminosity function of Ebeling et al.
(1997) for luminosities LX.1042erg s21 and redshifts up to
z¼1:5.K-corrections based on anL–Trelation are included. The
counts are consistent with no evolution. In the next section we include redshift information to test whether the luminosity functions are also consistent with no evolution.
4.2 X-ray luminosity function
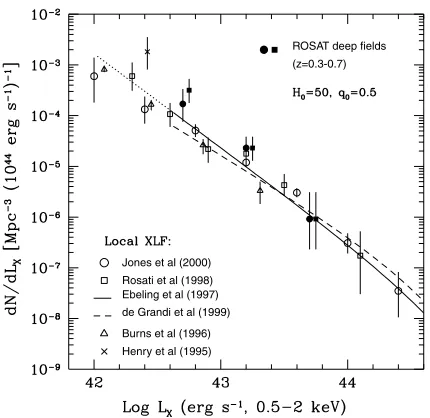
The X-ray luminosity function of the 11 groups and clusters at
0:3,z,0:7 from all four surveys combined is shown in Fig. 3
(filled squares). The mean redshift is z¼0:46 and the redshift
range isz¼0:31 – 0:63. The filled circles in Fig. 3 show the effect
of removing two of the three groups atz¼0:382 in the UK deep
field, under the assumption that their presence is a result of large-scale structure. Comparison with local luminosity functions, which
were converted to the 0:5 – 2 keV passband and toH0¼50 where
necessary, shows that these data are consistent with no evolution (or a small degree of positive evolution) of the X-ray luminosity
function of groups and poor clusters to redshiftsz,0:5.
The discrepant Henry et al. (1995) point, whilst notable for being the first statistical determination of group X-ray properties, was based on a sample size of only three groups and may have been affected by large-scale structure. The deepest previous survey with measured redshifts is that of Rosati et al. (1998; Rosati 1998) who
did not sample luminosities below 1043erg s21atz.0:25.
The luminosity function was calculated using the 1/Vastatistic
of Avni & Bachall (1980). Luminosities were calculated in an
iterative manner using theL–Trelation of White, Jones & Forman
(1997) to estimate temperatures and hence deriveK-corrections.
Search volumes were derived usingK-corrected luminosities and
the limits in total flux and survey areas given in Table 3.
5 D I S C U S S I O N
This is a small sample of groups and poor clusters but it probes
lower luminosities than previous studies at high redshiftsðz.0:3Þ.
We find no evidence for evolution of the X-ray luminosity function
at the luminosities of groups and poor clustersðLX&1043erg s21Þ,
up to redshifts z<0:5, confirming and extending the results of
other X-ray cluster surveys.
The global evolution of the number density of groups based on their X-ray luminosities is a poor probe of cosmological parameters (e.g. Balogh et al. 1999). In an open Universe, most
groups are predicted to form atz*2 – 3 (e.g. Governato, Tozzi &
Cavaliere 1996). Even in an V¼1 Universe, most groups are
predicted to form at epochs beyond the reach of current observations (e.g. Eke, Cole & Frenk 1996).
However, the thermal history of the X-ray gas in groups may be affected significantly by non-gravitational energy input from AGN or supernovae at a level that is insignificant in the deep potentials of massive clusters. This non-gravitational energy input can be probed via measurements of the evolution of the X-ray properties of groups. The X-ray luminosity of the IGM is sensitive to the degree and epoch of the energy injection. Energy injection inflates the X-ray gas, reducing its density and hence its X-ray luminosity. Heating of the X-ray gas before it fell into group and cluster potentials was originally suggested (Kaiser 1991; Evrard & Henry 1991) in order to break the self-similar scaling prediction (Kaiser 1986) of strong positive evolution of the XLF; the X-ray luminosity of groups would be decreased by a larger factor than that of clusters. Non-gravitational energy injection also explains the shape
of the observedLX–Trelation and the entropy floor of groups, as
discussed in the introduction.
The origin and epoch of the energy injection is unknown. Kinetic energy from AGN jets or outflows, or supernova-driven galaxy winds, have been suggested (e.g. Valageas & Silk 1999), either before (e.g. Ponman et al. 1999), during, or after cluster collapse (e.g. Lowenstein 2000). The observed lack of evolution of
the X-ray luminosity function toz¼0:5 at the low luminosities of
galaxy groups suggests that the thermal properties of the X-ray gas has not altered significantly over the corresponding look-back time
of<6 Gyr. Thus the epoch of energy injection must have been
largely atz.0:5.
Figure 3. Evolution of the X-ray luminosity function at the low
luminosities of groups and poor clusters. The combined high-redshift data from fourROSATdeep surveys are shown for all groups and clusters (filled squares) and without the possible excess of groups caused by large-scale structure in the UK Deep field (filled circles, offset along thex-axis for clarity). A variety of local measurementsðz.0:3Þare also shown.
5.1 Energy injection history based on the star-formation rate
Several authors (Menci & Cavaliere 2000; Wu et al. 2000; Bower et al. 2000) have made theoretical progress by extending semi-analytic models of galaxy formation and evolution to include the hot, X-ray-emitting gas phase predicted to be at the virial temperatures of haloes of galaxy mass and larger. In the models, the cooling of this gas via X-ray emission allows a galaxy to form. The cooling gas may be reheated by stellar and supernova-driven winds, the strength of which depends on the star-formation rate in the galaxy. The mass of infalling gas which will form stars is limited by the fraction of the gas that is heated, and possibly ejected, by this feedback mechanism. The net result is that energy is injected into the IGM and less gas is converted into stars. Feedback is required in the models, especially in high-redshift, low-mass but dense haloes, to prevent a ‘cooling catastrophe’ (White & Rees 1978) and an overproduction of dwarf galaxies.
If the model parameters of Menci & Cavaliere (2000) controlling the star-formation time-scale and the feedback are set to produce strong feedback in low-mass haloes and match the local galaxy luminosity function (their model A), then the star-formation
rate peaks atz<1:5, and declines atz,1 andz.2, as in the
original Madau – Lilly plot (Madau et al. 1996). The energy input into the IGM from the strong feedback results in a prediction of a
small amount of evolution of the group XLF atz¼0:5, which is
within the observed limits. Similarly, Bower et al. (2000) predict very little evolution of the XLF of groups if the energy input rate follows the star-formation rate of the semi-analytical model of Cole et al. (2000).
If the model feedback of Menci & Cavaliere (2000) in low-mass haloes is severely reduced (an extreme case), the star-formation
rate atz.2 becomes constant with redshift, in agreement with
extinction-corrected star-formation histories. In this case the hot
gas is retained in shallow potentials, increasingLX, and strong
positive evolution of the XLF at group luminosities is predicted (by
a factor <30 at z¼1 andLX¼1042:5erg s21Þ. Atz¼0:5, the
epoch observed here, the evolution predicted is significantly less
than atz¼1 (by a factor of<4.5; Menci, private communication)
but is still only marginally consistent with the observed XLF (and may also be inconsistent with the residual X-ray background at 0.25 keV; Pen 1999). Our observations thus support the need for feedback in semi-analytic models.
5.2 Other energy injection histories
Not all the excess energy may come from supernovae and star-formation-related activity. Several authors (e.g. Valageas & Silk 1999; Wu et al. 2000; Kravtsov & Yepes 2000; Bower et al. 2000)
have emphasized that the energy required (,0.5 – 3 keV particle21,
depending on the epoch) can only be supplied by supernovae if most of the kinetic energy of each explosion goes into heating the IGM. AGN, on the other hand, can easily meet the energetic requirements.
The X-ray properties of groups at high redshifts can be used to constrain the epoch of energy injection, irrespective of the origin of the energy. More energy input is required [to produce the excess entropy of Ponman et al. (1999)] if it is injected at high redshifts when collapsed systems were denser. More energy input inflates the X-ray gas, decreases the central density, and produces lower X-ray luminosities. If all the non-gravitational heating occurs at
very high redshifts ðz.2Þ, Bower et al. (2000) predict that at
z<2 groups have significantly lower luminosities (for a given
temperature) compared withz¼0, and that the space density of
low-luminosityðLX¼1043erg s21Þsystems is lower than atz¼0.
However, only a very small degree of evolution of the XLF is
predicted betweenz¼0 and 0.5 (Bower, private communication),
consistent with the observations. Other, pre-heating, models, in which the energy injection occurred at very early epochs, before the groups collapsed, similarly predict little or no evolution of the
XLF at z,0:5 andLX¼1043erg s21 (e.g. Kaiser 1991; Bower
1997).
If the rate of energy injection is constant with redshift, the space
density ofLX¼1043erg s21systems is predicted to be a factor of
<3 higher at z¼0:5 than at z¼0 (Bower, private
communi-cation), just consistent with the observed XLF.
5.3 Implications for future and current deep cluster surveys
Whilst the results described here were based on deep ROSAT
surveys, they represent the population which serendipitous
Chandra, and particularlyXMM – Newton, surveys using typical
exposures are sampling. Thus the properties of large numbers of very low-luminosity groups at moderate redshifts, and poor
clusters at high redshifts ðz*1Þ, will soon become accessible.
Measurements of the evolution of large-scale structure will be possible with contiguous surveys. We have already started to sample the large-scale structure in this single field. A large improvement in the statistical accuracy of the XLF will be achieved, reaching lower luminosities than sampled here, and with sufficient spatial resolution to remove the X-ray emission from AGN within the groups. Important additional diagnostics will be
provided by deepXMM – Newtonsurveys, which will measure the
evolution of the groupLX–Trelation and metallicities of groups at
high redshifts. Major observational advances in the evolution of groups of galaxies are expected.
6 C O N C L U S I O N S
We have identified groups and poor clusters of galaxies, via their
X-ray emission, at high redshifts z,0:3 – 0:6. These bound
systems, confirmed as such by their X-ray emission, represent some of the lowest X-ray luminosity (and probably lowest-mass) overdensities yet found at moderate to high redshifts. These observations support, and extend to groups of galaxies, the growing consensus from several deep cluster surveys that there is little or no evolution of the cluster X-ray luminosity function to high redshifts
ðz,0:8Þat moderate X-ray luminosities.
The X-ray luminosity evolution of low-mass galaxy groups is particularly sensitive to the thermal history of the X-ray gas, including non-gravitational processes. Massive, luminous clusters are better suited to deriving cosmological parameters. Our results are consistent either with no evolution, or slight positive evolution, of the X-ray luminosity function at the luminosities of groups and
poor clusters, to z¼0:5. The evolution of the group X-ray
luminosity function can constrain the epoch of non-gravitational energy injection into the intragroup medium (caused by supernova-driven winds or AGN). The current results suggest that any such
energy injection occurred mostly at redshiftsz.0:5. Examples of
energy injection histories consistent with our results are those that follow the star-formation rate, at least in semi-analytical models of galaxy formation that include feedback, and pre-heating models in
which the energy injection occurred atz*2.
common, but poorly studied, environment. Galaxy evolution in groups is predicted to differ from evolution in rich clusters or in the field because the low velocity dispersion and relatively high galaxy density favour merging, tidally triggered star formation and other galaxy – galaxy interactions.
A C K N O W L E D G M E N T S
We are grateful to Harald Ebeling for providing VTP flux corrections and to Nicola Menci and Richard Bower for providing model predictions. The VTP source searching was initially done for the WARPS cluster survey (Scharf et al. 1997). This research has made use of data obtained from the Leicester Data base and Archive Service at the Department of Physics and Astronomy, Leicester University. Analysis was performed on Starlink computing facilities. LRJ acknowledges PPARC support.
R E F E R E N C E S
Allington-Smith J. R., Ellis R. S., Zirbel E. L., Oemler A., 1993, ApJ, 404, 521
Avni Y., Bachall J. N., 1980, ApJ, 235, 694 Bahcall N. A., 1981, ApJ, 247, 787
Balogh M. L., Babul A., Patton D. R., 1999, MNRAS, 307, 463 Bower R. G., 1997, MNRAS, 288, 355
Bower R. G., Bohringer H., Briel U. G., Ellis R. S., Castander F. J., Couch W. J., 1994, MNRAS, 268, 345
Bower R. G. et al., 1996, MNRAS, 281, 59
Bower R. G., Benson A. J., Baugh C. M., Cole S., Frenk C. S., Lacey C. G., 2000, MNRAS, submitted (astro-ph/0006109)
Bryan G. L., 2000, ApJ, 544, L1 Burg R. et al., 1992, A&A, 259, L9
Burke D. J., Collins C. A., Sharples R. M., Romer A. K., Holden B. P., Nichol R. C., 1997, ApJ, 488, L83
Burns J. O., Ledlow M. J., Loken C., Klypin A., Voges W., Bryan G. L., Norman M. L., White R. A., 1996, ApJ, 467, L49
Canizares C. R., Fabbiano G., Trinchieri G., 1987, ApJ, 312, 503 Cavaliere A., Menci N., Tozzi P., 1997, ApJ, 484, L1
Cavaliere A., Menci N., Tozzi P., 1999, MNRAS, 308, 599
Cole S., Lacey C. G., Baugh C. M., Frenk C. S., 2000, MNRAS, 319, 168 Collins C. A., Mann R. G., 1998, MNRAS, 297, 128
De Grandi S. et al., 1999, ApJ, 513, L17
Ebeling H., Wiedenmann G., 1993, Phys. Rev. 47, 704
Ebeling H., Edge A., Fabian A. C., Allen S. W., Crawford C. S., Bohringer H., 1997, ApJ, 479, L101
Eke V. R., Cole S., Frenk C. S., 1996, MNRAS, 282, 263 Evrard A. E., Henry J. P., 1991, ApJ, 383, 95
Fairley B. W., Jones L. R., Scharf C., Ebeling H., Perlman E., Horner D., Wegner G., Malkan M., 2000, MNRAS, 315, 669
Fukugita M., Hogan C. J., Peebles P. J. E., 1998, ApJ, 503, 518 Governato F., Tozzi P., Cavaliere A., 1996, ApJ, 458, 18
Hasinger G., Burg R., Giacconi R., Schmidt M., Trumper J., Zamorani G., 1998a, A&A, 329, 482
Hasinger G. et al., 1998b, A&A, 340, L27 Henry J. P. et al., 1995, ApJ, 449, 422
Jones L. R., Scharf C. A., Ebeling H., Perlman E., Wegner G., Malkan M., Horner D., 1998, ApJ, 495, 100
Jones L. R., Ebeling H., Scharf C. A., Perlman E., Horner D., Fairley B., Wegner G., Malkan M., 2000a, in Durret F., Gerbal D., eds, Construct-ing the Universe with Clusters of Galaxies. Institute d’Astrophysique de Paris, Paris
Jones L. R., Ponman T. J., Forbes D. A., 2000b, MNRAS, 312, 139 Kaiser N., 1986, MNRAS, 222, 323
Kaiser N., 1991, MNRAS, 383, 104
Kravtsov A. V., Yepes G., 2000, MNRAS, 318, 227 Lehmann I. et al., 2000, A&A, 354, 35
Lloyd-Davies E. J., Ponman T. J., Cannon D. B., 2000, MNRAS, 315, 689 Lowenstein M., 2000, ApJ, 532, 17
Madau P., Ferguson H. C., Dickinson M. E., Giavalisco M., Steidel C. C., Fruchter A., 1996, MNRAS, 283, 1388
Menci N., Cavaliere A., 2000, MNRAS, 311, 50 McHardy I. M. et al., 1998, MNRAS, 295, 641 (M98)
Mulchaey J. S., Davis D. S., Mushotzky R. F., Burnstein D., 1996, ApJ, 456, 80
Mushotzky R. F., Cowie L. L., Barger A. J., Arnaud K. A., 2000, Nat, 404, 459
Newsam A. M., McHardy I. M., Jones L. R., Mason K. O., 1997, MNRAS, 292, 378
Pen U.-L., 1999, ApJ, 510, L1
Ponman T. J., Bourner P. D. J., Ebeling H., Bohringer H., 1996, MNRAS, 283, 690
Ponman T. J., Cannon D. B., Navarro J. F., 1999, Nat, 397, 135 Postman M., Lubin L. M., Gunn J. E., Oke J. B., Hoessel J. G., Schneider
D. P., Christensen J. A., 1996, AJ, 111, 615 Romer A. K. et al., 2000, ApJS, 126, 209
Rosati P., 1998, in D’Odorico S., Fontana A., Giallongo E., eds, ASP Conf. Ser. Vol. 146, Proc. of the Young Universe: Galaxy Formation and Evolution at Intermediate and High Redshift. Astron. Soc. Pac., San Francisco, p. 476
Rosati P., Della Ceca R., Norman C., Giacconi R., 1998, ApJ, 492, L21 Scharf C., Jones L. R., Ebeling H., Perlman E., Malkan M., Wegner G.,
1997, ApJ, 477, 79
Schmidt M. et al., 1998, A&A, 329, 495
Snowden S. L., Plucinsky P. P., Briel U., Hasinger G., Pfeffermann E., 1992, ApJ, 393, 819
Tozzi P., Norman C., 2001, ApJ, 546, 63 Tully R. B., 1987, ApJ, 321, 280 Valageas P., Silk J., 1999, A&A, 350, 725
Vikhlinin A., McNamara B. R., Forman W., Jones C., Quintana H., Hornstrup A., 1998, ApJ, 502, 558
White D. A., Jones C., Forman W., 1997, MNRAS, 292, 419 White S. D. M., Rees M., 1978, MNRAS, 183, 341
Wu K. K. S., Fabian A. C., Nulsen P. E. J., 1998, MNRAS, 301, L20 Wu K. K. S., Fabian A. C., Nulsen P. E. J., 2000, MNRAS, 318, 889 Zamorani G. et al., 1999, A&A, 346, 731
A P P E N D I X A : O T H E R C A N D I D AT E G R O U P S A N D C L U S T E R S
In this appendix we give descriptions of the additional candidate groups and clusters.
5.M98 noted that this source is in a confused area. The PSPC
X-ray source consists of a dominant point-like source with a fainter, possibly extended, component to the SW. There are several pieces of evidence suggesting that the dominant source is not a
cluster. The PSPC hardness ratioð0:37^0:03Þis inconsistent with
the hardness ratios of the confirmed group and clusters, and with that predicted for thermal X-ray spectra (see M98). The HRI data are consistent with a point-like source, and finally the PSPC count rates in both the hard and soft bands vary significantly (and consistently) between the two PSPC observation epochs, separated by 2 yr. After measuring and subtracting the point-source flux within an aperture of radius 30 arcsec (containing 90 per cent of the
1 keV flux), the remaining total extended PSPC flux is &4.9£
10215erg cm22s21, below the flux limit considered here. As noted
by M98, this source (which we label 5b) is coincident with an excess of faint galaxies, the redshifts of which are unknown. A nearby stellar object is also a possible counterpart to source 5b.
49.An absorption-line galaxy at a redshift ofz¼0:709 lies only
0.6 arcsec from the HRI position, which confirms the PSPC counter-part. The optical spectrum of the galaxy is of low signal-to-noise
ratio. No excess of galaxies is visible to a limit inR<3:5 mag fainter than this galaxy. The mere fact of detection in the HRI suggests that the X-ray emission does not originate in an extended intracluster medium, but in a point source associated with the
galaxy. The X-ray luminosityð3£1043erg s21Þis, however, much
higher than expected for a normal galaxy, and this source may be
similar to the sources found in deepChandrasurveys that have
optically unremarkable late-type galaxy counterparts (e.g. Mushotzky et al. 2000). It is unlikely to originate in a cluster.
51. The X-ray source has at least two components. An HRI
detection of a point source coincident with an absorption-line
galaxy atz¼0:257 (confirming the PSPC position) suggests that
the tentative identification of M98 with a narrow-emission-line galaxy was incorrect. As noted by M98, the X-ray data are consistent with two point sources, although some contribution from an extended intragroup medium is possible. There are several
R¼18 – 19 mag galaxies nearby, but none of the four measured
redshifts falls within 1000 km s21of any of the others, suggesting
that the excess of galaxies is partly a projection effect. The HRI detection (with a flux consistent with the PSPC flux) suggests that
most of the X-ray emission originates in thez¼0:257
absorption-line galaxy rather than in an intragroup medium. The galaxy is
luminous opticallyðMR¼223:5Þand in the X-ray band ðLX¼
4£1042erg s21Þand has logðLbol
X /LBÞ<21:8, higher than that of
any of the 81 early-type galaxies studied by Canizares, Fabbiano & Trinchieri (1987). It may contain an AGN, like the early-type
galaxy counterparts to sources detected in deepChandrasurveys,
although no optical emission lines are observed.
62.A luminousðMR¼222:7Þgalaxy at a redshift ofz¼0:251
lies 9 arcsec from the PSPC position and there is a small excess of
fainter galaxiesðR.19Þnearby. The X-ray source is unresolved
by the PSPC, but is undetected by the HRI, suggesting that it is
either a low-luminosity ðLX¼2:9£1042erg s21Þ, compact
extended source (of extent <10 – 20 arcsec or 50 – 100 kpc at
z¼0:251Þ, or a variable point source. There are no optical objects
of stellar appearance withR,24:5 in the error circle, which could
be QSOs, but rather several faintðR,22Þgalaxies. The source
could be a poor group dominated by the luminous galaxy (with the lowest X-ray luminosity of any system in the group/cluster sample), but the positional offset of the luminous galaxy makes this uncertain.
77.A very luminous elliptical galaxy ofMR<223:7 (<3L*)
with an absorption-line spectrum at a redshift ofz¼0:307 is the
probable counterpart to the X-ray source. A second, nearby, fainter galaxy has the same redshift. The lack of an obvious excess of galaxies to a limit 6 mag fainter than that of the bright galaxy and
the low X-ray luminosityð3:4£1042erg s21Þsuggest that a large
fraction of the X-ray emission may originate in an individual elliptical galaxy rather than in an intragroup medium, although the
value of logðLbol
X /LBÞ<21:9 is higher than that of any of the
early-type galaxies of Canizares et al. (1987). The source may be a fossil group of the type studied by Jones et al. (2000b). The offset between the X-ray centroid and the brightest galaxy is large (15 arcsec), but this source is the furthest off-axis in the PSPC of any in the sample. At this off-axis angle (14 arcmin), the PSPC 1-keV PSF is almost double the size of the on-axis value, so larger position errors are expected. Additional position errors may have occurred because source 98 (of M98) is only 50-arcsec away (i.e. the FWHM of the off-axis PSF). Alternatively, the counterpart
may be a variable AGN, undetected in the HRI and with R.
24:5 mag at the epoch of the optical imaging.
99.Although this source is outside the complete survey area, it is
potentially of interest. It is listed by M98 as a blank field (i.e. no
counterpart withR,23 magÞ. A possible extremely distant cluster
of galaxies lies 20 arcsec south of the PSPC position. The likely
brightest cluster galaxy (BCG) has R*23 mag, giving an
estimated redshiftz*1:3, where the redshift has been estimated
from the BCG magnitude by extrapolating the relation of Vikhlinin et al. (1998). However, the detection in the HRI data of a X-ray
source coincident with aR¼23 mag galaxy 9-arcsec south of the
PSPC position suggests that this galaxy is the counterpart, and not the intracluster medium of the possible distant cluster.
This source is also outside the complete survey area but we list it
here because a compact group of three galaxies ofR<18 mag lie
within the PSPC error box. The redshifts are unknown, but based
on the BCG magnitude probably lie in the rangez¼0:25 – 0:3.
This source is potentially an extremely distant cluster. It is listed
by M98 as a blank field. A galaxy ofR¼23:1 mag surrounded by
several fainter galaxies lies within the PSPC error circle.
Near-infraredK-band imaging (Newsam et al. 1997) shows that many of
the galaxies of very red; the brightest hasR2K¼4:2^0:4 and
R2I¼1:6 (to be compared withR2K¼2:6 andR2I¼0:6
for zero-redshift ellipticals). If this galaxy is the BCG of a cluster,
then the redshift estimated from itsR-band magnitude isz*1:3,
and from its K¼18:9 mag, involving a less uncertain
extra-polation,z<1:5 (using fig. 2 of Collins & Mann 1998). The X-ray
luminosity of the cluster, even at this high redshift, is
,1044erg s21, so it would be a typical, sub-L* cluster rather
than a luminous, rich cluster.