Trojan Detection using Genetic Algorithm and
Boolean Satisfiability
Sayandeep Saha1, Rajat Subhra Chakraborty1, Srinivasa Shashank Nuthakki2, Anshul1, and Debdeep Mukhopadhyay1
1 Department of Computer Science and Engineering 2
Department of Electronics and Electrical Communication Engineering Indian Institute of Technology Kharagpur
Kharagpur–721302, India
E-mail:{sahasayandeep91,rschakraborty,debdeep}@cse.iitkgp.ernet.in
Abstract. Test generation for Hardware Trojan Horses (HTH) detec-tion is extremely challenging, as Trojans are designed to be triggered by very rare logic conditions at internal nodes of the circuit. In this paper, we propose aGenetic Algorithm (GA) based Automatic Test Pattern Generation (ATPG) technique, enhanced by automated solution to an associatedBoolean Satisfiability problem. The main insight is that given a specific internal trigger condition, it is not possible to attack an ar-bitrary node (payload) of the circuit, as the effect of the induced logic malfunction by the HTH might not get propagated to the output. Based on this observation, a fault simulation based framework has been pro-posed, which enumerates the feasible payload nodes for a specific trig-gering condition. Subsequently, a compact set of test vectors is selected based on their ability to detect the logic malfunction at the feasible pay-load nodes, thus increasing their effectiveness. Test vectors generated by the proposed scheme were found to achieve higher detection coverage over large population of HTH in ISCAS benchmark circuits, compared to a previously proposed logic testing based Trojan detection technique.
1
Introduction
Modern electronic design and manufacturing practices make a design vulnerable to malicious modifications. Malicious circuitry embedded as a result of such modifications, commonly referred to as Hardware Trojan Horses (HTHs), have been demonstrated to be potent threats [6]. The stealthy nature of HTHs help them to evade conventional post-manufacturing testing. Once deployed in-field, HTHs get activated under certain rare conditions (depending on internal or external stimulus), and can potentially cause disastrous functional failure or leakage of secret information.
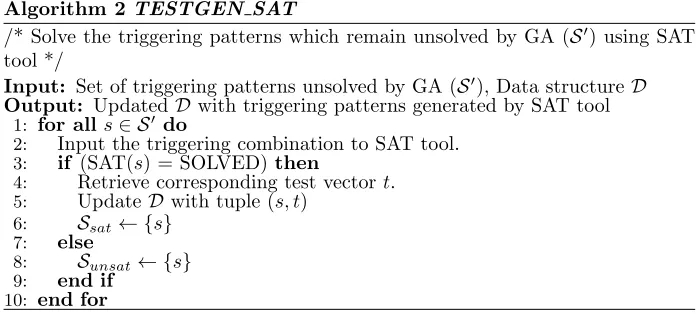
Fig. 1.Motivational example: variation of trigger and Trojan coverage with rareness threshold (θ) by theMERO [5] technique for c7552 (a) on sets of Trojans considered as in [5]; (b) on a set of rarely triggered Trojans (effective triggering probability below 10−6).
and leakage power) in the presence of HTH in the circuit [2, 11, 19]. However, side-channel approaches are susceptible to experimental and process variation noise. Thus, detection of small Trojans, especially combinatorial ones, becomes challenging through these approaches. Another approach is to employ design modification techniques to either prevent Trojan insertion or to make inserted Trojans more easily detectable [3, 17, 20].
An adversary may use very rare internal logic conditions to trigger a HTH, so that it remains well hidden during testing. Usually, it is assumed that the attacker will generate the trigger signal form a combination of internal nets of the circuit whose transition probability is very low. She may try to activate them simultaneously to their rare values thus achieving an extremely low triggering probability. Based on this assumption, several Trojan detection techniques have been proposed till date [5, 17] which try to activate the Trojans either fully or partially by triggering the rare nodes, thus creating anomaly at the output logic values, or in some side channel signals viz. transient power. In [17, 21] the authors proposed a design-for-testability (DFT) technique which inserts dummy scan flip-flops to make the transition probability of low transition nets higher in a special “authentication mode”. However, it was found that careful attackers can evade this scheme easily [18]. Another powerful DFT technique is obfuscating or encrypting the design by inserting some extra gates in it [3, 7], so that the actual functionality of the circuit is hidden, consequently making it difficult for an adversary to estimate the actual transition probabilities at the internal nodes. However, such “logic encryption” schemes have been recently broken [14].
Observing the vulnerability of DFT techniques against intelligent attackers, in [5] a test pattern generation scheme called MERO was proposed. MERO
test generation is continued until each of the nodes gets activated to their rare values at least N-times. It was shown through simple theoretical analysis and experimental results that ifN is sufficiently large, then a Trojan whose trigger condition is composed jointly of rare values at these rare nodes, is highly likely to be activated by the application of this test set.
AlthoughMERO proposes a relatively simple heuristic for test generation it is found to have the following shortcomings:
1. When tested on a set of “hard-to-trigger” Trojans (withtriggering probability
in the range of 10−6 or less), the test vector set generated by MERO was found to have poor coverage both over triggering combinations and Trojans. Fig. 1(b) presents the variation of trigger and Trojan coverage with the
rareness threshold(θ) value for the ISCAS–85 circuit c7552, where the Trojan trigger probability is theeffective Trojan triggering probability considering all the nodes together, unlike in [5], which considered trigger probability at individual nodes (see Fig. 1(a)). It was found that best coverage was achieved forθ in the range 0.08−0.12, and this trend was consistent for all the benchmark circuits considered. However, the best achievable coverage was still below 50%, for even circuits of moderate size like c7552.
2. Although individual activation of each individual rare nodes at leastN-times increases the activation probability of rare node combinations on average, there is always a finite probability that combinations with extremely low activation probability will not be triggered for a given value of N. As a result, even for small ISCAS–85 circuits like c432, theMEROtest generation method misses some rare node patterns even after several independent runs. This fact can be utilized by an intelligent adversary.
3. MERO explores a relatively small numbers of test vectors, as the heuristic perturbs only a single bit at a time of an obtained test vector to generate new test vectors.
4. Another problem with theMEROalgorithm is that,while generating the test vectors, it only considers the activation of the triggering con-ditions, and ignores whether the triggered Trojan actually caused any logic malfunction at the primary output of the circuit under test.
1.1 Main Idea and Our Contribution
reasonably good test coverage over the fault list very quickly, because of the inherent parallelism of GA which enables relatively rapid exploration of a search space. However, it does not guarantee the detection of all possible faults, specially for those which are hard to detect. On the other hand, SAT based test generation has been found to be remarkably useful for hard-to-detect faults. However, it targets the faults one by one, and thus incurs higher execution time for easy-to-detect faults which typically represent the majority of faults [8]. It has another interesting feature that it can declare whether a fault is untestable or not.
In case of HTH, the number of candidate trigger combinations has an ex-ponential dependence on the number of rare nodes considered. Even if we limit the number of Trojan inputs to four (because of VLSI design and side–channel information leakage considerations), the count is quite large. Thus, we have a large candidate trigger list and it is not possible to handle each fault in that list sequentially. However, many of these trigger conditions are not actually satisfi-able, and thus cannot constitute a feasible trigger. Hence, we combine the “best of both worlds” for GA and SAT based test generation. The rationale is that most of the easy-to-excite trigger conditions, as well as a significant number of hard-to-excite trigger conditions will be detected by the GA within reasonable execution time. The remaining unresolved trigger patterns are input to the SAT tool; if any of these trigger conditions is feasible, then SAT returns the corre-sponding test vector. Otherwise, the pattern will be declared unsolvable by the SAT tool itself. As we show later, this combined strategy is found to perform significantly better thanMERO. In the second phase of the scheme, we refine the test set generated by GA and SAT, by judging its effectiveness from the perspec-tive of potency of the triggered Trojans. For each feasible trigger combination found in the previous step, we find most of the possible payloads using a fault simulator. For this,we model the effect of each Trojan instance (defined by a combination of a feasible trigger condition and the payload node) as a stuck-at fault, and test whether the fault can be propagated to the output by the same test vector which triggered the Trojan. This step helps to find out a compact test set which remarkably improves the Trojan coverage.To sum up, the following are the main contributions of this paper:
1. An improved ATPG heuristic for small combinational and sequential HTH detection is presented which utilizes two well known computational tools, GA and SAT. The proposed heuristic is able to detect HTH instances triggered by extremely rare internal node conditions, while having acceptable execu-tion time. Previous work has reported that partial activaexecu-tion of the Trojan with accompanying high sensitivity side channel analysis is quite effective in detecting large HTHs [17], but not so effective for ultra-small Trojans. Hence, our work fills an important gap in the current research.
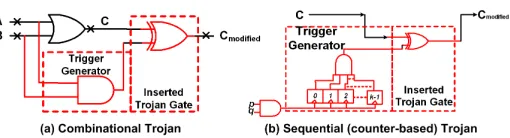
Fig. 2. Example of (a) combinational and (b) sequential (counter-like) Trojan. The combinational Trojan is triggered by the simultaneous occurrence of logic–1 at two internal nodes. The sequential (counter-like) Trojan is triggered by 2kpositive (0→1) transitions at the input of the flip-flops.
3. The relative efficacy of the proposed scheme with respect to the scheme proposed in [5] has been demonstrated through experimental results on a subset of ISCAS–85 and ISCAS–89 circuits.
4. Since the triggering condition, corresponding triggering test vectors, as well as the possible payload information for each of the feasible triggers are gen-erated during the execution, a valuable Trojan database for each circuit is created, which may be utilized for diagnosis purposes too. This database is enhanced for multiple runs of the algorithm, because of the inherent ran-domized nature of the GA which enables newer portions of the Trojan design space to be explored.
The rest of the paper is organized as follows. Section-2 presents a brief intro-duction to GA and SAT, as relevant in the context of ATPG for Trojan detection. The complete ATPG scheme is described in Section-3. Experimental results are presented and analyzed in Section-4, along with discussions on the possible ap-plication of the proposed scheme for Trojan diagnosis and side channel analysis based Trojan detection. The paper is concluded in Section-5, with directions of future work.
2
GA and SAT in the Context of ATPG for Trojan
Detection
2.1 Hardware Trojan Models
We consider simple combinational and sequential HTHs, where a HTH instance is triggered by the simultaneous occurrence of rare logic values at one or more internal nodes of the circuit. We find the rare nodes (R) of the circuit with a probabilistic analysis. Details of this analysis can be found in [17, 21]. Once activated, the Trojan flips the logic value at an internal payload node. Fig. 2 shows the type of Trojans considered by us.
depends on the size of the circuit being analyzed. Since we are interested only in small Trojans, a random sample S of up to four rare node combinations is considered. Let us denote the set of rare nodes asR, with|R|=rfor a specific rareness threshold (θ). The set of all possible rare node combinations is then the power set of R, denoted by 2R). Thus, the population of Trojans under consideration is the setK, whereK ⊆2Rand|K|is r1
+ r2
+ r3
+ r4
. Thus, S ⊆ K.
We intentionally choseθ= 0.1 for our experiments, which is lower than the value considered in [5] (θ= 0.2). The choice is based on the observed coverage trends of our experiments on “hard-to-trigger” Trojans in Section 1, where it was observed that the coverage is maximized forθvalues in the range 0.08−0.12 for most ISCAS benchmark circuits.
2.2 Genetic Algorithm (GA) for ATPG
Genetic algorithm (GA) is an well known bio-inspired, stochastic, evolutionary search algorithm based upon the principles of natural selection [10]. GA has been widely used in diverse fields to tackle difficult non-convex optimization problems, both in discrete and continuous domains. In GA, the quality of a feasible solu-tion is improved iteratively, based on computasolu-tions that mimic basic genetic operations in the biological world. The quality of the solution is estimated by evaluating the numerical value of an objective function, usually termed the “fit-ness function” in GA. In the domain of VLSI testing, it has been successfully used for difficult test generation and diagnosis problems [15]. In the proposed scheme, GA has been used as a tool to automatically generate quality test pat-terns for Trojan triggering. During test generation using GA, two points were emphasized:
– an effort to generate test vectors that would activate the most number of sampled trigger combinations, and,
– an effort to generate test vectors for hard-to-trigger combinations.
However, as mentioned in the previous section, the major effort for GA was dedicated to meet the first objective.
To meet both of the goals, we used a special data structure as well as a proper fitness function. The data structure is a hash table which contains the triggering combinations and their corresponding activating test vectors. LetS denote the sampled set of trigger conditions being considered. Each entry in the hash table (D) is a tuple (s,{ti}), wheres∈ Sis a trigger combination from the sampled set
(S) and{ti}is the set of distinct test vectors activating the trigger combination
s. Note that, a single test vector ti may trigger multiple trigger combinations
and thus can be present multiple times in the data structure for different trigger combinations (s). The data structure is keyed with trigger combinations. Ini-tially,Dis empty; during the GA run,Dis updated dynamically, whenever new triggering combinations fromS are found to be satisfied. The fitness function is expressed as:
wheref(t) is the fitness value of a test vector t;Rcount(t) counts the number of
rare nodes triggered by the test vector t; w (>1) is a constant scaling factor, andI(t) is a function which returns therelative improvement of the databaseD due to the test vectort. The term “relative improvement of the database” (I(t)) can be explained as follows. Let us interpret the data structureDas a histogram where the bins are defined by unique trigger combinations s∈ S, and each bin contains its corresponding activating test vectors{ti}. Before each update of the
database, we calculate the number of test patterns in each bin which is to be updated. The relative improvement is defined as:
I(t) =X
s∈S
n2(s)−n1(s) n2(s)
(2)
where:n1(s) is the number of test patterns in binsbefore update, andn2(s) is the number of test patterns in binsafter update.
Note that for each test pattern t that enters the database D, the numera-tor will be either 0 or 1 for an arbitrary trigger combination s. However, the denominator will have larger values with the minimum value being 1. Thus, for any bin s, when it gets its 1st test vector, the above mentioned ratio achieves
the maximum value 1, whereas when a bin gets itsnthtest vector, the fraction is 1n. The value gradually decreases as the number of test vectors insincreases. This implies thatas a newer test vector is generated, its contribution is considered more important if it has been able to trigger an yet un-activated trigger condition s, than if it activates a trigger condition that has already been activated by other test vector(s). Note that, for bins s having zero test vectors before and after update (i.e. trigger conditions which could not be activated at the first try), we assign a very small value 10−7 for numerical consistency. The scaling factor w is proportional to the relative importance of the relative improvement term; in our implementation,wwas set to have the value 10.
The rationale behind the two terms in the fitness function is as follows. The first term in the fitness function prefers test patterns that simultaneously activate as many trigger nodes as possible, thus recording test vectors each of which can potentially cover many trigger combinations. The inclusion of the second term has two effects. Firstly, the selection pressure of GA is set towards hard-to-activate patterns by giving higher fitness value to those test patterns that are capable of hard–to–trigger conditions. Secondly, it also helps the GA to explore the sampled trigger combination space evenly. To illustrate this, let us consider the following example.
Suppose, we have five rare nodesr1, r2, r3, r4, r5. We represent the activation of these five nodes by a binary vectorrof length five, whereri= 1 denotes that
theithrare node has been activated to its rare value andr
i= 0 otherwise. Thus,
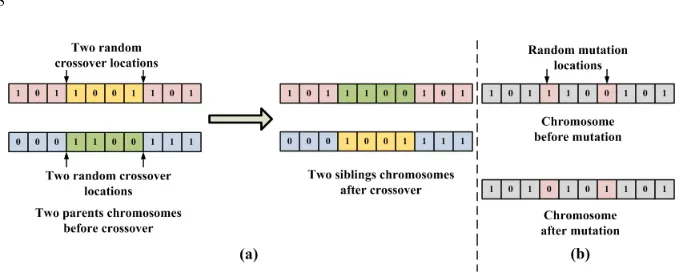
Fig. 3.Example of two–point crossover and mutation in Binary Genetic Algorithm.
are in totalrrare nodes andr0rare nodes are simultaneously triggered in a pattern (r0 < r) by a test vector t, then the 2r0 subsets of the
triggered rare nodes are also triggered by the same test vector. Hence, maximizing r0 increases the coverage over the trigger combination sample set.
The test generation problem is modelled as a maximization problem, and solved using a variation of GA termed Binary Genetic Algorithm (BGA) [10]. Each individual in the population is a bit pattern called a “chromosome”, which represents an individual test vector. Two operations generate new individuals by operating on these chromosomes: crossover and mutation. Crossover refers to the exchange of parts of two chromosomes to generate new chromosomes, while
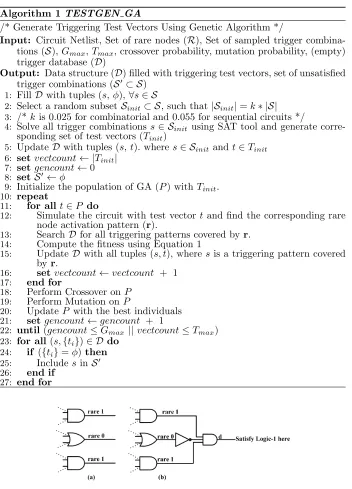
mutation refers to the random (probabilistic) flipping of bits of the chromosomes to give rise to new behaviour. Fig. 3 shows examples of two–point crossover and mutation in BGA. We used a two–point crossover and binary mutation, with a crossover probability of 0.9 and mutation probability of 0.05, respectively. The collection of individuals at every iteration is termed apopulation. A population size of 200 was used for combinatorial circuits and 500 for sequential circuits. Two terminating conditions were used: i) when the total number of distinct test vectors in the database crosses a certain threshold value #T, or ii) if 1000 generations had been reached. The initialization of the population is done by test vectors satisfying some rare node combinations from the sample set. These rare node combinations are randomly selected and the test vectors were found using SAT tools (details are given in the following subsection). Algorithm-1, shows the complete test generation scheme using GA. Notice that the initial test vector population is generated by solving a small number of triggering conditions using SAT.
ex-Algorithm 1TESTGEN GA
/* Generate Triggering Test Vectors Using Genetic Algorithm */
Input: Circuit Netlist, Set of rare nodes (R), Set of sampled trigger combina-tions (S),Gmax,Tmax, crossover probability, mutation probability, (empty)
trigger database (D)
Output: Data structure (D) filled with triggering test vectors, set of unsatisfied trigger combinations (S0⊂ S)
1: FillDwith tuples (s,φ),∀s∈ S
2: Select a random subsetSinit⊂ S, such that|Sinit|=k∗ |S|
3: /*k is 0.025 for combinatorial and 0.055 for sequential circuits */
4: Solve all trigger combinationss∈ Sinit using SAT tool and generate
corre-sponding set of test vectors (Tinit)
5: UpdateDwith tuples (s,t). wheres∈ Sinit andt∈Tinit
6: setvectcount← |Tinit|
7: setgencount←0 8: setS0←φ
9: Initialize the population of GA (P) withTinit.
10: repeat
11: for allt∈P do
12: Simulate the circuit with test vector t and find the corresponding rare node activation pattern (r).
13: SearchDfor all triggering patterns covered by r. 14: Compute the fitness using Equation 1
15: Update Dwith all tuples (s, t), where sis a triggering pattern covered byr.
16: set vectcount←vectcount + 1 17: end for
18: Perform Crossover on P 19: Perform Mutation on P
20: Update P with the best individuals 21: set gencount←gencount + 1
22: until(gencount≤Gmax ||vectcount≤Tmax)
23: for all(s,{ti})∈ Ddo
24: if ({ti}=φ)then
25: Includesin S0
26: end if 27: end for
Fig. 4.Illustration: formulation of a SAT instance which activates 3 rare nodes simul-taneously.
Algorithm 2TESTGEN SAT
/* Solve the triggering patterns which remain unsolved by GA (S0) using SAT tool */
Input: Set of triggering patterns unsolved by GA (S0), Data structureD
Output: Updated Dwith triggering patterns generated by SAT tool 1: for alls∈ S0 do
2: Input the triggering combination to SAT tool. 3: if (SAT(s) = SOLVED)then
4: Retrieve corresponding test vector t. 5: Update Dwith tuple (s, t)
6: Ssat← {s}
7: else
8: Sunsat← {s}
9: end if 10: end for
are quite less (typically 5-10% of the selected samples) we can apply SAT tools to solve them. We nest describe the application of SAT in our ATPG scheme.
2.3 SAT for Hard–to–Activate Trigger Conditions
Boolean Satisfiability (SAT) tools are being used to solve ATPG problems since the last decade [8]. They are found to be robust, often succeeding to find test patterns in large and pathological ATPG problems, where traditional ATPG algorithms have been found wanting. Unlike classical ATPG algorithms, SAT solver based schemes do not work on the circuit representation (e.g. netlist of logic gates) directly. Instead, they formulate the test pattern generation problem as one or more SAT problems. An-variable Boolean formulaf(x1, x2, . . . , xn) in
Conjunctive Normal Form (CNF) is said to besatisfiable if there exists a value assignment for the n variables, such that f = 1. If no such assignment exists, f is said to be unsatisfiable. Boolean satisfiability is an NP-Complete problem. Sophisticated heuristics are used to solve SAT problems, and powerful SAT solver software tools have become available in recent times (many of them are free). The ATPG problem instance is first converted into a CNF and then input to a SAT solver. If the solver returns a satisfiable assignment within a specified time the problem instance is considered to be satisfiable and unsatisfiable, otherwise. As mentioned previously, we apply the SAT tool only for those trigger com-binations for which GA fails to generate any test vector. Let us denote the set of such trigger combinations as S0 ⊆ S. We consider each trigger combination s∈ S0, and input it to the SAT tool. This SAT problem formulation is illustrated by an example in Fig. 4. Let us consider the three rare nodes shown in Fig. 4(a) with their rare values. To create a satisfiability formula which simultaneously activates these three nodes to their rare value, we construct the circuit shown in Fig. 4(b). The SAT instance is thus formed which tries to achieve a value 1 at wire(node)d.
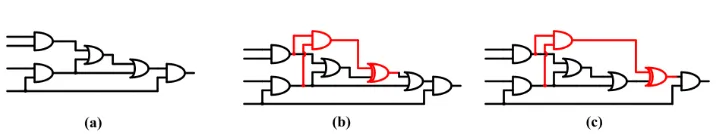
Fig. 5.Impact of Trojan payload selection: (a) golden circuit; (b) payload-1 which has no effect on output; (c) payload-2 which has effect on the output.
test vectors. However, some of the trigger combinations will still remain unsolved, which would be lebelled as unsatisfiable. Thus the set S0 is partitioned into two disjoint subsets Ssat and Sunsat. The first subset is accepted and the data
structure D is updated with the patterns in this subset, whereas the second subset is discarded. This part of the flow has been summarized in Algorithm-2. The basic ATPG mechanism now in place, we next describe the refinement of the scheme to take the impact of the payload into consideration, and also achieve test compaction in the process.
3
Improving the Proposed Scheme: Payload Aware Test
Set Selection and Test Compaction
3.1 Payload Aware Test Vector Selection
Finding out proper trigger-payload pairs to enumerate feasible HTH instances a is non-trivial computational problem. In combinational circuits, one necessary condition for a node to be a payload is that its topological rank must be higher than the topologically highest node of the trigger combination, otherwise there is a possibility of forming a “combinational loop”; however, this is not a sufficient condition. In general, a successful Trojan triggering event provides no guarantee regarding its propagation to the primary output to cause functional failure of the circuit. As an example, let us consider the circuit of Fig. 5(a). The Trojan is triggered by an input vector 1111. Fig. 5(b) and Fig. 5(c) show two potential payload positions. It can be easily seen that independent of the applied test vector at in circuit input, for position-1 the Trojan effect gets masked and cannot be detected. On the other hand, the Trojan effect at position-2 can be detected. It is important to identify, for each trigger combination, the constrained primary input values. For this, we consider each Trigger combination and their corresponding set of trigger test vectors at a time. To be precise, we consider the entries (s,{ti}) from the databaseD, one at a time. Let us denote the set
of test vectors corresponding to a specific s as {ts
i}. Next, for each test vector
t ∈ {ts
i}, we find out which of the primary inputs, if any, remains static at a
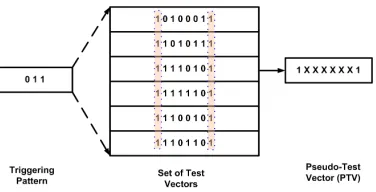
Fig. 6.PTV generation example: (a) triggering pattern; (b) corresponding set of test vectors; (c) generated PTV.
Algorithm 3SELECT TEST VECT /* Select Payload Aware test vectors */ Input: Data structureD, circuit netlist Output: Final test set (Tf inal)
1: setTf inal←φ
2: for all(s,{ti})∈ Ddo
3: Retrieve the test vector set {ti}
4: Compute the corresponding PTV
5: do 3-value logic simulation and create the initial fault listFs
6: if |{ts
i}|>5 then
7: set T est set← {ts i}
8: else
9: Generate extra test vectors {ts
ext} by randomly filling the X positions
of the PTV
10: Simulate the circuit with {ts
ext} and keep vectors satisfyings
11: set T est set← {ts
i} ∪ {tsext}
12: end if
13: do fault simulation using HOPE with inputsFs andT est set
14: Retrieve Fs
detected⊆ FsandT est setdetected⊆T est set
15: Keep the subsetT est setcompofT est setdetected, which completely covers
Fs detected.
16: set Tf inal←T est setcomp
17: end for 18: returnTf inal
(PTV). Fig. 6 illustrates the process of PTV generation with a simple example, where the leftmost and the rightmost positions of the vectors are at logic-1.
At the next step, we perform a three-value logic simulation of the circuit with the PTV and note down values obtained at all the internal wires (nodes) which are at topologically higher positions from the nodes in the trigger combi-nation. Then for each of these nodes we consider a stuck-at fault according to the following rule:
1. If the value at that node is 1, we consider a stuck-at-zero fault there. 2. If the value at that node is 0, we consider a stuck-at-one fault there. 3. If the value at that node is X, we consider a both one and
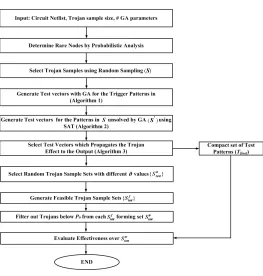
Fig. 7.The complete test generation and evaluation flow.
At the next step, this fault list (Fs) and the set of test vectors considered
({ts
i}) is input to a fault simulator. We used the HOPE [12] fault simulator in
diagnostic mode for this purpose. The output will be the set of faults that are detected (Fs
detected⊆ Fs) as well as the corresponding test vectors which detect
them. The detected faults constitutes the list of potential payload positions for the trigger combination. Thus, after detecting the feasible payloads, we greedily select a subset of the test vector set Ts ⊆ {tsi} which achieves complete
cover-age for the entire fault list. The test vectors belonging to the rest of {ts i}, i.e.
{ts
i} − Ts, can be discarded to be redundant. Although a greedy selection, we
found that this step reduces the overall test set size significantly. Further test compaction can be achieved, at the cost of additional computational overhead, using specialized test compaction schemes.
One important point worth noting is that, it is not guaranteed by the pro-posed test generation scheme that all possible test vectors which trigger a par-ticular trigger combination will get generated. As the fault list (Fs) is calculated
only based on the test vectors in{ts
i}, it might not cover all possible payloads for
a trigger combinations. However, for each test vectort∈ {ts
i}, it is guaranteed
that all feasible payloads will be enumerated. Further, it can be deterministi-cally decided if a test vectort ∈ {ts
i} will have any payload or not. In fact, for
redun-dant, or doesn’t have any payload. It is also observed that the number of test vectors for some hard-to-activate trigger combinations are really low (typically 1 to 5 vectors). For these cases, the fault coverage may be poor and many pay-loads for the trigger combination remains unexplored. To resolve this issue, we add some extra test vectors derived by filling the don’t care bits (if any) of the PTV. This is only done for those trigger combinations for which the number of triggering vectors are less than five. These newly generated vectors are needed to be checked by simulation so that they successfully trigger the corresponding triggering combination, before their inclusion to the test set {ts
i}. This step is
found to improve the test coverage. The compacted test vector selection scheme is described in Algorithm-3. At the end of this step, we obtain a compact set of test vectors with high trigger and Trojan coverage.
3.2 Evaluation of Effectiveness
It is reasonable to assume that an attacker will be only interested in Trojans with loweffective triggering probability, irrespective of the individualrareness values
of the constituent rare nodes. Thus, a natural approach for an attacker would be to rank the Trojans according to theirtriggering probability and select Trojans which are below some specifictriggering threshold (Ptr). Intuitively, an attacker
may choose the Trojan which is rarest among all, but it may lead to easy detec-tion as very rare Trojans are often found to be significantly small in number and are expected to be well tracked by the tester. Thus, a judicious attacker would select a Trojan that will remain well-hidden in the pool of Trojans, but achieves extremely low Triggering probability at the same time. To simulate the above mentioned behaviour of the attacker, we first select new samples of candidate Trojans from the Trojan space with varying range ofθvalues. We denote each of such samples as Sθ
test and ensure that|Stestθ |=|S|. Subsequently, each of these
sets is refined by the SAT tool by selecting only feasible Trojans. By feasible Tro-jans we mean the TroTro-jans which are triggerable and whose impacts are visible at the outputs. We denote the set of such feasible Trojan sets obtained for different θvalues as{Stestf }. Next, we filter out Trojans from these sets which are below a specified triggering thresholdPtr. Finally, all these subsets are combined to form
a set of Trojans Str
test. This set contains Trojans whose triggering probabilities
are belowPtr and is used for the evaluation of the effectiveness of the proposed
methodology. The value of Ptr is set to 10−6 based on the observation that for
most of the benchmark circuits considered, there are roughly 30% Trojans which have triggering probabilities below 10−6. Also, below the range (10−7−10−8) the number of Trojans are extremely low, which may leave the attacker only with a few options.
4
Experimental Results and Discussion
4.1 Experimental Setup
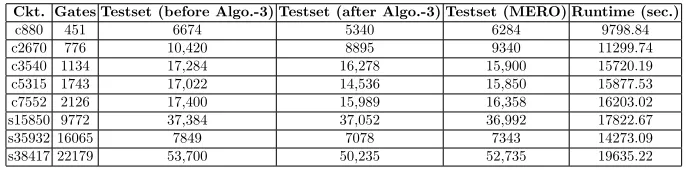
Table 1. Comparison of the proposed scheme with MERO with respect to testset length.
Ckt. Gates Testset (before Algo.-3) Testset (after Algo.-3) Testset (MERO) Runtime (sec.)
c880 451 6674 5340 6284 9798.84
c2670 776 10,420 8895 9340 11299.74 c3540 1134 17,284 16,278 15,900 15720.19 c5315 1743 17,022 14,536 15,850 15877.53 c7552 2126 17,400 15,989 16,358 16203.02 s15850 9772 37,384 37,052 36,992 17822.67 s35932 16065 7849 7078 7343 14273.09 s38417 22179 53,700 50,235 52,735 19635.22
Table 2. Trigger and Trojan coverage at various stages of the proposed scheme. at θ= 0.1 for random sample of Trojans upto 4 rare node triggers (Sample size is 100,000 for combinational circuits and 10,000 for sequential circuits).
Ckt. GA only GA + SAT GA + SAT + Algo. 3
Trig. Cov. Troj. Cov. Trig. Cov. Troj. Cov. Trig. Cov. Troj. Cov.
c880 92.12 83.59 96.19 85.70 96.19 85.70 c2670 81.63 69.27 87.31 75.17 87.15 75.82 c3540 80.58 57.21 82.79 59.07 81.55 60.00 c5315 83.79 64.45 85.11 65.04 85.91 71.13 c7552 73.73 64.05 78.16 68.95 77.94 69.88 s15850 64.91 51.95 70.36 57.30 68.18 57.30 s35932 81.15 71.77 81.90 73.52 81.79 73.52 s38417 55.03 29.33 61.76 36.50 56.95 38.10
fault simulator [12]. We restricted ourselves to a random sample of 100,000 trigger combinations [5], each having up to four rare nodes as trigger nodes. We also implemented theMERO methodology side by side for comparison. We evaluated the effectiveness of the proposed scheme on a subset of ISCAS-85 and ISCAS-89 benchmark circuits, with all ISCAS-89 sequential circuits converted to full scan mode. The implementation was performed and executed on a Linux workstation with a 3 GHz processor and 8 GB of main memory.
4.2 Test Set Evaluation Results
Table 1 presents a comparison of the testset lengths generated by the proposed scheme, with that generated by MERO. It also demonstrates the impact of Algo-3, by comparing the test vector count before Algo-3 (T CGASAT) and
af-ter Algo-3 (T Cf). As would be evident, for similar number of test patterns the
proposed scheme achieves significantly better trigger as well as Trojan coverage thanMERO. The gate count of the circuits and the time required to generate the corresponding testsets is also presented to exhibit the scalability of the ATPG heuristic.
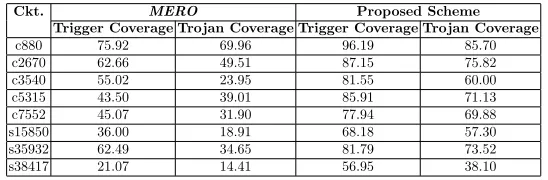
Table 3. Comparison of trigger and Trojan Coverage among MERO patterns and patterns generated with the proposed scheme withθ = 0.1; N = 1000 (forMERO) and for trigger combinations containing up to four rare nodes.
Ckt. MERO Proposed Scheme
Trigger Coverage Trojan Coverage Trigger Coverage Trojan Coverage c880 75.92 69.96 96.19 85.70 c2670 62.66 49.51 87.15 75.82 c3540 55.02 23.95 81.55 60.00 c5315 43.50 39.01 85.91 71.13 c7552 45.07 31.90 77.94 69.88 s15850 36.00 18.91 68.18 57.30 s35932 62.49 34.65 81.79 73.52 s38417 21.07 14.41 56.95 38.10
payload aware test set selection (Algo-3), the trigger coverage slightly decreases for some circuits, whereas the Trojan coverage slightly increases. The decrement in trigger coverage is explained by the fact that some of the trigger combinations do not have any corresponding payload – as a result of which they are removed. In contrary, the addition of some “extra test vectors” by Algo-3 helps to improve the Trojan coverage.
Table 3 presents the trigger and Trojan coverage for eight benchmark circuits, compared MERO test patterns withN = 1000 andθ = 0.1. In order to make a fair comparison, we first count the number of distinct test vectors generated by MERO (T CM ERO) with the above mentioned setup, and then set GA to
run until the number of distinct test vectors in the database becomes higher thanT CM ERO. We denote the number of distinct test vectors after GA run as
T CGA. Note that, the SAT step is performed after the GA run, and thus the
total number of test vectors after the SAT step (T CGASAT) is slightly higher
than T CM ERO. The test vector count further reduces after the Algo-3 is run.
We denote the final test vector count asT Cf.
Fig. 8.Comparison of trigger and Trojan coverage of the proposed scheme withMERO, with varying triggering threshold (θ).
Fig. 9.Trigger and Trojan coverage of the proposed scheme on a set of special Trojans, which combine some easily triggerable nodes with some extremely rare nodes.
(shown in Fig. 9). It can be thus remarked that the tester should choose a θ value, so that the initial setS contains a good proportion of Trojans with low triggering probability, while also covering most of the moderately rare nodes.
Finally, we test our scheme with sequential Trojans. The counter based Tro-jan model as described in [5] was considered. We consider TroTro-jans up to four states, as larger Trojans have been reported to be easily detectable by side chan-nel analysis techniques [17]. It can be observed form Table 4 that as for the combinational circuits, the the proposed scheme outperformsMERO.
4.3 Application to Trojan Diagnosis
Table 4.Coverage comparison betweenMEROand the proposed Scheme for sequential Trojans. The sequential Trojan model considered is same as [5].
Ckt. Trig. Cov. for Proposed Scheme Trig. Cov. forMERO Trojan State Count Trojan State Count
2 4 2 4
s15850 64.91 45.55 31.70 26.00 s35932 78.97 70.38 58.84 49.59 s38417 48.00 42.17 16.11 8.01
Ckt. Troj. Cov. for Proposed Scheme Troj. Cov. forMERO Trojan State Count Trojan State Count
2 4 2 4
s15850 46.01 32.59 13.59 8.95 s35932 65.22 59.29 25.07 15.11 s38417 30.52 19.92 9.06 2.58
where s is a trigger combination, V is the set of corresponding triggering test vectors, P is the set of possible payloads, and O is the set of faulty outputs corresponding to the test patterns in V, due to the activation of some Trojan instance. Based on this information, one can design diagnosis schemes using sim-ple cause-effect-analysis, or other more sophisticated techniques. The complete description of a diagnosis scheme is however out of the scope of this paper.
4.4 Application to Side Channel Analysis based Trojan Detection
Most recent side-channel analysis techniques target the preferential activation of a specific region of the circuit, keeping the other regions dormant [1,19], since side channel analysis is more effective if the Trojan is activated, at least partially [17]. Hence, the proposed technique, with its dual emphasis on test pattern generation directed towards triggering of Trojans, as well as propagation of the Trojan effect to the primary output, can be a valuable component of a side channel analysis based Trojan detection methodology.
5
Conclusions
References
1. Banga, M., Hsiao, M.: A region based approach for the identification of hardware Trojans. In: Proc. of Int. symposium on HOST. pp. 40–47 (2008)
2. Banga, M., Chandrasekar, M., Fang, L., Hsiao, M.S.: Guided test generation for isolation and detection of embedded Trojans in ICs. In: Proceedings of the 18th ACM Great Lakes symposium on VLSI. pp. 363–366. ACM (2008)
3. Chakraborty, R.S., Bhunia, S.: Security against hardware Trojan through a novel application of design obfuscation. In: Proceedings of the 2009 International Con-ference on Computer-Aided Design. pp. 113–116. ACM (2009)
4. Chakraborty, R.S., Narasimhan, S., Bhunia, S.: Hardware Trojan: Threats and emerging solutions. In: Proc. of IEEE Int. Workshop on HLDVT. pp. 166–171. IEEE (2009)
5. Chakraborty, R.S., Wolff, F., Paul, S., Papachristou, C., Bhunia, S.: MERO: A statistical approach for hardware Trojan detection. In: Cryptographic Hardware and Embedded Systems-CHES 2009. pp. 396–410. Springer (2009)
6. DARPA: TRUST in Integrated Circuits (TIC). [Online]. Available:
http://www.darpa.mil/MTO/solicitations/baa07-24(2007)
7. Dupuis, S., Ba, P.S., Di Natale, G., Flottes, M.L., Rouzeyre, B.: A novel hardware logic encryption technique for thwarting illegal overproduction and Hardware Tro-jans. In: On-Line Testing Symposium (IOLTS), 2014 IEEE 20th International. pp. 49–54. IEEE (2014)
8. Eggersgl¨uß, S., Drechsler, R.: High Quality Test Pattern Generation and Boolean Satisfiability. Springer Science & Business Media (2012)
9. Fu, Z., Marhajan, Y., Malik, S.: Zchaff sat solver. [Online]. Available:
http://www.princeton.edu/chaff(2004)
10. Goldberg, D.E.: Genetic algorithms. Pearson Education (2006)
11. Jin, Y., Makris, Y.: Hardware Trojan detection using path delay fingerprint. In: Hardware-Oriented Security and Trust, 2008. HOST 2008. IEEE International Workshop on. pp. 51–57. IEEE (2008)
12. Lee, H.K., Ha, D.S.: HOPE: An efficient parallel fault simulator for synchronous sequential circuits. Computer-Aided Design of Integrated Circuits and Systems, IEEE Transactions on 15(9), 1048–1058 (1996)
13. Mingfu, X., Aiqun, H., Guyue, L.: Detecting Hardware Trojan through Heuris-tic Partition and Activity Driven Test Pattern Generation. In: Communications Security Conference (CSC), 2014. pp. 1–6. IET (2014)
14. Rajendran, J., Pino, Y., Sinanoglu, O., Karri, R.: Security analysis of logic ob-fuscation. In: Proceedings of the 49th Annual Design Automation Conference. pp. 83–89. ACM (2012)
15. Rudnick, E.M., Patel, J.H., Greenstein, G.S., Niermann, T.M.: A genetic algorithm framework for test generation. Computer-Aided Design of Integrated Circuits and Systems, IEEE Transactions on 16(9), 1034–1044 (1997)
16. Salmani, H., Tehranipoor, M., Plusquellic, J.: A layout-aware approach for im-proving localized switching to detect hardware Trojans in integrated circuits. In: Information Forensics and Security (WIFS), 2010 IEEE International Workshop on. pp. 1–6. IEEE (Dec 2010)
18. Shekarian, S.M.H., Zamani, M.S., Alami, S.: Neutralizing a design-for-hardware-trust technique. In: Computer Architecture and Digital Systems (CADS), 2013 17th CSI International Symposium on. pp. 73–78. IEEE (2013)
19. Wei, S., Potkonjak, M.: Scalable hardware Trojan diagnosis. Very Large Scale Integration (VLSI) Systems, IEEE Transactions on 20(6), 1049–1057 (2012) 20. Zhang, X., Tehranipoor, M.: RON: An on-chip ring oscillator network for
hard-ware Trojan detection. In: Design, Automation & Test in Europe Conference & Exhibition (DATE), 2011. pp. 1–6. IEEE (2011)
![Fig. 1. Motivational example: variation of trigger and Trojan coverage with rarenessthreshold (θ) by the MERO [5] technique for c7552 (a) on sets of Trojans consideredas in [5]; (b) on a set of rarely triggered Trojans (effective triggering probability below10−6).](https://thumb-us.123doks.com/thumbv2/123dok_us/7917486.1314648/2.612.125.483.93.243/motivational-variation-rarenessthreshold-consideredas-triggered-eective-triggering-probability.webp)