Cancer Management and Research 2018:10 4051–4064
Cancer Management and Research
Dovepress
submit your manuscript | www.dovepress.com 4051
O R i g i n a l R e s e a R C h open access to scientific and medical research
Open Access Full Text Article
Development and validation of an
immunity-related classifier of nine chemokines for
predicting recurrence in stage i–iii patients with
colorectal cancer after operation
guozeng Xu1,2,* Yuehan Zhou3,* Fuxiang Zhou1,2
1Department of Radiation and Medical
Oncology, Zhongnan hospital of Wuhan University, Wuhan, China;
2Key laboratory of Tumor Biological
Behaviors, hubei Cancer Clinical study Center, Wuhan, China;
3Department of Pharmacology, guilin
Medical University, guilin 541004, guangxi, China
*These authors contributed equally to this work
Introduction:Chemokines are closely related with tumor immunity, progression, and metas-tasis. We aimed to construct a multi-RNA classifier of chemokine family genes for predicting tumor recurrence in stage I–III patients with colorectal cancer (CRC) after operation.
Patients and methods:By analyzing microarray data, the Cox regression analysis was con-ducted to determine survival-related chemokine family genes and develop a multi-RNA classifier in the training set. The prognostic value of this multi-RNA classifier was further validated in the internal validation and external independent sets. Receiver operating characteristic curves were used to compare the prediction ability of the combined model of this multi-RNA classifier and stage, and this multi-RNA classifier and stage alone.
Results: Nine survival-related chemokines were identified in the training set. We identified a nine-chemokine classifier and classified the patients as high-risk or low-risk. Compared with CRC patients with high-risk scores, CRC patients with low-risk scores had longer
disease-free survival in the training (HR=2.353, 95% CI=1.480–3.742, P<0.001), internal validation
(HR=2.389, 95% CI=1.428–3.996, P<0.001), and external independent (HR=3.244, 95%
CI=1.813–5.807, P<0.001) sets. This nine-chemokine classifier was an independent prognostic
factor in these datasets (P<0.05). The combined model of this nine-chemokine classifier and
tumor stage may tend to have higher accuracy than stage alone in the training (area under curve 0.727 vs 0.626, P<0.01), internal validation (0.668 vs 0.584, P=0.03), and external independent
(0.704 vs 0.678, P>0.05) sets. This nine-chemokine classifier may only be applied in Marisa’s
C2, C5, and C6 subtypes patients.
Conclusion:Our nine-chemokine classifier is a reliable prognostic tool for some specific biological subtypes of CRC patients. It might contribute to guide the personalized treatment for high-risk patients.
Keywords:classifier, colorectal cancer, chemokine, survival analysis, risk classification, microarray
Introduction
CRC is the third most common malignancy and the fourth leading cause of mortality
worldwide.1 Risk stratification of CRC may require the combined multiple approaches,
including analysis of molecular biomarkers and clinical data, and thorough experimental studies. In the past two decades, study results have confirmed that tumor is a
hetero-geneity disease.2 The combined model of multiple clinical and molecular parameters
could be a much more objective prognostic tool for CRC patients. Correspondence: Fuxiang Zhou
Department of Radiation and Medical Oncology, Zhongnan hospital of Wuhan University, no. 169, Donghu Road, Wuhan 430071, hubei, China email [email protected]
Journal name: Cancer Management and Research Article Designation: Original Research Year: 2018
Volume: 10
Running head verso: Xu et al
Running head recto: Prognostic classifier for colorectal cancer DOI: http://dx.doi.org/10.2147/CMAR.S174452
Cancer Management and Research downloaded from https://www.dovepress.com/ by 118.70.13.36 on 20-Aug-2020
For personal use only.
Dovepress
Xu et al
Chemokines are a group of small molecular weight proteins
that bind to the G protein-coupled chemokine receptors.3
Che-mokines and their receptors are divided into four subfamilies (CXC, CC, CX3C, and C) based on the pattern of cysteine residues, where C represents the cysteine and X represents
noncysteine amino acids.4,5 Chemokine family genes are closely
related with senescence, angiogenesis, epithelial mesenchymal transition, proliferation, immune evasion, and tumor
metasta-sis.6 The altered expression of chemokines and their receptors
is found in many malignancies and may lead to aberrant
che-mokine receptor signaling.7–20 The chemokine ligand–receptor
interactions were closely related with tumor immunity, progres-sion, and metastasis in CRC patients, including the CXCL1–
CXCR2,7 CXCL9/10–CXCR3,8,9 CXCL12–CXCR4,10–14
CCL2–CCR2,15,16 CCL5–CCR5,17 CCL15–CCR1,18 CCL20–
CCR6,19 and CX3CL1–CX3CR120 axes. Although small sample
studies showed that some chemokines could be used as the single biomarker for CRC, the values of these genes were not
further validated in other validation sets.8,11,13,16,21–23 Until now,
there is no multi-RNA classifier of chemokine family genes for predicting tumor recurrence in CRC patients. As a widely used microarray platform, Affymetrix human genome U133 plus 2.0 array included all probes of human genome U133 set and
about 6,500 new genes.24 Almost all the mRNA-level data of
chemokine family genes could be obtained from this microarray platform. Laetitia Marisa defined six molecular subtypes for CRC based on the main biological characteristics, including one subtype with downregulated immune pathways (C1), one deficient mismatch repair subtype (C2), one KRAS mutant subtype (C3), one cancer stem cell subtype (C4), one subtype with the upregulated Wnt pathway (C5), and one subtype with
a normal-like gene expression profile (C6).25 Therefore, we
performed this study to develop and validate a multi-RNA prognostic classifier of chemokine family genes for predicting recurrence in stage I–III patients with CRC by analyzing the microarray data. These multi-RNA signatures were further validated in CRC patients with different Marisa’s biological
subtypes (C1–C6).25
Materials and methods
Datasets preparation
Gene expression of chemokine family genes and correspond-ing clinical data were obtained from the GEO database. All log2-transformed expression data of chemokines and their receptors were obtained from Affymetrix human genome U133 plus 2.0 array (GSE39582 and GSE14333). The expression values of genes with multiple probes were calculated by using the median values of multiple probes. After filtering out CRC
patients without DFS and clinical data, there were a total of 718 stage I–III patients with CRC, including 492 from GSE39582 and 226 from GSE14333. The 492 patients from GSE39582
were randomly divided into training (n=246, GSE39582) and
internal validation (n=246, GSE39582) sets. The 226 patients
from GSE14333 were used for the external independent set.
statistical analysis
The survival analysis was performed by the “survival” package of R software (version 3.4.3). In the training set, the association between the expression level of chemokine family genes and CRC patients’ DFS was evaluated using a univariate Cox regression analysis. Those chemokine
fam-ily genes were considered to be significant if their P-values
were less than 0.05. Then, the selected chemokine family genes were fitted in a multivariate Cox regression analysis in the training set. Risk scores were calculated by the selected chemokine family genes and their regression coefficients
in the multivariate Cox regression analysis,26–28 as follows:
Risk Score C Vi i
i k
= ×
=
∑
1
where k is the number of prognostic chemokines, Ci
rep-resents the coefficient of the ith chemokine in the multivariate
Cox regression analysis, Vi is the expression value of the ith
chemokine. Using the upper quartile value of risk scores in the training set as the cutoff point, CRC patients in the training, internal validation, and external independent sets were classified as low-risk or high-risk correspondingly. Survival differences between low-risk and high-risk groups were assessed by the Kaplan–Meier estimator and log-rank test. The multivariate Cox regression analysis was performed to assess whether this risk score was independent of the clinical characteristics such as stage, age, gender, and adjuvant chemotherapy. Addition-ally, ROC curves were used to compare the predictive value of DFS by the combined model of risk score and stage, and this risk score model and stage alone. The ROC curve analysis was performed using the “pROC” package of R software (version 3.4.3). To generate the ROC curves, those CRC patients whose durations were less than the 5-year DFS needed to be excluded, if they still did not recur at last follow-up. The remaining CRC patients were classified as having either shorter or longer than the
recurrence-free survival of 60 months.28 The prognostic values
of this multi-RNA prognostic classifier were further validated in
different Marisa’s biological subtypes (C1–C6).25 The log-rank
test, Cox regression analysis, and ROC analysis were considered
to be significant if their P-values were less than 0.05.
Cancer Management and Research downloaded from https://www.dovepress.com/ by 118.70.13.36 on 20-Aug-2020
Dovepress Prognostic classifier for colorectal cancer
Functional enrichment analysis
To evaluate the functional implication of these nine chemo-kines, functional enrichment analyses for GO and KEGG category were performed with the GeneCodis web tool (http://genecodis.cnb.csic.es/).29–31 GO and KEGG category
enrichments were based on the threshold of P-value <0.05.
Significant enrichment results were visualized using R soft-ware (version 3.4.3).
Results
Identification of survival-related
chemokines in the training set
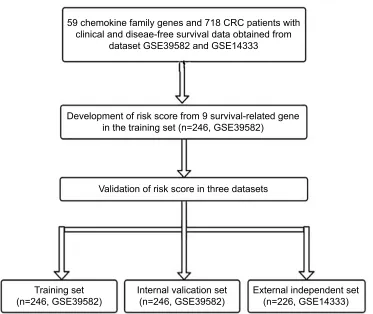
Figure 1 shows the study flow for the development and validation of the nine-chemokine classifier. By using microarray data, we identified 59 chemokine family genes from GSE39582 and GSE14333. We further analyzed these 59 genes by the univariate Cox regression analysis in the
training set (n=246, GSE39582; Table S1). Consequently,
we identified nine chemokines that were significantly cor-related with DFS in CRC patients (shown in Table 1). The positive coefficients for three chemokines (CCL1, CCL14, and CXCL14) indicated that their higher levels of expression
were associated with worse prognosis. The negative coeffi-cients for the remaining six genes (CXCL1, CXCL3, CXCL9, CXCL10, CXCL11, and CXCL13) indicated that their higher levels of expression were associated with better prognosis.
survival comparisons between
low-risk and high-low-risk groups in the training,
internal validation, and external
independent sets
According to these chemokines and their regression coeffi-cients in the multivariate Cox model, we calculated the risk
scores for every patient in the training (n=246, GSE39582),
internal validation (n=246, GSE39582), and external
inde-pendent (n=226, GSE14333) sets. Using the cutoff value of
risk scores (1.559), CRC patients were classified into low-risk group and high-risk group for the training (low-risk/high-risk: 185/61), internal validation (low-risk/high-risk: 196/50), and external independent (low-risk/high-risk: 185/41) sets. Figure 2 shows the distributions of this risk score and the DFS status in these three sets. As shown in Figure 2, CRC patients with high-risk scores tended to have higher risk of treatment relapse.
Figure 1 Study flow for the development and validation of the nine-chemokine classifier.
Abbreviation: CRC, colorectal cancer.
Development of risk score from 9 survival-related gene in the training set (n=246, GSE39582)
59 chemokine family genes and 718 CRC patients with clinical and diseae-free survival data obtained from
dataset GSE39582 and GSE14333
Validation of risk score in three datasets
Internal valication set
(n=246, GSE39582) External independent set(n=226, GSE14333) Training set
(n=246, GSE39582)
Cancer Management and Research downloaded from https://www.dovepress.com/ by 118.70.13.36 on 20-Aug-2020
Dovepress
Xu et al
Table 1 The characteristics of nine chemokines associated with DFS in the training set of 246 CRC patients (n=246, gse39582)
Gene symbol Type HR (95% CI) Coefficients P-value Putative function
CCL1 ligand 2.729 (1.118–6.662) 1.004 0.027 Risky
CCL14 ligand 1.400 (1.043–1.879) 0.336 0.025 Risky
CXCL1 ligand 0.824 (0.697–0.974) −0.194 0.024 Protective
CXCL3 ligand 0.836 (0.708–0.986) −0.179 0.034 Protective
CXCL9 ligand 0.840 (0.722–0.977) −0.174 0.024 Protective
CXCL10 ligand 0.832 (0.712–0.972) −0.184 0.021 Protective
CXCL11 ligand 0.878 (0.774–0.995) −0.131 0.041 Protective
CXCL13 ligand 0.870 (0.763–0.992) −0.140 0.037 Protective
CXCL14 ligand 1.146 (1.008–1.302) 0.136 0.037 Risky
Abbreviation: CRC, colorectal cancer.
Figure 2 The distributions of risk score and DFS status in the training (n=246, GSE39582), internal validation (n=246, GSE39582), and external independent (n=226, gse14333) sets.
Abbreviation: DFs, disease-free survival.
0 50 100 150
Colorectal cancer patients with gradually increasing risk scores 0
1 2 3
Risk score
200
No Status Validation Set
Recurrence
No Status
Recurrence 250
0 50 100 150
Colorectal cancer patients with gradually increasing risk scores 0
2 4
Risk score
200
No Status Training Set
Recurrence
250
0 50 100 150
Colorectal cancer patients with gradually increasing risk scores 0
2
1 4
3
Risk score
200 Independent Set
Cancer Management and Research downloaded from https://www.dovepress.com/ by 118.70.13.36 on 20-Aug-2020
Dovepress Prognostic classifier for colorectal cancer
The clinical characteristics of low-risk group and high-risk group patients with CRC in these three sets are shown in Table 2. There were no differences for clinical characteristics (age, gender, stage, and adjuvant chemotherapy) between
low-risk group and high-risk group (all P>0.05).
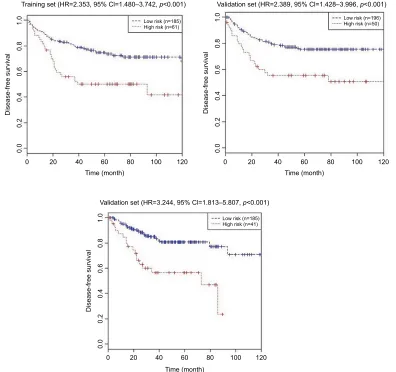
Figure 3 and Table 3 show the DFS differences between high-risk and low risk groups in these three sets. The log-rank test showed that CRC patients with low-risk scores had significantly longer DFS than those with high-risk scores in
the training set (HR=2.353, 95% CI=1.480–3.742, P<0.001)
and internal validation (HR=2.389, 95% CI=1.428–3.996,
P<0.001), and external independent (HR=3.244, 95%
CI=1.813–5.807, P<0.001) sets.
Multivariate Cox regression analysis
in the training, internal validation, and
external independent sets
Table 4 shows the multivariate Cox regression analysis results of the nine-chemokine classifier, gender, age, stage, adjuvant chemotherapy, and DFS in the training, internal validation, and external independent sets. Both the nine-chemokine classifier and stages were significantly associated with CRC
patients’ DFS in these datasets (all P<0.05).
ROC analysis in the training, internal
validation, and external independent sets
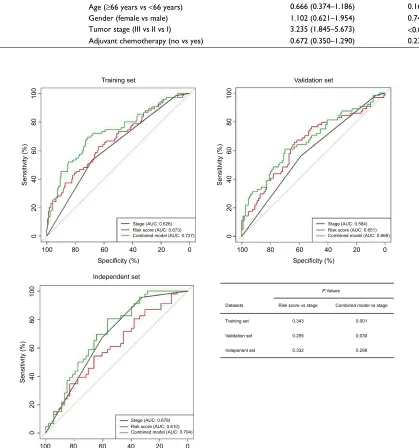
Figure 4 shows the ROC curves for predicting DFS in the training, internal validation, and external independent sets. AUC of the nine-chemokine classifier is similar with thatTable 2 Clinical characteristics of CRC patients according to the nine-chemokine classifier in the training (n=246, gse39582), internal
validation (n=246, GSE39582), and external independent (n=226, gse14333) sets
Characteristics Training set (n=246, GSE39582) Internal validation set
(n=246, GSE39582)
External independent set (n=226, GSE14333)
High-risk (n=61)
Low-risk (n=185)
P-value High-risk
(n=50)
Low-risk (n=196)
P-value High-risk
(n=41)
Low-risk (n=185)
P-value
Age (years)
<66 30 68 0.085 17 72 0.719 20 81 0.560
≥66 31 117 33 124 21 104
gender
Male 32 105 0.558 29 106 0.644 26 94 0.143
Female 29 80 21 89 15 91
stage
i 3 14 0.727 1 13 0.331 3 38 0.122
ii 33 102 24 101 18 76
iii 25 69 25 82 20 71
adjuvant chemotherapy
Yes 28 67 0.078 24 83 0.472 21 118 0.135
no 32 118 26 113 20 67
Unknown 1 0 0 0 0 0
Abbreviation: CRC, colorectal cancer.
of stage alone in the training (0.673 vs 0.626, P=0.343),
internal validation (0.651 vs 0.584, P=0.332), and external
independent (0.609 vs 0.678, P=0.888) sets. AUC of the
combined model (nine-chemokine classifier and tumor stage) may tend to be higher than that of stage alone in the
train-ing (0.727 vs 0.626, P=0.001), internal validation (0.668 vs
0.584, P=0.030), and external independent (0.704 vs 0.678,
P=0.298) sets.
Survival analysis between low-risk and
high-risk groups in the combined training
and validation set
Using the same cutoff point (1.559), CCR patients were
categorized into low-risk group (n=381) and high-risk
group (n=111) in the combined training and validation set.
CRC patients with low-risk scores had significantly longer
DFS (HR=2.383, 95% CI=1.690–3.359, P<0.001) and OS
(HR=1.603, 95% CI=1.115–2.305, P=0.010) than those with
high-risk scores (shown in Table 5). Table 6 shows the multi-variate Cox regression analysis results of the nine-chemokine classifier, gender, age, stage, adjuvant chemotherapy, and
survival in the combined training and validation set (n=492,
GSE39582). The multivariate Cox analysis showed that the nine-chemokine classifier was significantly associated with
patients’ DFS (HR=2.292, 95% CI=1.622–3.239, P<0.001)
and OS (HR=1.640, 95% CI=1.139–2.362, P=0.008;
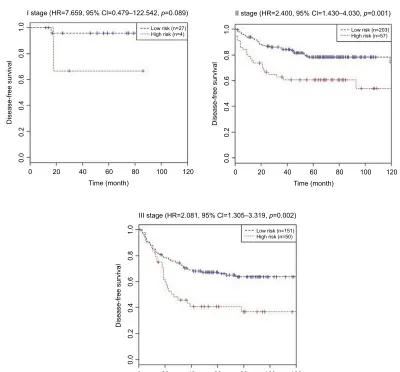
Table 6). Subgroup analysis showed that stage II–III patients
with low-risk scores had significantly longer DFS (P<0.05)
than those with high-risk scores (shown in Figure 5).
Cancer Management and Research downloaded from https://www.dovepress.com/ by 118.70.13.36 on 20-Aug-2020
Dovepress
Xu et al
Figure 3 Kaplan–Meier curves of disease-free survival according to the nine-chemokine classifier in the training (n=246, GSE39582), internal validation (n=246, GSE39582), and external independent (n=226, GSE14333) sets.
0.
4
Disease-free surviva
l
Training set (HR=2.353, 95% Cl=1.480–3.742, p<0.001)
0.
60
.8
1.
0
0.
2
0.
0
0 20 40 60 80 100
Low risk (n=185) High risk (n=61)
120 Time (month)
0.
4
Disease-free surviva
l
Validation set (HR=2.389, 95% Cl=1.428–3.996, p<0.001)
0.
60
.8
1.
0
0.
2
0.
0
0 20 40 60 80 100
Low risk (n=196) High risk (n=50)
120 Time (month)
0.
4
Disease-free surviva
l
Validation set (HR=3.244, 95% Cl=1.813–5.807, p<0.001)
0.
60
.8
1.
0
0.
2
0.
0
0 20 40 60 80 100
Low risk (n=185) High risk (n=41)
120 Time (month)
Table 3 Log-rank test of disease-free survival according to the nine-chemokine classifier in the training (n=246, gse39582), internal
validation (n=246, GSE39582), and external independent (n=226, gse14333) sets
Datasets Risk group (n) Disease-free survival
1-year 3-year 5-year HR (95% CI) P-value
Training set (n=246) High-risk (n=61) 91.0% 55.9% 50.1% 2.353 (1.480–3.742) <0.001 Low-risk (n=185) 92.6% 80.2% 74.8%
Validation set (n=246) High-risk (n=50) 77.5% 55.4% 55.4% 2.389 (1.428–3.996) <0.001 Low-risk (n=196) 90.4% 79.0% 75.5%
Independent set (n=226) High-risk (n=41) 84.7% 56.5% 56.5% 3.244 (1.813–5.807) <0.001 Low-risk (n=185) 95.0% 84.9% 80.7%
The prediction values of the
nine-chemokine classifier for different
biological subtypes in the combined
training and validation set
To verify the value of the nine-chemokine classifier, we fur-ther validated our findings in different molecular subtypes
of Laetitia Marisa in the combined training and validation
set (n=460, GSE39582).
We further validated the values of the nine-chemokine classifier for different biological subtypes in the combined
training and validation set (n=492, GSE39582). Patients with
high-risk scores had similar DFS (all P>0.05) with those
with low-risk scores in the subtypes C1 (one subtype with
Cancer Management and Research downloaded from https://www.dovepress.com/ by 118.70.13.36 on 20-Aug-2020
Dovepress Prognostic classifier for colorectal cancer
Table 4 Multivariate Cox regression analysis of the nine-chemokine classifier, gender, age, stage, adjuvant chemotherapy, and disease-free survival in the training (n=246, GSE39582), internal validation (n=246, GSE39582), and external independent (n=226, gse14333) sets
Datasets Variable Disease-free survival
HR (95% CI) P-value
Training set (n=246) Nine-chemokine classifier (high- vs low-risk) 2.107 (1.313–3.382) 0.002 Age (≥66 years vs <66 years) 0.944 (0.567–1.571) 0.824 Gender (female vs male) 1.023 (0.644–1.626) 0.923 Tumor stage (III vs II vs I) 1.763 (1.083–2.869) 0.023 Adjuvant chemotherapy (unknown/no vs yes) 0.761 (1.425–1.362) 0.358 Validation set (n=246) Nine-chemokine classifier (high- vs low-risk) 2.298 (1.370–3.855) 0.002 Age (≥66 years vs <66 years) 1.181 (0.695–2.004) 0.538 Gender (female vs male) 0.624 (0.377–1.035) 0.068 Tumor stage (III vs II vs I) 2.001 (1.186–3.378) 0.009 Adjuvant chemotherapy (unknown/no vs yes) 1.296 (0.726–2.317) 0.380 Independent set (n=226) Nine-chemokine classifier (high- vs low-risk) 2.914 (1.599–5.311) <0.001
Age (≥66 years vs <66 years) 0.666 (0.374–1.186) 0.167 Gender (female vs male) 1.102 (0.621–1.954) 0.740 Tumor stage (III vs II vs I) 3.235 (1.845–5.673) <0.001 Adjuvant chemotherapy (no vs yes) 0.672 (0.350–1.290) 0.232
Figure 4 Receiver operating characteristics curves of the combined model of the nine-chemokine classifier and stage, the nine-chemokine classifier and stage alone for predicting disease-free survival in the training (n=246, GSE39582), internal validation (n=246, GSE39582), and external independent (n=226, GSE14333) sets.
Abbreviation: aUC, area under the curve.
Sensitivity (%
)
Training set
02
04
06
08
0
100
100 80 60 40 20 0
Stage (AUC: 0.626) Risk score (AUC: 0.673) Combined model (AUC: 0.727)
Specificity (%)
Sensitivity (%
)
Validation set
02
04
06
08
0
100
100 80 60 40 20 0
Stage (AUC: 0.584)
P.Values
Datasets
Training set
Validation set
Indepenent set
Risk score vs stage
0.343
0.255
0.332
Combined model vs stage
0.001
0.030
0.298 Risk score (AUC: 0.651) Combined model (AUC: 0.668)
Specificity (%)
Sensitivity (%
)
Independent set
02
04
06
08
0
100
100 80 60 40 20 0
Stage (AUC: 0.678) Risk score (AUC: 0.610) Combined model (AUC: 0.704)
Specificity (%)
Cancer Management and Research downloaded from https://www.dovepress.com/ by 118.70.13.36 on 20-Aug-2020
Dovepress
Xu et al
Table 5 Comparison of the survival of colorectal cancer patients according to the nine-chemokine classifier in the combined training and validation set (n=492, gse39582)
Set Risk group (n) Disease-free survival Overall survival
1-year 3-year 5-year HR (95% CI) P-value 1-year 3-year 5-year HR (95% CI) P-value
The combined set (n=492)
High-risk (n=111) 79.8% 55.6% 52.3% 2.383
(1.690–3.359) <
0.001 93.6% 77.1% 63.5% 1.603 (1.115–2.305)
0.010 Low-risk (n=381) 90.7% 79.6% 75.2% 96.5% 85.2% 76.1%
Table 6 Multivariate Cox regression analysis of the nine-chemokine classifier, gender, age, stage, adjuvant chemotherapy, and survival in the combined training and validation set (n=492, gse39582)
Datasets Variable Disease-free survival Overall survival
HR (95% CI) P-value HR (95% CI) P-value
The combined set (n=492)
Nine-chemokine classifier (high- vs low-risk) 2.292 (1.622–3.239) <0.001 1.640 (1.139–2.362) 0.008 Age (≥66 years vs <66 years) 1.019 (0.714–1.454) 0.919 1.395 (0.967–2.031) 0.075 Gender (female vs male) 0.806 (0.573–1.132) 0.213 0.768 (0.549–1.074) 0.122 Tumor stage (III vs II vs I) 1.867 (1.303–2.674) 0.001 1.122 (0.804–1.565) 0.497 Adjuvant chemotherapy (unknown/no vsyes) 0.995 (0.662–1.495) 0.980 1.198 (0.798–1.796) 0.384
Figure 5 Kaplan–Meier curves of disease-free survival according to the nine-chemokine classifier for different stage patients with CRC in the combined training and validation set (n=492, GSE39582).
Abbreviation: CRC, colorectal cancer.
0.
4
Disease-free surviva
l
I stage (HR=7.659, 95% Cl=0.479–122.542, p=0.089)
0.
60
.8
1.
0
0.
2
0.
0
0 20 40 60 80 100 Low risk (n=27) High risk (n=4)
120 Time (month)
0.
4
Disease-free surviva
l
II stage (HR=2.400, 95% Cl=1.430–4.030, p=0.001)
0.
60
.8
1.
0
0.
2
0.
0
0 20 40 60 80 100 Low risk (n=203) High risk (n=57)
120 Time (month)
0.
4
Disease-free surviva
l
III stage (HR=2.081, 95% Cl=1.305–3.319, p=0.002)
0.
60
.8
1.
0
0.
2
0.
0
0 20 40 60 80 100 Low risk (n=151) High risk (n=50)
120 Time (month)
Cancer Management and Research downloaded from https://www.dovepress.com/ by 118.70.13.36 on 20-Aug-2020
Dovepress Prognostic classifier for colorectal cancer
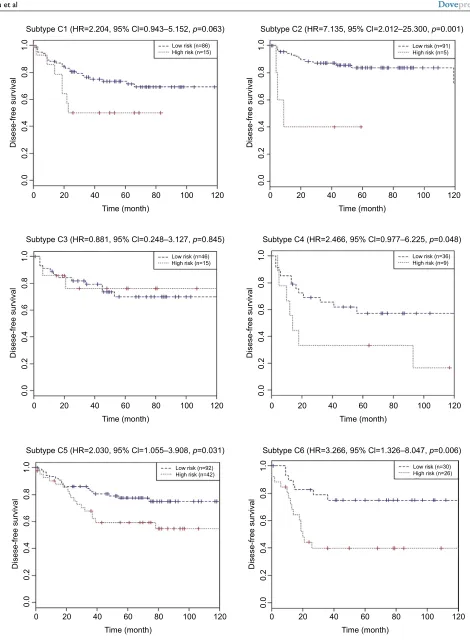
downregulated immune pathways) and C3 (one KRAS mutant subtype) (shown in Figure 6). Patients with high-risk scores
had significantly shorter DFS (all P>0.05) than those with
low-risk scores in the subtypes C2 (one deficient mismatch repair subtype), C4 (one cancer stem cell subtype), C5 (one subtype with the upregulated Wnt pathway), and C6 (one subtype with a normal-like gene expression profile) (shown in Figure 6). But the Cox regression analysis showed that the integrated lncRNA-mRNA classifier was not significantly associated with the subtypes C1, C3, and C4 patients’ DFS
(all P≥0.05). The integrated lncRNA-mRNA classifier was
an independent prognostic factor for the subtypes C2, C5,
and C6 patients’ DFS (all P<0.05).
Functional enrichment analysis
To explore the functional implication of nine chemokines, we performed functional category enrichment analysis. Func-tional enrichment analysis showed that the nine chemokine family genes were significantly enriched in 55 GO terms and 9 KEGG pathways (shown in Figure 7). The functional categories are mainly involved in eight GO terms, including immune response (GO:0006955), inflammatory response (GO:0006954), signal transduction (GO:0007165), che-motaxis (GO:0006935), cell–cell signaling (GO:0007267), extracellular space (GO:0005615), extracellular region (GO:0005576), and chemokine activity (GO:0008009). The mainly involved KEGG pathways included cytokine–cyto-kine receptor interaction (KEGG:04060), chemocytokine–cyto-kine signal-ing pathway (KEGG:04062), and toll-like receptor signalsignal-ing pathway (KEGG:04620).
Discussion
Although the TNM staging system is widely used as the risk stratification of CRC patients, it is insufficient in the
predic-tion of prognosis and estimapredic-tion for some patients.32,33
Con-flict clinical outcomes may exist among some CRC patients
with the same stage.31,32 To date, there are no clinically
uti-lized prognostic biomarkers in CRC patients. An increasing amount of evidence demonstrates that chemokines and their receptors play an important role in tumor immunity,
progres-sion, and metastasis of CRC patients.7–20 The discovery and
application of a multiple-chemokine biomarker will promote the evaluation and identification of potential high-risky recur-rence in CRC patients. To identify the prognostic chemokines, we profiled chemokines by mining the existing microarray data of Affymetrix human genome U133 plus 2.0 array. We applied a univariate Cox regression analysis to select DFS-related chemokines. Based on this data-mining method, we
have developed and validated a nine-chemokine classifier. The utility of this nine-chemokine classifier may add to the prognostic value of the TNM stage system. Furthermore, the clinical application of this nine-chemokine classifier might stratify CRC patients with the same stage into low-risk and high-risk groups of recurrence after operation. CRC patients of high-risk group had shorter DFS than those of low-risk group in stage II and III patients. The nine-chemokine clas-sifier may provide an additional biomarker for identifying potential candidates for aggressive treatment strategies. The molecular subtype should be considered before the clinical application of the prognostic signatures. Subgroup showed that the nine-chemokine classifier was not an independent prognostic factor for DFS in Marisa’s C1, C3, and C4 sub-types patients. Therefore, the nine-chemokine classifier may only be applied in Marisa’s C2, C5, and C6 subtypes patients.
The nine-chemokine classifier included three risky genes (CCL1, CCL14, and CXCL14) and six protective genes (CXCL1, CXCL3, CXCL9, CXCL10, CXCL11, and CXCL13). The previous study showed that high tissue levels of CXCL14 was associated with increased risk of
recur-rence and mortality among CRC patients.34 However, high
expressions of CXCL1,CXCL9, CXCL10, and CXCL13 may
be correlated with better prognosis of CRC patients.23,35–37
Moreover, the prognostic values of these five chemokines were not further confirmed in another validation sets. The relationship of the remaining four chemokines (CCL1, CCL14, CXCL3, CXCL11) and CRC patients’ prognosis should be further studied.
Although our study possessed the larger sample size for developing and validating this nine-chemokine classi-fier, we should acknowledge certain potential limitations. First, preliminary functional enrichment analysis indicated that the nine-chemokine classifier was mainly involved in immune response, inflammatory response, signal transduc-tion, chemotaxis, and cell–cell signaling. But the mecha-nism of these nine chemokines has not been confirmed through experimental studies. Further experimental studies may provide potential therapeutic targets for CRC patients. Second, Affymetrix human genome U133 plus 2.0 array was used for obtaining the mRNA level data of chemokine family genes in this study. But the mRNA level data of some chemokines (CCL6, CCL12, CXCL7, and CXCL15) were not available in this microarray platform. The link between the mRNA levels of these chemokines and survival of CRC patients should be further investigated by experimental studies. Third, this multi-RNA classifier was only devel-oped and validated by the mRNA-level data. The value
Cancer Management and Research downloaded from https://www.dovepress.com/ by 118.70.13.36 on 20-Aug-2020
Dovepress
Xu et al
Figure 6 Kaplan–Meier curves of disease-free survival according to the nine-chemokine classifier for different biological subtypes in the combined training and validation set (n=492, GSE39582).
Disese-free surviva
l
Subtype C1 (HR=2.204, 95% Cl=0.943–5.152, p=0.063)
0.
00
.2
0.
40
.6
0.
81
.0
0 20 40 60 80 100 120
Low risk (n=86) High risk (n=15)
Time (month)
Disese-free surviva
l
Subtype C2 (HR=7.135, 95% Cl=2.012–25.300, p=0.001)
0.
00
.2
0.
40
.6
0.
81
.0
0 20 40 60 80 100 120
Low risk (n=91) High risk (n=5)
Time (month)
Disese-free surviva
l
Subtype C3 (HR=0.881, 95% Cl=0.248–3.127, p=0.845)
0.
00
.2
0.
40
.6
0.
81
.0
0 20 40 60 80 100 120
Low risk (n=46) High risk (n=15)
Time (month)
Disese-free surviva
l
Subtype C4 (HR=2.466, 95% Cl=0.977–6.225, p=0.048)
0.
00
.2
0.
40
.6
0.
81
.0
0 20 40 60 80 100 120
Low risk (n=36) High risk (n=9)
Time (month)
Disese-free surviva
l
Subtype C5 (HR=2.030, 95% Cl=1.055–3.908, p=0.031)
0.
00
.2
0.
40
.6
0.
81
.0
0 20 40 60 80 100 120
Low risk (n=92) High risk (n=42)
Time (month)
Disese-free surviva
l
Subtype C6 (HR=3.266, 95% Cl=1.326–8.047, p=0.006)
0.
00
.2
0.
40
.6
0.
81
.0
0 20 40 60 80 100 120
Low risk (n=30) High risk (n=26)
Time (month)
Cancer Management and Research downloaded from https://www.dovepress.com/ by 118.70.13.36 on 20-Aug-2020
Dovepress Prognostic classifier for colorectal cancer
of this multi-RNA classifier was not further confirmed by the protein-level data. Moreover, future analysis of protein level on additional independent datasets would contribute to determine the potential importance of population and geographical differences.
In conclusion, we performed a comprehensive analysis of chemokine expression levels and corresponding survival information of CRC patients. We have successfully developed and validated a nine-chemokine classifier that may be a use-ful prognostic biomarker for the personalized treatment. It was the first study demonstrating a link between a multiple-chemokine classifier and tumor recurrence in CRC patients. This nine-chemokine classifier may provide an effective risk stratification of disease-free survival in CRC patients with the same stage, especially for stage II–III patients. But we should acknowledge that the protein-level data of this nine-chemokine classifier should be further validated before its clinical application.
Abbreviations
AUC, area under the curve CRC, colorectal cancer DFS, disease-free survival GEO, Gene Expression Omnibus GO, Gene Ontology
KEGG, Kyoto Encyclopedia of Genes and Genomes OS, overall survival
ROC, receiver operating characteristics
Acknowledgment
The funders had no role in study design, data collection and analysis, decision to publish, or preparation of the manuscript.
Disclosure
The authors report no conflicts of interest in this work. Figure 7 Results of functional enrichment analyses for GO (A) and KEGG (B) category.
Kegg:05323~Rheumatoid arthritis
Biogical_process Cellular_component Molecular_function
B A
Kegg:05146~Amoebiasis
Kegg:05120~Epithelial cell signaling in Helicobacter pylori infection
Kegg:04623~Cytosolic DNA-sensing pathway
Kegg:04622~RIG-l-like receptor signaling pathway
Kegg:04621~NOD-l-like receptor signaling pathway
Kegg:04620~Toll-like receptor signaling pathway
Kegg:04620~Chemokine signaling pathway
Kegg:04060~Cytokine-cytokine receptor interaction
0.0 2.5 5.0
5 10 15 20 –log10 (pValue)
Number of genes 7.5
8
6
4
Number of gene
s
2
0
GO:0006954 GO:0007165 GO:0006955 GO:0006935 GO:0002544 GO:0006874 GO:0030335 GO:0007186 GO:0043085 GO:0008284 GO:0042742 GO:0006952 GO:0007267 GO:0030036 GO:0007517 GO:0002467 GO:0032496 GO:0007204 GO:0006968 GO:0016525 GO:0009306 GO:0030593 GO:0051607 GO:0008015 GO:0009409 GO:0010332 GO:0033280 GO:0002690 GO:0045765 GO:0034605 GO:0010820 GO:0048535 GO:0033634 GO:0033625 GO:0002518 GO:0032861 GO:0002920 GO:0035754 GO:0035768 GO:0010996 GO:0005615 GO:0005576 GO:0009897 GO:0008009 GO:0005125 GO:0005102 GO:0008083 GO:0008201 GO:0048603 GO:0031735 GO:0008047 GO:0008603 GO:0048018 GO:0048248 GO:0031724
Cancer Management and Research downloaded from https://www.dovepress.com/ by 118.70.13.36 on 20-Aug-2020
Dovepress
Xu et al
References
1. Siegel RL, Miller KD, Jemal A. Cancer statistics, 2016. CA Cancer J
Clin. 2016;66(1):7–30.
2. Alizadeh AA, Aranda V, Bardelli A, et al. Toward understanding and
exploiting tumor heterogeneity. Nat Med. 2015;21(8):846–853.
3. Raman D, Sobolik-Delmaire T, Richmond A. Chemokines in health and
disease. Exp Cell Res. 2011;317(5):575–589.
4. Zlotnik A, Yoshie O. Chemokines: a new classification system and their
role in immunity. Immunity. 2000;12(2):121–127.
5. Murphy PM, Baggiolini M, Charo IF, et al. International union of
phar-macology. XXII. Nomenclature for chemokine receptors. Pharmacol
Rev. 2000;52(1):145176.
6. Sarvaiya PJ, Guo D, Ulasov I, Gabikian P, Lesniak MS. Chemokines in
tumor progression and metastasis. Oncotarget. 2013;4(12):2171–2185.
7. Yamamoto M, Kikuchi H, Ohta M, et al. TSU68 prevents liver metas-tasis of colon cancer xenografts by modulating the premetastatic niche.
Cancer Res. 2008;68(23):9754–9762.
8. Kawada K, Hosogi H, Sonoshita M, et al. Chemokine receptor
CXCR3 promotes colon cancer metastasis to lymph nodes. Oncogene.
2007;26(32):4679–4688.
9. Murakami T, Kawada K, Iwamoto M, et al. The role of CXCR3 and CXCR4
in colorectal cancer metastasis. Int J Cancer. 2013;132(2):276–287.
10. Kim J, Takeuchi H, Lam ST, et al. Chemokine receptor CXCR4 expres-sion in colorectal cancer patients increases the risk for recurrence and
for poor survival. J Clin Oncol. 2005;23(12):2744–2753.
11. Ottaiano A, Franco R, Aiello Talamanca A, et al. Overexpression of both CXC chemokine receptor 4 and vascular endothelial growth factor proteins predicts early distant relapse in stage II-III colorectal cancer
patients. Clin Cancer Res. 2006;12(9):2795–2803.
12. Schimanski CC, Schwald S, Simiantonaki N, et al. Effect of chemokine receptors CXCR4 and CCR7 on the metastatic behavior of human
colorectal cancer. Clin Cancer Res. 2005;11(5):1743–1750.
13. Yopp AC, Shia J, Butte JM, et al. CXCR4 expression predicts patient outcome and recurrence patterns after hepatic resection for colorectal
liver metastases. Ann Surg Oncol. 2012;19 Suppl 3:339–346.
14. Matsusue R, Kubo H, Hisamori S, et al. Hepatic stellate cells promote liver metastasis of colon cancer cells by the action of SDF-1/CXCR4
axis. Ann Surg Oncol. 2009;16(9):2645–2653.
15. Bailey C, Negus R, Morris A, et al. Chemokine expression is associ-ated with the accumulation of tumour associassoci-ated macrophages (TAMs)
and progression in human colorectal cancer. Clin Exp Metastasis.
2007;24(2):121–130.
16. Hu H, Sun L, Guo C, et al. Tumor cell-microenvironment interaction models coupled with clinical validation reveal CCL2 and SNCG as two
predictors of colorectal cancer hepatic metastasis. Clin Cancer Res.
2009;15(17):5485–5493.
17. Chang LY, Lin YC, Mahalingam J, et al. Tumor-derived chemokine
CCL5 enhances TGF-β-mediated killing of CD8(+) T cells in colon
cancer by T-regulatory cells. Cancer Res. 2012;72(5):1092–1102.
18. Itatani Y, Kawada K, Fujishita T, et al. Loss of SMAD4 from colorectal
cancer cells promotes CCL15 expression to recruit CCR1+ myeloid cells
and facilitate liver metastasis. Gastroenterology. 2013;145(5):1064–1075.
19. Liu J, Zhang N, Li Q, et al. Tumor-associated macrophages recruit CCR6+
regulatory T cells and promote the development of colorectal cancer via
enhancing CCL20 production in mice. PLoS One. 2011;6(4):e19495.
20. Zheng J, Yang M, Shao J, et al. Chemokine receptor CX3CR1
contributes to macrophage survival in tumor metastasis. Mol Cancer.
2013;12(1):141.
21. Zeng YJ, Lai W, Wu H, et al. Neuroendocrine-like cells -derived CXCL10 and CXCL11 induce the infiltration of tumor-associated
mac-rophage leading to the poor prognosis of colorectal cancer. Oncotarget.
2016;7(19):27394–27407.
22. Stanisavljević L, Aßmus J, Storli KE, et al. CXCR4, CXCL12 and the
relative CXCL12-CXCR4 expression as prognostic factors in colon
cancer. Tumour Biol. 2016;37(6):7441–7452.
23. Jiang Z, Xu Y, Cai S. CXCL10 expression and prognostic significance in
stage II and III colorectal cancer. Mol Biol Rep. 2010;37(6):3029–3036.
24. Zhang Y, Szustakowski J, Schinke M. Bioinformatics analysis of
micro-array data. Methods Mol Biol. 2009;573:259–284.
25. Marisa L, de Reyniès A, Duval A, et al. Gene expression classification of colon cancer into molecular subtypes: characterization, validation,
and prognostic value. PLoS Med. 2013;10(5):e1001453.
26. Lossos IS, Czerwinski DK, Alizadeh AA, et al. Prediction of survival in diffuse large-B-cell lymphoma based on the expression of six genes.
N Engl J Med. 2004;350(18):1828–1837.
27. Hu Z, Chen X, Zhao Y, et al. Serum microRNA signatures identified in a genome-wide serum microRNA expression profiling predict
survival of non-small-cell lung cancer. J Clin Oncol. 2010;28(10):
1721–1726.
28. Kang J, D’Andrea AD, Kozono D. A DNA repair pathway-focused score for prediction of outcomes in ovarian cancer treated with platinum-based
chemotherapy. J Natl Cancer Inst. 2012;104(9):670–681.
29. Tabas-Madrid D, Nogales-Cadenas R, Pascual-Montano A. Gene-Codis3: a non-redundant and modular enrichment analysis tool for
functional genomics. Nucleic Acids Res. 2012;40(Web Server issue):
W478–W483.
30. Nogales-Cadenas R, Carmona-Saez P, Vazquez M, et al. GeneCodis: interpreting gene lists through enrichment analysis and integration of
diverse biological information. Nucleic Acids Res. 2009;37(Web Server
issue):W317–W322.
31. Carmona-Saez P, Chagoyen M, Tirado F, Carazo JM, Pascual-Montano A. GENECODIS: a web-based tool for finding significant concurrent
annotations in gene lists. Genome Biol. 2007;8(1):R3.
32. Zinicola R, Pedrazzi G, Haboubi N, Nicholls RJ. The degree of
extramu-ral spread of T3 rectal cancer: a plea to the UICC and AJCC. Colorectal
Dis. 2017;19(3):310.
33. Li J, Yang S, Hu J, et al. Tumor deposits counted as positive lymph nodes in TNM staging for advanced colorectal cancer: a retrospective
multicenter study. Oncotarget. 2016;7(14):18269–18279.
34. Zeng J, Yang X, Cheng L, et al. Chemokine CXCL14 is associated with prognosis in patients with colorectal carcinoma after curative resection.
J Transl Med. 2013;11:6.
35. Le Rolle AF, Chiu TK, Fara M, et al. The prognostic significance of CXCL1 hypersecretion by human colorectal cancer epithelia and
myo-fibroblasts. J Transl Med. 2015;13:199.
36. Wu Z, Huang X, Han X, et al. The chemokine CXCL9 expression is associated with better prognosis for colorectal carcinoma patients.
Biomed Pharmacother. 2016;78:8–13.
37. Agesen TH, Sveen A, Merok MA, et al. ColoGuideEx: a robust
gene classifier specific for stage II colorectal cancer prognosis. Gut.
2012;61(11):1560–1567.
Cancer Management and Research downloaded from https://www.dovepress.com/ by 118.70.13.36 on 20-Aug-2020
Dovepress Prognostic classifier for colorectal cancer
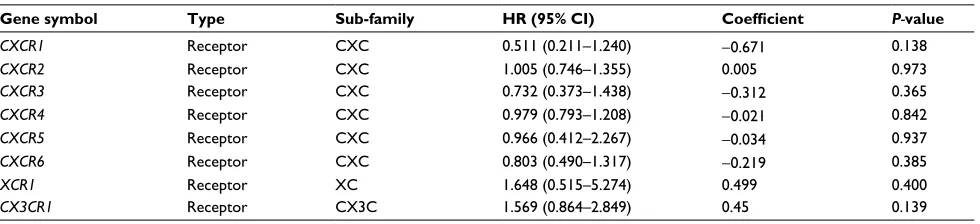
Supplementary material
Table S1 Univariate Cox regression analysis of chemokine family genes associated with disease-free survival in the training set (n=246, gse39582)
Gene symbol Type Sub-family HR (95% CI) Coefficient P-value
CCL1 ligand CC 2.729 (1.118–6.662) 1.004 0.027
CCL2 ligand CC 1.169 (0.970–1.410) 0.156 0.102
CCL3 ligand CC 1.004 (0.844–1.194) 0.004 0.962
CCL4 ligand CC 1.019 (0.823–1.261) 0.019 0.863
CCL5 ligand CC 0.918 (0.757–1.114) −0.085 0.387
CCL7 ligand CC 1.118 (0.728–1.719) 0.112 0.610
CCL8 ligand CC 0.993 (0.830–1.190) −0.007 0.943
CCL11 ligand CC 1.019 (0.868–1.196) 0.018 0.822
CCL13 ligand CC 1.152 (0.743–1.784) 0.141 0.527
CCL14 ligand CC 1.400 (1.043–1.879) 0.336 0.025
CCL15 ligand CC 1.051 (0.823–1.344) 0.050 0.688
CCL16 ligand CC 1.556 (0.916–2.643) 0.442 0.102
CCL17 ligand CC 1.240 (0.699–2.203) 0.215 0.462
CCL18 ligand CC 0.987 (0.853–1.142) −0.013 0.861
CCL19 ligand CC 1.063 (0.902–1.252) 0.061 0.467
CCL20 ligand CC 0.885 (0.771–1.015) −0.122 0.082
CCL21 ligand CC 1.124 (0.924–1.366) 0.117 0.242
CCL22 ligand CC 0.877 (0.538–1.430) −0.131 0.600
CCL23 ligand CC 1.211 (0.701–2.090) 0.191 0.492
CCL24 ligand CC 1.132 (0.919–1.395) 0.124 0.243
CCL25 ligand CC 0.739 (0.466–1.172) −0.302 0.199
CCL26 ligand CC 0.938 (0.705–1.250) −0.064 0.664
CCL27 ligand CC 1.507 (0.673–3.373) 0.410 0.319
CCL28 ligand CC 1.058 (0.821–1.363) 0.056 0.664
CXCL1 ligand CXC 0.824 (0.697–0.974) −0.194 0.024
CXCL2 ligand CXC 0.870 (0.608–1.243) −0.140 0.444
CXCL3 ligand CXC 0.836 (0.708–0.986) −0.179 0.034
CXCL5 ligand CXC 0.939 (0.824–1.071) −0.062 0.349
CXCL6 ligand CXC 0.951 (0.810–1.115) −0.051 0.534
CXCL8 ligand CXC 0.933 (0.810–1.073) −0.070 0.329
CXCL9 ligand CXC 0.840 (0.722–0.977) −0.174 0.024
CXCL10 ligand CXC 0.832 (0.712–0.972) −0.184 0.021
CXCL11 ligand CXC 0.878 (0.774–0.995) −0.131 0.041
CXCL12 ligand CXC 1.107 (0.907–1.352) 0.102 0.319
CXCL13 ligand CXC 0.870 (0.763–0.992) −0.140 0.037
CXCL14 ligand CXC 1.146 (1.008–1.302) 0.136 0.037
CXCL16 ligand CXC 0.901 (0.650–1.249) −0.104 0.531
CXCL17 ligand CXC 0.814 (0.525–1.262) −0.206 0.357
XCL1 ligand XC 0.923 (0.524–1.627) −0.080 0.782
XCL2 ligand XC 1.004 (0.744–1.355) 0.004 0.978
CX3CL1 ligand CX3C 0.896 (0.613–1.312) −0.109 0.574
CCR1 Receptor CC 1.079 (0.786–1.481) 0.076 0.638
CCR2 Receptor CC 0.965 (0.632–1.475) −0.035 0.870
CCR3 Receptor CC 1.001 (0.553–1.815) 0.001 0.996
CCR4 Receptor CC 1.356 (0.600–3.062) 0.304 0.464
CCR5 Receptor CC 0.861 (0.595–1.244) −0.15 0.425
CCR6 Receptor CC 0.937 (0.622–1.411) −0.065 0.756
CCR7 Receptor CC 0.880 (0.667–1.161) −0.128 0.364
CCR8 Receptor CC 1.127 (0.429–2.960) 0.119 0.808
CCR9 Receptor CC 1.190 (0.391–3.620) 0.174 0.759
CCR10 Receptor CXC 1.239 (0.880–1.745) 0.214 0.220
(Continued)
Cancer Management and Research downloaded from https://www.dovepress.com/ by 118.70.13.36 on 20-Aug-2020
Dovepress
Cancer Management and Research
Publish your work in this journal
Submit your manuscript here: https://www.dovepress.com/cancer-management-and-research-journal
Cancer Management and Research is an international, peer-reviewed open access journal focusing on cancer research and the optimal use of preventative and integrated treatment interventions to achieve improved outcomes, enhanced survival and quality of life for the cancer patient. The manuscript management system is completely online and includes
a very quick and fair peer-review system, which is all easy to use. Visit http://www.dovepress.com/testimonials.php to read real quotes from published authors.
Dovepress
Xu et alGene symbol Type Sub-family HR (95% CI) Coefficient P-value
CXCR1 Receptor CXC 0.511 (0.211–1.240) −0.671 0.138
CXCR2 Receptor CXC 1.005 (0.746–1.355) 0.005 0.973
CXCR3 Receptor CXC 0.732 (0.373–1.438) −0.312 0.365
CXCR4 Receptor CXC 0.979 (0.793–1.208) −0.021 0.842
CXCR5 Receptor CXC 0.966 (0.412–2.267) −0.034 0.937
CXCR6 Receptor CXC 0.803 (0.490–1.317) −0.219 0.385
XCR1 Receptor XC 1.648 (0.515–5.274) 0.499 0.400
CX3CR1 Receptor CX3C 1.569 (0.864–2.849) 0.45 0.139
Table S1 (Continued)
Cancer Management and Research downloaded from https://www.dovepress.com/ by 118.70.13.36 on 20-Aug-2020