DOI: 10.1534/genetics.106.068783
Comparative Physical Mapping Between
Oryza sativa
(AA Genome Type)
and
O. punctata
(BB Genome Type)
HyeRan Kim,*
,1Phillip San Miguel,
†William Nelson,
‡Kristi Collura,* Marina Wissotski,*
Jason G. Walling,
§,1Jun Pyo Kim,* Scott A. Jackson,
§Carol Soderlund
‡and
Rod A. Wing*
,2*Arizona Genomics Institute, University of Arizona, Tucson, Arizona 85721,†Department of Horticulture, Purdue University, West Lafayette, Indiana 47907,§Department of Agronomy, Purdue University, West Lafayette, Indiana 47907
and‡Arizona Genomics Computational Laboratory, University of Arizona, Tucson, Arizona 85721 Manuscript received November 22, 2006
Accepted for publication February 9, 2007
ABSTRACT
A comparative physical map of the AA genome (Oryza sativa) and the BB genome (O. punctata) was constructed by aligning a physical map ofO. punctata, deduced from 63,942 BAC end sequences (BESs) and 34,224 fingerprints, onto the O. sativagenome sequence. The level of conservation of each chro-mosome between the two species was determined by calculating a ratio of BES alignments. The alignment result suggests more divergence of intergenic and repeat regions in comparison to gene-rich regions. Further, this characteristic enabled localization of heterochromatic and euchromatic regions for each chromosome of both species. The alignment identified 16 locations containing expansions, contractions, inversions, and transpositions. By aligning 40% of thepunctataBES on the map, 87% of thepunctataFPC map covered 98% of theO. sativagenome sequence. The genome size ofO. punctatawas estimated to be 8% larger than that ofO. sativawith individual chromosome differences of 1.5–16.5%. The sum of expan-sions and contractions observed in regions.500 kb were similar, suggesting that most of the contractions/ expansions contributing to the genome size difference between the two species are small, thus preserving the macro-collinearity between these species, which diverged2 million years ago.
C
OMPARATIVE genome analysis is proving to be an excellent tool, not only to discover genes and understand their functions, but also to unravel the evolutionary relationships between species. Since re-lated species are derived from recent common ances-tors, it comes as no surprise that in both dicots and monocots extensive genetic collinearity was found when related species were mapped using common RFLP probe sets (Bonierbaleet al. 1988; Hulbertet al.1990; Ahnand Tanksley1993; Jenaet al. 1994). While
extensive collinearity seems to be limited to the genus level among dicots (Tanksleyet al.1988), sufficient
col-linearity exists to allow rough alignment of genetic maps across entire genomes throughout the entire ce-real clade (Mooreet al. 1995). The complete sequences
of the model organisms Arabidopsis and rice (A rabi-dopsisGenomeInitiative2000; InternationalRice
Genome Sequencing Project 2005) allow
propaga-tion of the annotapropaga-tion and structure of these genomes to their taxonomic relatives. The rearrangement events in the evolutionary history of the genus Arabidopsis has been outlined by examining the level of synteny be-tween the linkage maps of the Arabidopsis species and the Arabidopsis genome sequence (Yogeeswaranet al.
2005; Hansson et al. 2006). The major chromosomal
rearrangements between Arabidopsis and Asteraceae (Timmset al. 2006) and the structural divergence of the
genic regions between Arabidopsis and Brassica (Suwabe
et al. 2006; Town et al. 2006) also have been
dem-onstrated by using the complete Arabidopsis reference sequence.
Although rice is considered a model plant and placed at the center of the cereal crop syntenic circle (Moore
et al. 1995; Galeand Devos1998a,b; Devos2005), only
a few genomewide comparative analyses as yet have been performed using the rice genome sequence as a reference. The sorghum genome was compared to the rice genome sequence using two sorghum physical maps integrated with genetic markers and BAC hybrid-ization data (Bowers et al. 2005). Various local
rear-rangements between other cereals and rice have been reported in sequence-level comparisons using the rice genome sequence as the reference (Chenet al. 1998;
Goff et al. 2002; Bennetzen and Ma 2003; Sorrells Sequence data from this article have been deposited with the
EMBL/GenBank Data Libraries under accession nos. CW502583– CW509125, CW514009–539178, CW620733–CW624836, CW628185–
633039, CW672722–CW676096, CW691361–692844, CW748472–
CW754418, CW775494–CW778432, CW778534–CW784312, CW829027– CW834867, CW848277–CW850106, and CW935822–936338.
1Present address:Department of Horticulture, University of Wisconsin,
Madison, WI 53706.
2Corresponding author: Arizona Genomics Institute, University of
Arizona, Tucson, AZ 85721. E-mail: rwing@ag.arizona.edu
et al. 2003; Salse et al. 2004; Rice Chromosome 3
SequencingConsortium2005). Other studies focused
on within-family divergence on the scale of 10–60 mil-lion years ago (MYA) (Galeand Devos1998b; Keller
and Feuillet2000) and were restricted to genic regions
or small homologous regions of the grass genomes. The subspecies of rice, japonica and indica, which di-verged 0.44 MYA (MA and Bennetzen 2004), were
compared at the DNA sequence level, illustrating the genomic microstructural polymorphisms that contrib-ute to intraspecific phenotypic variations (Hanand Xue
2003). Such comparative sequence analyses revealed the detailed composition and organizational differen-ces between the cereal genomes, as well as the rate and modes of genomic change. To date, however, no studies in plants have focused on comparing different genome groups within a single genus at the whole-genome level.
The annual type ofOryza punctatais a diploid wild rice species belonging to the BB genome group of the genus Oryza and is distributed mainly in Africa. The AA and BB genome types were distinguished on the basis of evidence derived from interspecific crossing, cytogenet-ics, and genomic DNA hybridization. Evolutionally, the BB genome group is the closest to the AA genome group, which contains sequenced cultivated rice (O. sativa). Geet al.(2005) estimated that the AA and
BB genome groups diverged from a common ancestor 2 MYA. As this species is known to possess resistance to bacterial blight and brown plant hopper, both of which are considered important traits for improving cultivated rice, information concerning theO. punctatagenome is of keen interest. The close evolutionary relationship betweenO. sativaandO. punctataprovides the potential for direct utilization ofO. sativasequence information to investigate the BB genome (or vice versa) for both crop improvement and evolutionary studies. Currently, only a limited amount of knowledge concerning the
O. punctatagenome, especially in terms of its structural composition, is known.
Cloned DNA ‘‘fingerprinting’’ is a staple of genomics (Olsonet al. 1986) and has been adapted to develop
whole-genome physical maps. In general, DNA from a set of clones is restriction digested and the resulting fragments sized using agarose gel or automated cap-illary electrophoresis. Clones containing the identical segment of a genome will generate the same set of re-striction enzyme fragments. Clones that overlap will share a subset of their respective restriction fragments. To analyze large data sets of fingerprints generated from genomic libraries, a software, FPC (Soderlund et al.
2000), is deployed. Therein the concept of a shared ‘‘restriction fragment’’ is generalized to that of a ‘‘con-sensus band’’ (CB). FPC can assemble thousands of clone fingerprints into ‘‘contigs,’’ bundled together on the basis of their linear overlaps, evidenced by shared CBs. FPC maps have served crucial roles in genome
re-search projects (Marra et al. 1997; Mozo et al. 1999;
InternationalHumanGenomeMappingConsortium
2001; Chenet al. 2002) for map-based cloning,
clone-by-clone sequencing, or selecting a minimal tiling path of clones (Engleret al. 2003).
Here, we report a deep coverage BAC-based, FPC physical map ofO. punctataconjoined with an exhaus-tive set of BAC end sequences (BESs) as a resource to study the BB diploid genome of Oryza. By aligning the BES of the clones composing the FPC physical map, whole-genome-level comparisons were made between the BB diploid genome and the sequenced AA dip-loid genome, O. sativa(InternationalRiceGenome
SequencingProject2005).
MATERIALS AND METHODS
BAC plasmid DNA extraction:A large insert BAC library of
O. punctata(accession no. IRGC 105690) constructed by the Arizona Genomics Institute (Ammirajuet al. 2006) was used for generating BESs and SNaPshot fingerprints.
DNA was extracted from 36,864 BAC clones by a modified alkaline lysis method in a 96-well format. Briefly, BAC clones of O. punctatawere inoculated into a deep 96-well plate (Marsh) containing 1.2 ml of 23YT media plus 12.5mg/ml chloram-phenicol. The plates were covered with AirPore Tape Sheets (ISC BioExpress, Kaysville, UT) and shaken at 250 rpm at 37° for 18 hr. The cells were harvested by centrifugation ( Jouan, Winchester, VA) at 3200 rpm (19703g) for 15 min, followed by decanting the media. Cell pellets were resuspended in 150ml of solution I (50 mmTrisCl, 10 mmEDTA, pH 8.0, 100mg/ml RNase A) followed by shaking using a vortex. Lysis and neutralization were achieved by adding 150ml of solution II (0.2mNaOH, 1% SDS) and 150ml of solution III (3.0m potassium acetate, pH 5.5) into the sample plates without a lysis incubation time. The lysates were then cleared and pre-cipitated as follows. They were transferred to a stacked filter, Unifilter (Whatman, Brentford, UK), and receiver, Uniplate (Whatman), containing 270ml of isopropanol/well. The stacked filter and receiver plate were then centrifuged at 4°for 30 min at 3200 rpm and decanted. After adding 400 ml of 70% ethanol, the plates were centrifuged at 4°for 10 min at 3200 rpm. A brief (,10 sec) upside-down spin was performed to remove the remaining liquid and the plates were air dried for 10 min or until the DNA pellets appeared transparent in the wells. Each precipitated DNA pellet was resuspended in 25ml of 1 mmTris (pH 8.0) and used immediately or stored at 4°for future use. All pipetting and liquid-handling steps were performed using a 96-channel liquid-handling system, Quadra 96 model 320 (Tomtec, Hamden, CT).
BAC end sequencing:In 384-well plates, a 12-ml total volume
separated on ABI 3730xl DNA capillary sequencers (50-cm capillary array) with default 2-hr run conditions. Sequences were base called using the program Phred (Ewing et al. 1998; Ewing and Green1998), and vector and low-quality sequences were trimmed by the program LUCY (Chouand
Holmes 2001). A total of 68,384 BESs were deposited in
GenBank (for sequences, search using OP__Ba; for trace files, search using CENTER_PROJECT¼‘OMAP_PUNCTATA’).
SNaPshot fingerprinting and FPC assembly:The SNaPshot
fingerprinting technique was used as described by Luoet al. (2003) but the restriction digest and fragment end-labeling steps were combined. Briefly, a 30-ml total volume reaction containing 10 ml BAC DNA (1.2–1.6 mg); 5 units each of BamHI, EcoRI, XbaI, XhoI, and HaeIII restriction endonu-cleases; 13 NEB buffer 2 (New England BioLabs, Beverly, MA); 5mg bovine serum albumin; 1mg DNase-free RNase A; and 1 mmMgCl2; 1ml of SNaPshot Multiplex Ready reaction mix (ABI) was incubated in a thermocycler for 1 hr at 37°and then for 1 hr at 65°.
SNaPshot reaction products were purified and dissolved in 10ml of Hi-Di formamide containing 0.05ml of 500 Liz size standard (ABI), transferred into 384-well plates, and loaded into ABI 3730xl DNA sequencers. Capillary electrophoresis was performed with 36-cm capillary arrays using the ABI default GeneScan module. Peak areas, heights, colors, and fragment sizes of each peak were collected for each BAC using the ABI Data Collection program, and the data was processed by GeneMapper software (ABI) to generate files (one for each clone) containing fingerprint peaks and sizes. These files were further filtered as follows. Files containing,25 or.179 fragment peaks or missing.3 size standard peaks were dis-carded. Files representing cloned chloroplast DNA were also discarded. Only peaks representing fragments between 75 and 500 bases were used in subsequence FPC assembly. The initial assembly was built with a Sulston score cutoff of 1e-50 and a tolerance of 4 using FPC (Soderlundet al. 2000). The build was processed through the DQ function of FPC to break up contigs having.15% questionable clones (Q-clones). The as-sembly was further refined by contig end merging (with 61 CB units defining the distance from the end) with less-stringent Sulston score cutoff values (down to 1e-21) and by requiring two overlapping clone pairs for each merge. Finally, singletons were merged at a Sulston score cutoff of 1e-21. This initial FPC assembly is defined as a phase I physical map.
Synteny Mapping and Analysis Program alignment:Synteny
Mapping and Analysis Program (SyMAP) (Soderlundet al. 2006) was used to display alignments betweenO. punctataBESs embedded within the FPC maps and theO. sativareference sequence (InternationalRiceGenomeSequencingP ro-ject2005;O. sativapseudomolecule version 4). To create a comparison file for SyMAP to display, a sequence-similarity search betweenO. punctataBES and theO. sativareference sequence was performed using BLAT (Kent2002) after soft repeat masking using Repeatmasker (with the parameters –xsmall –e crossmatch –nolow -no_is -norna –q) against the Arizona Genomics Institute Oryza repeat database composed of The Institute for Genomic Research Oryza repeats V3.1 (ftp:// ftp.tigr.org/pub/data/TIGR_Plant_Repeats/) and Oryza LTR retroelements isolated from previous analysis (Chaparroet al. 2006). BLAT was performed with the following parameters: ‘-minIdentity¼70 -tileSize¼10 -minScore¼30 -qMask¼lower -maxIntron¼10000’. The first three parameters set a low strin-gency: ‘‘-qMask’’ specifies lowercase masking on theO. punctata BES, and ‘‘-maxIntron’’ allows for insertions on theO. sativa reference sequence of up to 10 kb. Alignments for BES from the O. punctataFPC map onto theO. sativareference sequence were then computed and displayed by SyMAP software (Soderlund et al. 2006).
FPC manual editing: The phase I FPC map was manually
edited to improve contiguity and to correct any discrepancies between the FPC assembly and the SyMAP alignments. Contigs that showed conflicting alignments were broken at high stringency (Sulston score cutoff: 1e-60). Contigs were merged by searching the entire FPC fingerprint database for matches to fingerprints from clones representing contig termini above the Sulston score cutoff of 1e-15. Contigs were merged if (1) more than two clones from one contig termini matched fingerprints of at least two clones from the other contig termini or (2) the fingerprint of one clone of the contig termini matched only one clone of the other termini and included overlapping evidence of those two contigs detected by SyMAP alignment. Those contigs showing inverted align-ment without evidence of inversion were flipped.
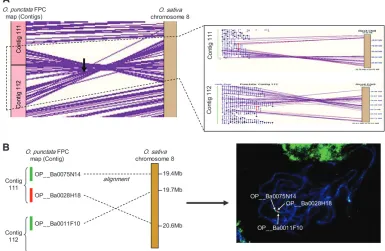
A large inversion on chromosome 8 was detected by alignment and was confirmed by fluorescencein situ hybrid-ization (FISH) using pachytene chromosomes ofO. punctata (accession no.105690) and O. punctata BAC clones (OP__ Ba0075N14, OP__Ba0028H18, and OP__Ba0011F10) from each end of the breakpoints. The FISH procedure and image capture were conducted according to Wallinget al. (2005).
RESULTS
The FPC-based physical map ofO.punctata: Success-ful fingerprints were generated from 93% (34,224 clones) of the 12-fold redundantO. punctataBAC library (Ammirajuet al. 2006) using the SNaPshot
fingerprint-ing method (Luoet al. 2003). The remaining 7% failure
represented an amalgam of library clone growth fail-ures, SNaPshot reaction failfail-ures, and chloroplast DNA contaminants. The O. punctata BAC fingerprints were assembled using FPC (Soderlund et al. 2000) to
gen-erate a phase I FPC assembly consisting of 490 contigs and 1488 singleton clones (4.3% of total fingerprints). The average number of consensus band units (CB units) per clone was 117.4, where one CB unit was estimated to be 1.2760.2 kb on the basis of an analysis of a random sampling of 539 BAC clones of known sizes divided by the number of CB units that these clones spanned. The total number of contigs was reduced to 208 by manual editing, which represented a total of 329,435 CB units. Using 1.27 kb/CB unit, the physical map spanned418 Mb and thus represented 98.4% of the O. punctata
genome on the basis of a size of 425 Mb (Ammirajuet al.
2006).
A Q-clone in FPC is defined as a clone that does not align to the CB map of its FPC contig. This can be caused by extra or missing bands of the clone’s total band count against the CB map (Soderlund et al. 2000; Nelson
et al. 2005). Therefore, Q-clones can be used to detect possible chimeric or low-quality contigs. The Q-clones in theO. punctataFPC map were removed by disassem-bling low-quality contigs containing .15% Q-clones. The physical map is available at http://www.genome. arizona.edu/symap_punctata.
O. punctataclones were produced with an average read length of 710 bp and these were deposited in GenBank. These sequences represented 48.6 Mb of genomic se-quence forO. punctata, which, on the basis of a genome size of 425 Mb (Ammirajuet al. 2006), is 11.4% of the
whole genome. This is equivalent to one sequence tag/ 6.2 kb. Of the total BES, 94% (63,942 BES) had fin-gerprints in the FPC map. A high proportion of clones (89.4%/32,284 clones) had sequences from both ends, and 93.6% (30,228 clones) of those had successful fingerprints in theO. punctataFPC map.
The 63,942 BES from the successfully fingerprinted
O. punctata clones were incorporated into the FPC physical map. Subsequently, BESs on the FPC physical map were aligned onto theO. sativareference sequence (International Rice Genome Sequencing Project
2005) by sequence similarity and 60,163 BESs were assigned chromosome positions. The alignments of the
O. punctataphysical map to theO. sativareference se-quence using the shared sese-quences were generated by SyMAP (Soderlund et al. 2006) and are graphically
represented in Figure 1. In total, 43% (25,572 BES) of the O. punctataBESs that were assigned genome posi-tions on the physical map were aligned onto theO. sativa
reference sequence (International Rice Genome
SequencingProject2005) with an averagee-value of
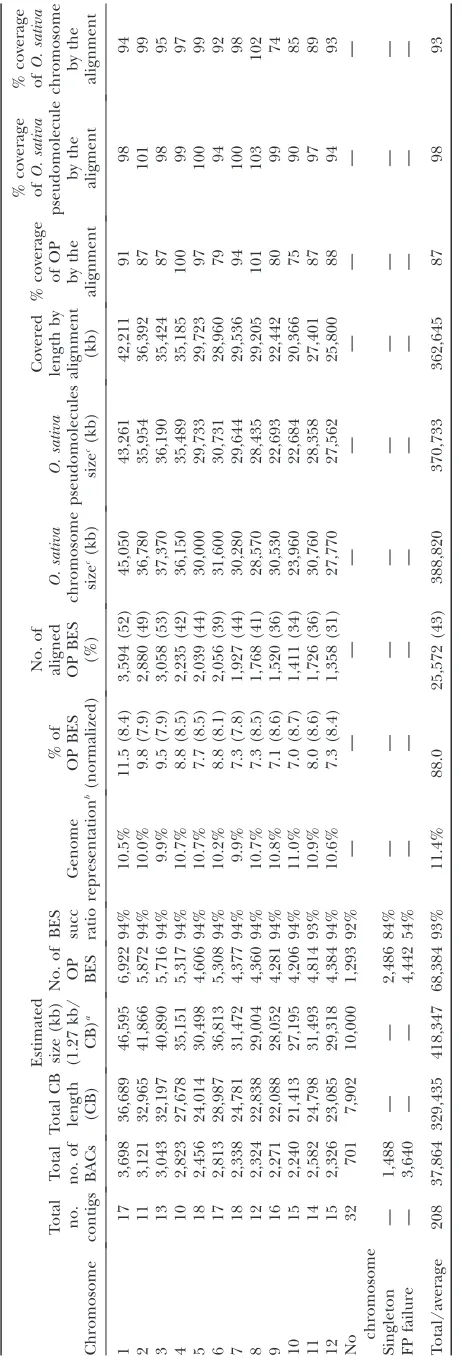
1e-132 and an identity of 93%. This alignment anchored 176 contigs onto the O. sativa chromosomes contain-ing 94% of the total fcontain-ingerprints and representcontain-ing 321,533 CB units (Table 1). The chromosome-anchored contigs cover an estimated size of 408 Mb, 96% of the O. punctata genome, whereas the remaining 32
Figure1.—Detailed alignment view of the comparative physical map ofO. punctata(BB genome type) andO. sativa(AA
nonanchored contigs correspond to 10 Mb, 2.4% of the genome (on the basis of 1.27 kb/CB and 425 Mb of
punctatagenome size; Ammirajuet al. 2006) (Table 1).
The number of anchored contigs for each chromosome ranges from 10 (chromosome 4) to 18 (chromosome 7) and the coverage of each chromosome ranges from 92% (chromosome 9) to 116% (chromosome 6) on the basis of theO. sativachromosome size (InternationalRice
Genome Sequencing Project 2005). The sizes of
O. punctatachromosomes were calculated on the basis of 1.27 kb/CB and compared to that ofO. sativa. Chro-mosomes 4 and 9 ofO. punctata were slightly smaller than that ofO. sativaby 1.0 and 2.5 Mb, respectively. The remaining 10 chromosomes were larger inO. punctata
than inO. sativa. The increases in size range from 0.4 Mb on chromosome 8 to 5.2 Mb on chromosome 6 (Table 1).
Comparative physical mapping between O. punctata
and O.sativa: By aligning theO. punctataFPC physical map onto theO. sativagenome sequence, a comparative physical map between the two species was constructed (Figure 1). The distribution of BES on eachO. punctata
chromosome was fairly even, ranging from 7.8 to 8.7% (Table 1) after normalization based on individual chro-mosome sizes inO. punctata. In contrast, the ratio of aligned BES of O. punctata to the O. sativa genome varied by chromosome. Overall, the 25,572O. punctata
BES that mapped onto theO. sativareference sequence represented 87% of theO. punctataFPC physical map and 98% of theO. sativareference sequence (Table 1), which suggests that the O. punctata genome is larger than theO. sativagenome. TheO. sativachromosome least represented in the alignment was chromosome 12 and the most represented was chromosome 3, aligning 31 and 53% of each chromosome BES, respectively (Table 1). However, the portion of the chromosome covered by the alignment was highest in chromosome 8 and lowest in chromosome 10.
Cheng et al. (2001) characterized the 12
chromo-somes of cultivated rice cytogenetically by DAPI staining and was able to determine the positions of major euchromatic and heterochromatic blocks as well as the centromeres. Chromosomes 4 and 10, in particular, were noted for their distinct patterns, in which one-third of each chromosome, including both entire short arms and parts of the long arms, was highly heterochro-matic (Cheng et al. 2001). The density of BES
align-ments shown in Figure 1 reflect the level of structural conservation between the two species. In general, dense alignments mirror the placement of euchromatic re-gions, and areas of few alignments represent hetero-chromatic regions, thus depicting the distribution patterns of euchromatic and heterochromatic regions on the chromosomes. The FPC contigs corresponding to highly heterochromatic regions on chromosomes 4 and 10 in the comparative physical map appear to encompass approximately one-half of each
chromo-some with less density of the alignments (Figure 1). Thus, the cytologically compressed DNA in the hetero-chromatin regions was less conserved between the species. In this study, no alignments were detected between the centromeric regions of these two species.
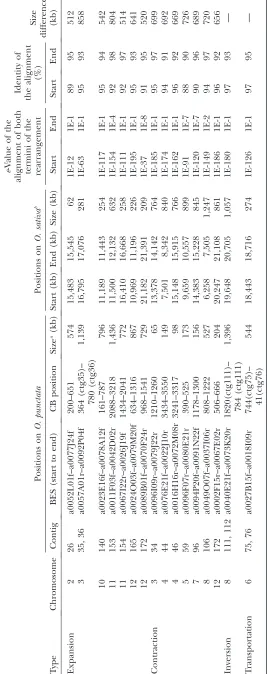
The comparative map not only was able to detect structural conservation between O. punctata and O. sativa, but also was able to find gross size differences (.500 kb) and rearrangements between the species. We identified 16 locations on theO. punctatachromosomes containing expansions, contractions, inversions, or transpositions relative to the O. sativa genome. Five chromosomes displayed an increase in size at seven regions, and six chromosomes displayed a decrease in size at seven other regions, accounting for 4.4 and 4.9 Mb of O. sativa sequence, respectively (Table 2, Figure 2). All putative expansions and contractions in the contigs were examined to determine whether the regions were artificially created by improper manual merging of contigs during FPC editing. Aside from the contraction on contig 34, all expanded or contracted regions were determined to be not involved in manual contig merges and were assembled at the more stringent (.1e-25) cutoff than that of other general contigs (.1e-15).
The regions containing size differences on contigs 36 and 34 (supplemental Figure 1 at http://www.genetics. org/supplemental/) mapped to physical gaps in the
O. sativareference sequence that were cytogenetically measured to be 112 and 500 kb (InternationalRice
GenomeSequencingProject2005), respectively. It is
important to note that the estimated size differences for those regions rely on the accuracy of the physical gap size measurements inO. sativa. Contig 36 was created from three separate contigs (designated A, B, and C; supplemental Figure 1 at http://www.genetics.org/ supplemental/) that were merged by 5 BES matches from contigs A and B (cutoff of 4e-17–4e-41; supplemen-tal Figure 1 at http://www.genetics.org/supplemensupplemen-tal/) and 14 BES matches from contigs B and C (cutoff of 1e -16–2e-42; supplemental Figure 1 at http://www.genetics. org/supplemental/). The expanded region in contig 36 was fully contained within contig A and was in-dependent of any subsequent manual contig merge. In addition, the 9 BES alignments derived from contig A were in agreement with the alignments adjacent to them, which supports the integrity of contig 36. The contraction on contig 34 at the CB position of 1210– 1260 was detected at the junction of a manual contig merge at 1221 CB (Table 2). Nevertheless, the five BAC clones at position 1157–1276 CB of contig 34, which span the contraction, as well as the manually contig-merged junction, were aligned onto the O. sativa
as the alignments of those clones span from 781 to 813 kb of theO. sativareference sequence, which is660 kb larger than the actual size of the clones.
These expansion/contraction regions aligned poorly between the species, with few or no clones contained within the region and dense coverage just outside of the region (Figure 1, red and black arrows; Figure 2). The estimated size of the expansions on the O. punctata
map ranged from 512 kb for chromosome 2 to 858 kb for chromosome 3 (Table 2), while the size of the con-tractions on theO. punctatamap ranged from 656 to 726 kb for chromosomes 12 and 5, respectively. Chromo-somes 3 and 12 ofO. punctatadisplayed both expansion and contraction of 2.7 Mb and 74 kb, respectively, as estimated by their relative positions on the O. sativa
genome sequence. The expansion on chromosome 3 represents the largest difference among the seven expansions, and it is expected to be larger than mea-sured due to the physical gap between contigs 35 and 36. The two expansions on chromosome 11 were detected in the pericentromeric region, contributing 1.3 Mb of excess sequence toO. punctatachromosome 11. Chro-mosome 4 contained two contractions, representing 1.4 Mb in total. All detected expansions and contrac-tions (except those on contig 172) were detected within 1–5 Mb of the CentO repeat positions of O. sativa
(International Rice Genome Sequencing Project
2005).
One inversion was detected on chromosome 8, repre-senting 1.1 Mb of sequence in the O. sativagenome (Figure 3A). This inversion was detected by the alignment of 79 O. punctata BESs and, of those, 53 BESs aligned with ane-value of.1e-100, a sequence identity of.90%, and an alignment length of .400 bp (supplemental Table 2 at http://www.genetics.org/supplemental/). The position of the inversion onO. punctatawas from 1820 CB of contig 111 to 784 CB of contig 112, corresponding to position 19.6–20.7 Mb ofO. sativachromosome 8 (Table 2). This inversion was further supported by confirming the order of the clones adjacent to the breakpoints in the
O. punctataFPC map by FISH analysis (Figure 3B). The clones, OP__Ba0073K20 and OP__Ba0078K10, which contain the breakpoint for each end of the inversion, were detected in the alignments and were represented by both BESs for each clone on the O. sativa sequence (Figure 3A, red highlighted; Table 3).
Approximately 400 kb of an O. punctata region on chromosome 6 was identified to represent an intra-chromosomal transposition with respect to O. sativa
(Figure 4). The position of this event was from 744 CB of contig 75 to 41 CB of contig 76, corresponding to 18.3–18.7 Mb ofO. sativachromosome 6 (Table 2). This
Figure 2.—Alignment
transposition was detected by the alignment of 15 BES onto O. sativa chromosome 6 with a sequence identity of.91% and an alignment length of.300 bp (supplemental Table 3 at http://www.genetics.org/ supplemental/). The translocation was confirmed by verifying the assembly of contig 75 and contig 76 using the overgo hybridization method described by Chen
et al. (2002; data not shown). The clone OP__ Ba0092G08 on contig 75 and OP__Ba0090D18 on con-tig 76 were determined to be breakpoint-containing clones (Table 3), and both ends of each clone aligned onto theO. sativasequences with ane-value of,1e-73, the identity of.93%, and an aligned length of.300 bp.
DISCUSSION
Resources for studying theO.punctata genome:The BES and FPC physical map of theO. punctatagenome
presented in this study are of a higher quality than any other previously reported resource with respect to the BES read length, BES/fingerprinting success ratio, genome coverage, and number of gaps in the FPC physical map. In addition, integration of the BES data into the FPC physical map evenly represents the
O. punctatagenome, covering10.4% (60.5%) of each chromosome.
We applied a modified SNaPshot fingerprinting method (Luo et al. 2003) and adapted it for
high-throughput processing (seematerials and methods).
Due to this modification, we were able to fingerprint an 113 genome equivalent of O. punctata BAC clones, which covered 98% of theO. punctatagenome with one BES tag/5.3 CB for all 12 chromosomes. The number of physical gaps over the entire genome was 164 equating to an average of 14 gaps per each chromosome. The accuracy of the FPC physical map assembly using the
Figure3.—Inversion
be-tween two species on chro-mosome 8. (A)O. punctata contigs 111 and 112 contain an inversion with respect to the O. sativa genome se-quence. The inversion was detected by 79 BES align-ments and two clones con-taining the breakpoints of the inversion were selected (red highlighted). (B) The confirmation of the inver-sion by FISH analysis. (Left) The clones selected for FISH analysis. (Right) FISH pattern of the clones on pachytene chromosome of O. punctata.
TABLE 3
Breakpoint-containing clones for inversion and translocation betweenO. punctataandO. sativagenomes
Alignment
Type Clone Contig
CB
position Chromosome
O. punctata BES
Start on O. sativa(bp)
End on
O. sativa(bp) e-Value % identity
Inversion a0073K20 111 1675–1820 8 a0073K20f 19517686 19518562 1.00E-215 95 a0073K20r 20703719 20704556 1.00E-162 93
a0078K10 112 770–911 8 a0078K10f 19667817 19668627 1.00E-182 96
a0078K10r 20752956 20753518 1.00E-128 95 Transposition a0092G08 75 760–896 6 a0092G08f 18450596 18451456 1.00E-118 93 a0092G08r 13002825 13004742 1.00E-156 94
a0090D18 76 12–176 6 a0090D18f 13174718 13175434 1.00E-182 94
modified fingerprinting method was demonstrated by the high degree of collinearity with theO. sativagenome sequence, as well as by confirmation of a detected transposition and an inversion using overgo hybridiza-tion and FISH analysis (Figure 3B). The well-main-tained collinearity displayed is expected due to the short divergence time betweenO. sativaandO. punctataand proved useful in editing theO. punctata FPC physical map, as well as in demonstrating the quality of the FPC assembly.
The O.punctata genome size: The genome size of
O. punctatahas been reported as 22% larger (1.11 pg/ 2C; Uozu et al. 1997) or 3–5% smaller (0.88 pg/2C;
Ammirajuet al. 2006) than that ofO. sativassp.japonica
cv Nipponbare (0.91 pg/2C; Uozuet al. 1997) on the
basis of flow cytometric analysis. To estimate the physical size of FPC contigs, we determined the average band (CB unit) size derived from theO. punctataFPC physical map by estimating the size of 539O. punctataBAC clones and applying the following formula: one CB unit¼real size of the clone/CB unit of the clone. Consequently, the size of each chromosome, as well as the genome as a whole, was based on the constant of [1 CB unit¼1.27 kb] and the length of the FPC physical map in CB, an estimate that is independent of the previous reports by flow cytometry. The total FPC CB length of 329,435 (Table 1) converts to 418 Mb—our estimate of the size of the O. punctata genome covered by the FPC map. In addition, since 87% of the FPC physical map covered most of the O. sativa reference sequence (98%) or a larger portion of theO. sativagenome (93%) with esti-mated gaps (InternationalRiceGenomeSequencing
Project2005), we estimate that theO. punctatagenome
is slightly larger than theO. sativagenome by8% (30
Mb). The map also demonstrates that the size difference betweenO. punctataandO. sativais not evenly distrib-uted over the chromosomes, possibly reflecting dynam-ics that have affected each chromosome differently over evolutionary time (Table 1). One possible explanation for the genome size difference is the report that O. punctata centromeres have 2.5 times more CentO satellite DNA and a wider distribution of centromeric retrotransposon of rice sequence thanO. sativa(Zhang
et al. 2005). It warrants noting that our size estimate of theO. punctatagenome may be an underestimate due to the presence of physical gaps between the contigs and the fact that the nuclear organizer region (Shishido
et al. 2000) on the tip of chromosome 9S was not in-cluded in the FPC map. Therefore, although the chro-mosome 9 ofO. punctatahas a smaller observed size than
O. sativa, the chromosome is actually larger than the correspondingO. sativachromosome if the 6.95 Mb of rDNA on theO. sativachromosome is excluded.
Comparison between the O. punctata and O.sativa
genomes using the comparative FPC physical map:O. punctataandO. sativadiverged2 MYA (Geet al. 2005)
and, consequently, the collinearity between these two species is expected to be very high. As a result, we were able to generate a comparative physical map of the two species using the BES-tagged FPC physical map of O. punctata and the O. sativa reference sequence by se-quence similarity. We found that overall collinearity between the species was well maintained and was mostly disrupted in centromeric and heterochromatic regions (Figure 1). This could be explained in part by more ra-pid divergence in the intergenic and repetitive regions as compared to more gene-rich regions (Bennetzen
and Ma2003).
The full genome-level macro-structural differences between O. punctataandO sativahave been illustrated in this study (Figure 2). Only0.5 Mb of size difference between total expansions and contractions was observed at the macro level (.500 kb) in this study (Table 2), demonstrating that most of the contractions/expansions between the two species occur on a scale,500 kb. That the regions that did differ in size between the species had no or very few alignments indicates that these areas may represent regions of the chromosomes that are unique to that species. An alternate explanation would be that no alignments were detected due to stringent filtering of repeats by SyMAP (Soderlundet al. 2006). However,
on the basis of the theory of 0.14 6 0.06 structural mutations/chromosome/million years of divergence put forth by Paterson et al. (1996), we expect two to five
structural mutations to have occurred between the O. punctataandO. sativagenomes over 2 million years of divergence. At least three times the expected number of structural mutations was detected between O. punctata
andO. sativa, possibly due to the size threshold used for detecting the rearrangement. The timing of those events should be further investigated for clarifying whether the
Figure4.—Detailed view of an intrachromosomal
changes occurred concurrently with or subsequent to the divergence of the AA and BB genome groups. The map also suggests that there are many microlevel rearrange-ments between these two species that can account for the differentiation ofO. punctataandO. sativastructurally as well functionally.
The degree of conservation for each chromosome, in terms of the alignment ratio of BES, varied from 31% (chromosome 12) to 53% (chromosome 3) uncorre-lated with the variation in size. On the basis of the comparative analysis in this study, we estimated that chromosomes 6 and 12 are the most divergent between the species and that chromosome 3 is the most similar. It is interesting to note that chromosome 6 is known to possess one of the brown planthopper resistance genes (bph4; Kawaguchi et al. 2001), as well as one of the
domestication genes ofO. sativa, hd1 (Yanoet al. 2000).
Chromosome 12 is known to contain several of the brown planthopper resistance genes, such as bph1
(Hirabayashiand Ogawa1995),bph2(Murataet al.
1998), bph9 (Murata et al. 2001) bph10 (Ishii et al.
1994), andbph18(t)(Jenaet al. 2005). The presence of
resistance genes on these chromosomes may partially explain the higher levels of divergence relative to the rest of the genome as the resistant gene families tend to rapidly evolve through diversification (Ronald1998).
The comparative map introduced here serves as a reference to develop the materials necessary to exploit the untapped genetic resource ofO. punctataas a close relative to cultivated rice. The map provides the basis for positional cloning or introducing useful traits into cul-tivated rice by means of interspecific hybrids between cultivated rice andO. punctata, monosomic alien addition lines, introgression lines, and mapping populations. In addition, the well-aligned regions can be used to develop markers useful in integrating the physical and genetic maps of other important cereals. Finally, this comparative map not only elucidates several regions that differentiate the two genomes and warrant further investigation in an evolutionary context, but also will serve as a basis for future evolutionary studies on a finer scale. The compar-ative map will be updated as the study progresses and more anchoring information becomes available. Refine-ments of the physical map can be accessed at http:// www.genome.arizona.edu/symap_punctata.
We thank Arizona Genomics Institute’s BAC/EST Resource Center
for providing a copy of theO. punctataBAC library, Paul Parker for
help with BES generation, Rick Westerman for help with the trace file submission, Austin Shoemaker for help with Java graphics of SyMAP, Michele Braidotti for help with the SyMAP website, Andrea Zuccolo for providing repeat database and helpful discussion, and Jiming Jiang for supportive discussion. This work was supported by National Science Foundation grant 0321678 to R.A.W, S.A.J., and C.S.
LITERATURE CITED
Ahn, S., and S. D. Tanksley, 1993 Comparative linkage maps of rice
and maize genomes. Proc. Natl. Acad. Sci. USA90:7980–7984.
Ammiraju, J. S., M. Luo, J. L. Goicoechea, W. Wang, D. Kudrna
et al., 2006 TheOryzabacterial artificial chromosome library re-source: construction and analysis of 12 deep-coverage large-insert BAC libraries that represent the 10 genome types of the genus
Oryza.Genome Res.16:140–147.
ArabidopsisGenomeInitiative, 2000 Analysis of the genome
se-quence of the flowering plantArabidopsis thaliana.Nature408:
796–815.
Bennetzen, J. L., and J. Ma, 2003 The genetic colinearity of rice and
other cereals on the basis of genomic sequence analysis. Curr.
Opin. Plant Biol.6:128–133.
Bonierbale, M. W., R. L. Plaistedand S. D. Tanksley, 1988 RFLP
maps based on a common set of clones reveal modes of
chromo-somal evolution in potato and tomato. Genetics120:1095–1103.
Bowers, J. E., M. A. Arias, R. Asher, J. A. Avise, R. T. Ballet al.,
2005 Comparative physical mapping links conservation of
mi-crosynteny to chromosome structure and recombination in
grasses. Proc. Natl. Acad. Sci. USA102:13206–13211.
Chaparro, C., R. Guyot, A. Zuccolo, B. Pieguand O. Panaud,
2007 RetrOryza: a database of the rice LTR-retrotransposons.
Nucleic Acids Res.35:D66–D70.
Chen, M. S., P. SanMigueland J. L. Bennetzen, 1998 Sequence
or-ganization and conservation in sh2/a1-homologous regions of
sorghum and rice. Genetics148:435–443.
Chen, M., G. Presting, W. B. Barbazuk, J. L. Goicoechea, B. Blackmon
et al., 2002 An integrated physical and genetic map of the rice
genome. Plant Cell14:537–545.
Cheng, Z., C. R. Buell, R. A. Wing, M. Guand J. Jiang, 2001
To-ward a cytological characterization of the rice genome. Genome
Res.11:2133–2141.
Chou, H. H., and M. H. Holmes, 2001 DNA sequence quality
trim-ming and vector removal. Bioinformatics17:1093–1094.
Devos, K. M., 2005 Updating the ‘Crop Circle’. Curr. Opin. Plant
Biol.8:155–162.
Engler, F. W., J. Hatfield, W. Nelson and C. A. Soderlund,
2003 Locating sequence on FPC maps and selecting a minimal
tiling path. Genome Res.13:2152–2163.
Ewing, B., and P. Green, 1998 Base-calling of automated sequencer
traces using phred. II. Error probabilities. Genome Res.8:186–
194.
Ewing, B., L. Hillier, M. C. Wendleand P. Green, 1998
Base-calling of automated sequencer traces using phred. I. Accuracy
assessment. Genome Res.8:175–185.
Gale, M., and K. M. Devos, 1998a Plant comparative genetics after
10 years. Science282:656–659.
Gale, M. D., and K. M. Devos, 1998b Comparative genetics in the
grasses. Proc. Natl. Acad. Sci. USA95:1971–1974.
Ge, S., Y.-L. Guoand Q.-H. Zhu, 2005 Molecular phylogeny and
di-vergence of the rice tribe (Oryzeae), with special reference to the
origin of the genusOryza, pp. 40–44 inRice Is Life: Scientific
Per-spectives for the 21st Century, edited by K. Toriyama, K. L. Heong
and B. Hardy. IRRI, Philippines.
Goff, S. A., D. Ricke, T. H. Lan, G. Presting, R. Wanget al., 2002 A
draft sequence of the rice genome (Oryza sativaL. ssp.japonica).
Science296:92–100.
Han, B., and Y. Xue, 2003 Genome-wide intraspecific
DNA-sequence variations in rice. Curr. Opin. Plant Biol.6:134–138.
Hansson, B., A. Kawabe, S. Preuss, H. Kuittinenand D. C harles-worth, 2006 Comparative gene mapping inArabidopsis lyrata
chromosomes 1 and 2 and the correspondingA. thaliana
chro-mosome 1: recombination rates, rearrangements and
centro-mere location. Genet. Res.87:75–85.
Hirabayashi, H., and T. Ogawa, 1995 RFLP mapping of Bph-1
(brown planthopper resistance gene) in rice. Breed. Sci. 45:
369–371.
Hulbert, S. H., T. E. Richter, J. D. Axtelland J. L. Bennetzen,
1990 Genetic mapping and characterization of sorghum and
related crops by means of maize DNA probes. Proc. Natl. Acad.
Sci. USA87:4251–4255.
International Human Genome Mapping Consortium, 2001 A
physical map of the human genome. Nature409:934–941.
InternationalRiceGenomeSequencingProject, 2005 The
map-based sequence of the rice genome. Nature436:793–800.
Ishii, T., D. S. Brar, D. S. Multaniand G. S. Khush, 1994
earliness introgressed fromOryza australiensisinto cultivated rice,
O. sativa.Genome37:217–221.
Jena, K. K., G. S. Khushand G. Kochert, 1994 Comparative RFLP
mapping of a wild rice, Oryza officinalis, and cultivated rice,
O. sativa.Genome37:382–389.
Jena, K. K., J. U. Jeung, J. H. Lee, H. C. Choi and D. S. Brar,
2005 High-resolution mapping of a new brown planthopper
(BPH) resistance gene, Bph18(t), and marker-assisted selection
for BPH resistance in rice (Oryza sativaL.). Theor. Appl. Genet.
112:288–297.
Kawaguchi, M., K. Murata, T. Ishii, S. Takumi, N. Moriet al.,
2001 Assignment of a brown planthopper (Nilaparvata lugens
Stal) resistance gene bph4 to rice chromosome 6. Breed. Sci.
51:13–18.
Keller, B., and C. Feuillet, 2000 Colinearity and gene density in
grass genomes. Trends Plant Sci.5:246–251.
Kent, W. J., 2002 BLAT—the BLAST-like alignment tool. Genome
Res.12:656–664.
Luo, M. C., C. Thomas, F. M. You, J. Hsiao, S. Ouyang et al.,
2003 High-throughput fingerprinting of bacterial artificial
chromosomes using the snapshot labeling kit and sizing of
re-striction fragments by capillary electrophoresis. Genomics 82:
378–389.
Ma, J., and J. L. Bennetzen, 2004 Rapid recent growth and
diver-gence of rice nuclear genomes. Proc. Natl. Acad. Sci. USA101:
12404–12410.
Marra, M. A., T. A. Kucaba, N. L. Dietrich, E. D. Green, B. Brownstein
et al., 1997 High throughput fingerprint analysis of large-insert
clones. Genome Res.7:1072–1084.
Moore, G., K. M. Devos, Z. Wangand M. D. Gale, 1995 Cereal
ge-nome evolution: grasses, line up and form a circle. Curr. Biol.5:
737–739.
Mozo, T., K. Dewar, P. Dunn, J. R. Ecker, S. Fischeret al., 1999 A
complete BAC-based physical map of theArabidopsis thaliana
ge-nome. Nat. Genet.22:271–275.
Murata, K., M. Fujiwara, C. Kaneda, S. Takumi, N. Mori et al.,
1998 RFLP mapping of a brown planthopper (Nilaparvata
lu-gensSta˚l) resistance gene bph2 ofindicarice introgressed into
a japonica breeding line ‘Norin-PL4.’ Genes Genet. Syst. 73:
359–364.
Murata, K., M. Fujiwara, H. Murai, S. Takumi, N. Moriet al.,
2001 Mapping of a brown planthopper (Nilaparvata lugensSta˚l)
resistance gene Bph9 on the long arm of rice chromosome 12.
Cereal Res. Commun.29:245–250.
Nelson, W. M., A. K. Bharti, E. Butler, F. Wei, G. Fuks et al.,
2005 Whole-genome validation of high-information-content
fingerprinting. Plant Physiol.139:27–38.
Olson, M. V., J. E. Dutchik, M. Y. Graham, G. M. Brodeur, C.
Helmset al., 1986 Random-clone strategy for genomic
restric-tion mapping in yeast. Proc. Natl. Acad. Sci. USA 83:7826–
7830.
Paterson, A. H., T. H. Lan, K. P. Reischmann, C. Chang, Y. R. Lin
et al., 1996 Toward a unified genetic map of higher plants,
transcending the monocot-dicot divergence. Nat. Genet. 14:
380–382.
RiceChromosome3 Sequencing Consortium, 2005 Sequence,
annotation, and analysis of synteny between rice chromosome
3 and diverged grass species. Genome Res.15:1284–1291.
Ronald, P. C., 1998 Resistance gene evolution. Curr. Opin. Plant
Biol.4:294–298.
Salse, J., B. Piegu, R. Cookeand M. Delseny, 2004 Newin silico
in-sight into the synteny between rice (Oryza sativaL.) and maize
(Zea maysL.) highlights reshuffling and identifies new
duplica-tions in the rice genome. Plant J.38:396–409.
Shishido, R., Y. Sanoand K. Fukui, 2000 Ribosomal DNAs: an
ex-ception to the conservation of gene order in rice genomes. Mol.
Gen. Genet.263:586–591.
Soderlund, C., S. Humphray, A. Dunham and L. French,
2000 Contigs built with fingerprints, markers, and FPC V4.7.
Genome Res.10:1772–1782.
Soderlund, C., W. Nelson, A. Shoemaker and A. Paterson,
2006 SyMAP: a system for discovering and viewing syntenic
re-gions of FPC maps. Genome Res.16:1159–1168.
Sorrells, M. E., M. LaRota, C. E. Bermudez-Kandianis, R. A.
Greene, R. Kantetyet al., 2003 Comparative DNA sequence
analysis of wheat and rice genomes. Genome Res.13:1818–1827.
Suwabe, K., H. Tsukazaki, H. Iketani, K. Hatakeyama, M. Kondo
et al., 2006 Simple sequence repeat-based comparative
ge-nomics betweenBrassica rapaandArabidopsis thaliana: the genetic
origin of clubroot resistance. Genetics173:309–319.
Tanksley, S. D., R. Bernatzky, N. L. Lapitan and J. P. Prince,
1988 Conservation of gene repertoire but not gene order
in pepper and tomato. Proc. Natl. Acad. Sci. USA85: 6419–
6423.
Timms, L., R. Jimenez, M. Chase, D. Lavelle, L. McHaleet al.,
2006 Analyses of synteny betweenArabidopsis thalianaand
spe-cies in the Asteraceae reveal a complex network of small syntenic segments and major chromosomal rearrangements. Genetics
173:2227–2235.
Town, C. D., F. Cheung, R. Maiti, J. Crabtree, B. J. Haaset al.,
2006 Comparative genomics ofBrassica oleraceaandArabidopsis
thalianareveal gene loss, fragmentation, and dispersal after
poly-ploidy. Plant Cell18:1348–1359.
Uozu, S., H. Ikehashi, N. Ohmido, H. Ohtsubo, E. Ohtsuboet al.,
1997 Repetitive sequences: cause for variation in genome size
and chromosome morphology in the genusOryza. Plant Mol.
Biol.35:791–799.
Walling, J. G., J. C. Piresand S. A. Jackson, 2005 Preparation
of samples for comparative studies of plant chromosomes
using in situ hybridization methods, pp. 442–459 inMolecular
Evolution: Producing the Biochemical Data, Part B. Elsevier, Amsterdam.
Yano, M., Y. Katayose, M. Ashikari, U. Yamanouchi, L. Monnaet al.,
2000 Hd1, a major photoperiod sensitivity quantitative trait
lo-cus in rice, is closely related to the Arabidopsis flowering time
gene CONSTANS. Plant Cell12:2473–2484.
Yogeeswaran, K., A. Frary, T. L. York, A. Amenta, A. H. Lesseret al.,
2005 Comparative genome analyses of Arabidopsis spp.:
infer-ring chromosomal rearrangement events in the evolutionary
his-tory ofA. thaliana.Genome Res.15:505–515.
Zhang, W., C. Yi, W. Bao, B. Liu, J. Cuiet al., 2005 The transcribed
165-bp CentO satellite is the major functional centromeric
ele-ment in the wild rice speciesOryza punctata.Plant Physiol.139:
306–315.