PRECIPITATION REGIME CHANGES ASSOCIATED WITH CLIMATIC CHANGES
Peter J. Robinson and Stephen J. Walsh
Department of Geography University of North Carolina Chapel Hill, North carolina 27599
The research on which this report is based was financed in part by the United States
Department of the lnterior, Geological Survey, through the N.C. Water Resources
Research Institute.
Contents of the publication do not necessarily reflect the views and policies of the United States Department of the lnterior, nor does mention of trade names or commercial products constitute their endorsement by the United States Government.
WRRl Project No. 20153
ABSTRACT
The relationship between precipitation events and atmospheric circulation in the
southeastern United States is investigated to provide information potentially useful in
TABLE OF CONTENTS
Page
Abstract
List of Figures
List of Tables
Summary and Conclusions
Recommendations
Precipitation Regimes and Climatic Change
1 .A. Precipitation Events and Atmospheric Circulation
1. B. Data Analysis and Methods
1 .C. The Definition of a Precipitation Event
Precipitation Events in the Southeast 2.A. Frequency of Events
2.8. Distribution of Event Durations and Amounts 2.C. Comparison with Common Precipitation Measures 2.D. The Influence of Topography
The Influence of Circulation Patterns
3.A. Circulation and Mean Event Amounts and Durations 3.8. Circulation and Changes in Event Character
Spatial Analysis of Precipitation Events
4.A. Spatial Interpolation for Precipitation Events
4.8. Graphical Representation of Interpolated Surfaces
4.C. Topography, Interpolation and Events
iii
xvi i
LIST
OF
FIGURES
Page
Highly generalized schematic of the flow patterns over the southeast
United States with extreme PNA and NAO index values.
7
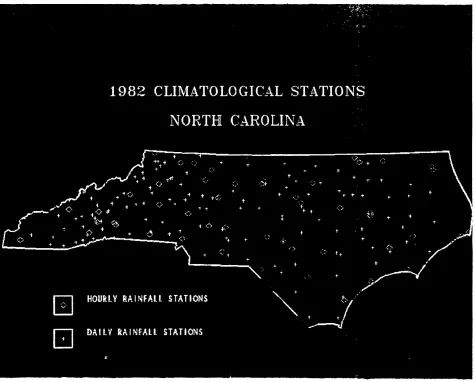
North Carolina daily and hourly precipitation stations active during
1982, as indicated by the GIs (photo from computer color screen). 12
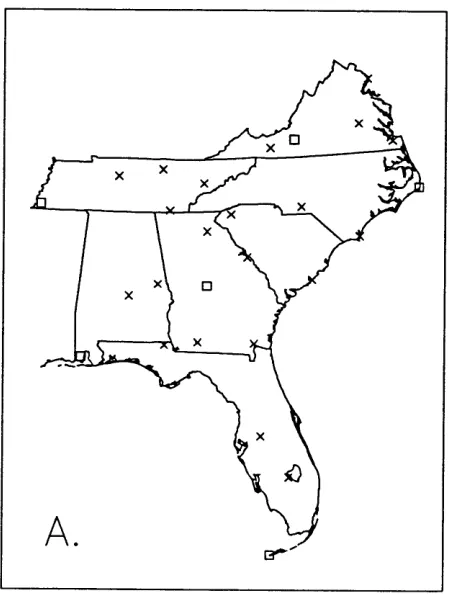
Stations in (A) the
2
'
x 2' Southeast network and (B) the NorthCarolina network.
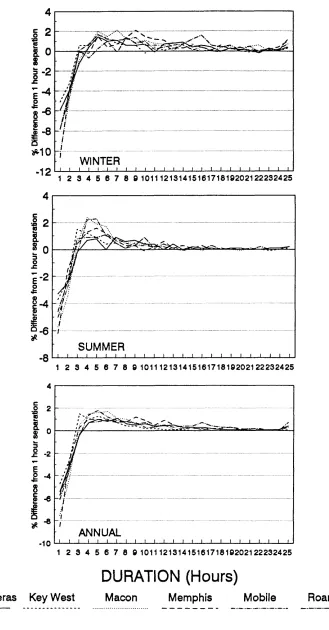
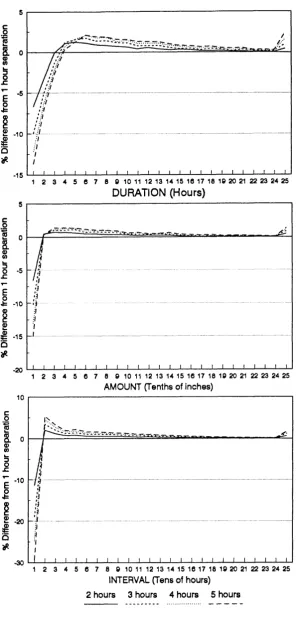
Winter, summer and annual differences in the number of events as a function of event duration as the separation interval between
events increases. 21
Annual differences in the number of events with selected amounts, durations and lengths between events as the separation interval
between events increases. 23
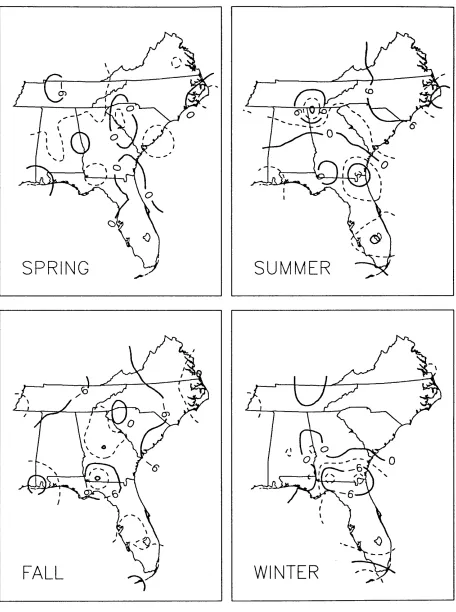
The spatial distribution of the long-term average number of events per
season, using all data for the 1958-1 987 period. 29
The spatial distribution of the long-term average number of events
per season in North Carolina, using all data for the 1958-1987 period. 31
Cumulative frequency of the percentage of events exceeding indicated durations at Key West and Roanoke. Abscissa values must be multiplied by the specified amount for each line to give the actual duration.
Cumulative frequency of the percentage of events exceeding indicated amounts at Key West and Roanoke. Abscissa values must be multiplied by the specified amount for each line to give the actual amount.
Frequency of events equalling or exceeding specified durations for
selected stations in the Southeast for each season. i
Frequency of events equalling or exceeding specified amounts for selected stations in the Southeast for each season.
13. The percentage of events with durations equal to or exceeding 15 hours
for each season for the Southeast, using all data for the 1958-1987. 41
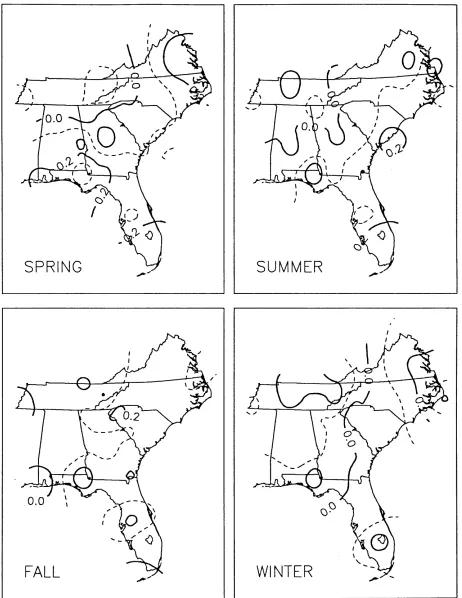
The percentage of events with amounts equal to or exceeding 0.5" for
each season for the Southeast, using all data for the 1958-1 987. 42
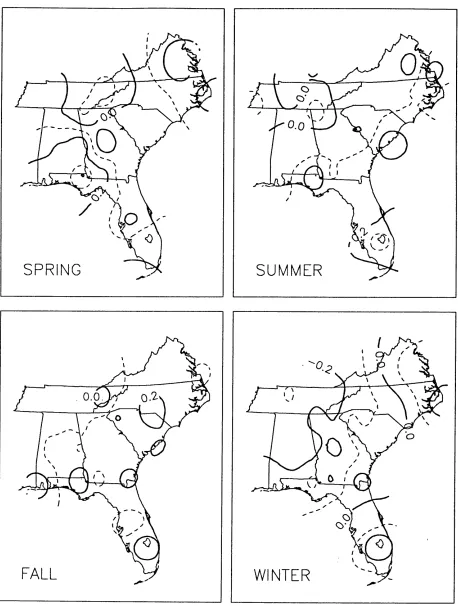
The percentage of events with amounts equal to or exceeding 1.5" for
each season for the Southeast, using all data for 1958-1 987. 43
The number of events per season in the Southeast giving more than
0.5" of precipitation in 1 hour or less. 47
The number of events per season in the Southeast giving more than
1 .OH of precipitation in 24 hours or less. 49
The number of events per season in North Carolina giving more than
0.5" of precipitation in 1 hour or less. 50
The number of events per season in North Carolina giving more than
1.0" of precipitation in 24 hours or less. 51
The number of events for average and high and low PNA and NAO seasons, for each station in the southeastern network.
Difference between number of events in seasons with high PNA and those with low values.
Difference between number of events in seasons with high NAO and those with low values.
Correlation coefficient of the relationship between PNA and the average amount of precipitation per event.
Correlation coefficients of the relationship between PNA and standard deviation of event amounts per month.
Correlation coefficient for relationship between PNA and the average event duration.
26. Correlation coefficient for relationship between PNA and standard
deviation of event durations per month.
27. Percentage difference in number of events in North Carolina with
amounts 0.0
-
0.5" and 1.0-
1.5" between high and low PNA28. Percentage difference in number of events in the southeast with
amounts 0.0
-
0.5" between high and low PNA conditions ineach season.
29. Percentage difference in number of events in the southeast with
amounts 1.0
-
1.5" between high and low PNA conditions ineach season.
30. Percentage difference in number of events in North Carolina with durations 4-6 hrs and 13-15 hrs between high and low PNA conditions in summer and winter.
31. Percentage difference in number of events in the Southeast with
durations 1
-
3 hrs between high and low PNA conditionsin each season.
32. Percentage difference in number of events in the Southeast with
durations 4
-
6 hrs between high and low PNA conditionsin each season.
33. Percentage difference in number of events in the Southeast with
durations 13
-
15 hrs between high and low PNA conditionsin each season.
34. Percentage difference in number of events in the Southeast with amounts >0.5" and 1 hr duration between high and low PNA conditions in each season.
35. Percentage difference in number of events in the Southeast with
amounts
>
1.0" and durationsc24 hrs between high and lowPNA conditions in each season.
36. Flow chart of steps in the production of interpolated surfaces.
37. North Carolina stream network (photo from computer color screen).
38. North Carolina stream gauging stations and major hydrologic basins (photo from computer color screen).
39. Daily pattern of precipitation in North Carolina, March 6, 1982 (photo from computer color screen).
40. Daily pattern of precipitation in North Carolina, July 17, 1982 (photo from computer color screen).
41. Composite of the first three principal components of the March 6,
42. Steps in the calculation of slope and aspect.
43. The alternative method for determination of topographic attributes
for precipitation station locations.
44. Summary of twin methodologies employed for rainfall stations
LIST OF TABLES
Stations in the 2" x 2" Southeastern network.
Observing stations used for the detailed analyses in North Carolina.
Number of events per year, and the percentage of events in each season, for separation periods from 1 to 5 hours, for selected southeastern stations.
Page
13
16
Frequency distribution of annual, winter and summer event durations
for 1 hour separation and difference between frequencies between
1 hour and 2 to 5 hour separations for southeastern stations. 20
Frequency distribution of annual, winter and summer event amounts for 1 hour separation and difference between frequencies between
1 hour and 2 to 5 hour separations for southeastern stations.
Frequency distribution of annual, winter and summer event intervals for 1 hour separation and difference between frequencies between 1 hour and 2 to 5 hour separations for southeastern stations.
Number of precipitation events per year and for each season, for selected southeastern stations.
Significance of the Kolgomorov-Smirnov test for the difference between the frequency distributions for event amount and event duration, for winter conditions.
Percentage of events in selected small attribute classes for each season for selected southeastern stations.
Percentage of events in selected attribute classes for each season for selected southeastern stations.
Seasonal average (a) number of events; (b) number of rain days; and (c) total precipitation amount (inches), for selected southeastern stations.
Regression relationships between precipitation events, raindays and rainfall amounts for the Southeast.
Relations between number of events per year and annual total precipitation for the stations of the North Carolina mountain network (Stations presented in elevation order from low to high).
Relationship between elevation and various event attributes for the North Carolina mountain network.
Years used in assessment of the influence of circulation on precipitation events.
Correlations of PNA vs event duration, amount and standard deviations.
Event amount categories having a difference between the number of events for high and low PNA conditions significant at the 95% level.
Event duration categories having a difference between the number of
events for high and low PNA conditions significant at the 95% level.
Programs used in the development of interpolated surfaces.
First order trend surface results for North Carolina stations.
Values of independent and dependent variables used in multiple regression relations between precipitation, elevation,
and location.
SUMMARY AND CONCLUSIONS
There is a need to develop precipitation information in a form which allows the identification of possible changes in water supply as a result of climatic changes. Any approach to such development must balance the need for details on short time and space scales against the availability of only generalized suggestions of future climates from the global climate models (GCMs) which are the prime tool of climate change
analysis. The underlying hypothesis of this project was that this balance could be
achieved by using observational records of precipitation and atmospheric pressure to consider the relationship between local precipitation events and large scale circulation patterns. Climate models are becoming capable of simulating circulation on this scale and of providing estimates of changes in frequency of the various circulation types as the climate changes. Hence, once a relationship between circulation and precipitation is established, precipitation changes can be estimated. Some previous work along similar lines has been encouraging but inconclusive. However, that work relied on observations of monthly total precipitation. There are reasons to suggest, from considerations of synoptic climatology, that relationships between circulation and precipitation event characteristics, rather than precipitation totals, would be better founded. This project explores this approach, using not only the traditional tools of climatological analysis but also the techniques of spatial analysis provided by Geographic Information Systems (GIs). The information is developed for the southeast United States, approximately the states of Alabama, Florida, Georgia, North Carolina, South Carolina, Tennessee, and Virginia.
The synoptic climatology of the Southeast suggests that there are two types of precipitation events: convective events best represented by short, sharp, and localized thundershowers; and cyclonic events which give widespread, prolonged and generally gentle rain from travelling depressions. In practice these two types represent the ends
of a continuum, although the dominance of one or the other is commonly associated
with a particular hemispheric circulation pattern. Hence if quantitative relationships between circulation and events can be established from the historical data, they have the potential to indicate future conditions. For the circulation patterns there are several well established summarizing statistics. The most pertinent here for the Southeast are the Pacific-North America (PNA) index and the North Atlantic Oscillation (NAO) index. Unfortunately, there is no comparable well established definition of a precipitation event, so that the establishment of such a definition was the first objective of the project.
In general a precipitation event is a single atmospheric rain-producing feature which moves with variable speed and distance across a region changing shape, size and intensity as it moves. It is isolated in space or time from other similar features. Thus it can be thought of as a single "storm". Various attempts to develop a rigorous definition of an event as both a temporal and spatial feature were unsuccessful, largely because of the lack of a sufficiently dense, in both time and space, observational network. Eventually a working definition was developed based on an analysis of hourly
precipitation data records for individual stations. The definition adopted was that
an
recorded, separated from other events by a dry period of at least two consecutive hours. An event may include an embedded period of one hour during which no precipitation occurred.
Since there have been no previous explorations of precipitation events, a necessary first step was the development of a precipitation event climatology irrespective of the circulation pattern. Such a climatology was developed using a 27-station network covering the whole Southeast. A 36-station network for North Carolina alone was used to ascertain the spatial stability of the southeastern results. There are between 90 and 160 events per year for the southeastern stations, with 130 representing a general region-wide value. The individual stations have between 20 and 40 events per season. As an average for the whole region there is a slight maximum in summer, with just under 40 events, and a minimum in fall, with just under 30. However, there are distinct variations spatially and temporally within the southeast United States. South Florida has a summer-fall event maximum, while from the Gulf Coast northwards summer has the maximum, with the importance of spring increasing in the far north.
The frequencies of events longer than specific durations and with more precipitation than specific amounts were also ascertained as part of this general precipitation event climatology. For storms with durations of more than 5 hrs, in all seasons the maximum frequency occurs in the north. In winter in the north up to 40%
of all events have durations in excess of 5 hrs, while in the south commonly less than
20% are this long. The corresponding summer values are 12% and 8%, with the
intermediate seasons having intermediate values. Considering long duration storms
only, those lasting 15 hrs or more, there is a similar seasonal and spatial pattern,
although the actual percentages are much lower. A common feature at both durations and all seasons is the higher percentages over the southern Appalachians. There is a well known tendency for travelling depressions to "stall" over the mountains, and the
present duration patterns clearly indicate the climatological result.
The climatology of event amounts is less clear. In general, throughout the year the areas with the smallest percentage of events with amounts exceeding 0.5" are the extreme southern tip of Florida and western Virginia. The maximum frequency occurs near the Gulf Coast or, in summer, in northern Florida. In winter and spring the southern Appalachians appear to increase the percentage, but in summer they decrease it. In all seasons between 20% and 30% of events give amounts greater than 0.5". The highest percentage occurs in the spring. This is also the case for those events with amounts exceeding 1.5". These heavier events account for around 5% of all events. They, like the lighter events, show an area of maximum frequency over the Gulf Coast, while minima occur over the Appalachians, this time in all seasons.
These duration and amount frequency results can generally be explained in terms of the synoptic climatology of the area. The duration values are generally better established statistically than are the results for the amount analysis. This is a function
of the greater number of factors which can influence the amount collected by
an
When both duration and amount are treated together, most events are of short duration and small amounts. Treating a small event as one giving less than 0.5" of rain
and lasting less than 5 hrs, such storms at all stations except Key West account for 65-
75% of all events in spring and fall, slightly more in summer, and slightly fewer in winter.
Key West has about 10% more short, light events in each season. At the other extreme, the long, heavy events, with durations in excess of 20 hrs and amounts over 2.0", represent about 1% of the events in fall and winter, less than 0.5% in spring, and near zero in summer. Key West has low values in all seasons. For most seasons and stations the most common type of event is the smallest: 1 hr in duration and giving less than 0.1" of rain. These generally account for between a quarter and a third of all events. For Key West this approaches 40%. The second most common class, usually accounting for 10% of all events, are those with 2 hr durations and less than 0.1" of rain. Again, Key West is an exception and has higher values. These values characterize the precipitation event climatology of the region, and the differences at Key West emphasize the fundamental difference between the sub-tropical conditions of south Florida and the more temperate conditions of the rest of the southeastern United States.
The influence of circulation was first introduced by establishing the significance of the relationship between seasonal PNA and NAO values for each year and the mean and standard deviation of the number, duration and precipitation amount of the events at the corresponding time. In many cases large parts of the area had correlations
significant at the 95% confidence level, and occasionally at the 99% level. In
comparison with many analyses using precipitation totals, these levels indicate a very
good relationship. They strongly support the existence of a connection between
continental scale circulation measures and precipitation from individual events, a connections which can be exploited for climate change analysis purposes.
The PNA appears to be a more useful measure than the NAO, giving both higher correlations and more stable spatial and temporal patterns. PNA provides a measure of the direction of the airflow across the Southeast. A high PNA indicates mainly meridional flow, when the airstream coming from the Great Plains region dips towards
the Gulf Coast and crosses the Southeast from the southwesterly direction. A low
(highly negative) PNA occurs when there is zonal flow, with the wind blowing more or less directly across the region from due west. The PNA results suggest that as the airflow becomes more meridional there is in the eastern part of the region an increase in the average amount of event precipitation and in the average duration of events. There is also an increase in the variability of both precipitation amounts from individual events and the length of these events. The changes are in the opposite direction in the western part of the area. Average duration and amount decreases, and the inter-event variability also decreases, as the frequency and strength of the meridional airflow increases. More detailed analysis is warranted, particularly an assessment of the role played by the southern Appalachians in creating this distinction.
The second portion of the investigation of the relationship between events and
circulation was a comparative analysis of the event climatology for years with extreme
has about 5 more events when there is a high PNA than when it is low. Differences generally increase westward and are commonly small in Florida. In summer there is a core region centered on north Georgia, with several stations reporting a difference of around 10 events. The differences are again explicable in terms of atmospheric processes. For example, meridional flow (high PNA) allows both depression passage and local air-mass thunderstorms, giving elevated event levels. These local air-mass storms should be most numerous in summer, when surface heating and local instability are at a maximum. Fall and winter show a reverse spatial pattern, suggesting that the smaller convective influence in the cool season is reflected in the smaller number of events. Indeed, much of the region in winter has more events when PNA is negative than when it is positive, indicating that depression passage through much of the region north of peninsular Florida is more common with zonal than meridional flows. When differences resulting from the comparison of low and high NAO values are examined, they are, as expected, much less marked but also suggest that explanations in terms of synoptic events are possible.
An analysis of the variation in the number of events with various amount and duration characteristics as a function of PNA does not always support the general conclusions given above. For example, in winter in meridional years there is a tendency
for an increase in the numbers of short duration and small amount storms, and a
decrease in events having great length and giving much precipitation. This is to a great extend the opposite to what might be expected. It also suggests that a considerable amount of investigation is still required if statistically significant and physically realistic relationships are to be developed.
Nevertheless, the findings of this analysis of the relationship between circulation
and events can be summarized by suggesting that it appears that there is a relationship
between continental-scale circulation and rainfall event attributes in many areas of the southeastern United States. This relationship varies for different attributes and in the
different seasons. For rainfall amount, years with meridional flow appear to bring
smaller but more consistent events west of the Appalachian Mountains, and larger, more variable events in the east, especially over the coastal plains regions. The opposite effect holds for years with zonal circulation flow. Considerable further work is needed, however, if usable relationships are to be developed.
Further effort appears to be worthwhile, however, since the present results are encouraging. Using well established relationships of the type initiated here, it should be possible to create a rainfall event scenario from modelled continental-scale flow. The proportion of future months projected to experience zonal or meridional flow could be
used with the historical relationships produced from this'' work and the future
distributions of events estimated. The applicability of this method for other areas having
other types of synoptic controls should also be tested. Nevertheless, for the
southeastern United States at least, this method provides one way of overcoming problems associated with the low resolution of the current generation of GCMs and the detailed information needs for impact assessment.
An integral part of the analysis of precipitation events was their spatial analysis
using a Geographic Information System. Initially it was intended to use the GIs to
discriminate between cyclonic and convective events. The relatively coarse
observational network, however, precluded unambiguous identification of any but the most extreme of either type of event. In addition, the results using traditional methods,
as outlined above, suggest it is inappropriate to expend a great deal of effort on such
identification. Rather, the strength of the GIs system is in detailed analysis of previously identified events, not in the rapid survey of numerous events to identify candidates for
detailed analysis. Event selection, therefore, should be undertaken using other
techniques. A simple examination of daily weather maps was used here to identify periods for case studies.
Selected precipitation events were used to explore and demonstrate how automated cartographic and statistical techniques could be applied to synthesize and display spatially and temporally autocorrelated data representing cyclonic and
convection precipitation events. A principal component analysis (PCA) was used on a
series of days with cyclonic precipitation, leading to the removal of redundant information and focusing attention on those data critical in understanding the location, severity, and progression of the events over time and through space. The image
processing system effectively displayed the results of the PCA by presenting individual
components and composites of components. Once in digital form, thematic overlays representing other biophysical elements could be integrated with the results of the PCA to improve the interpretation of the spatial patterns observed in the displayed data sets.
The PCA approach and the graphics capability of the image processor proved
appropriate to the technical concerns of this research. A linked sequence of statistical analysis and spatial display steps was developed. Statistical methods based on principal component analysis were used successfully for compressing multi-temporal spatial data into the critical dimensions that accounted for large portions of the data variability. These methods also provided satisfactory quantitative reporting of the results of the statistical analyses for interpretation purposes and allowed the integration of the output into graphics-oriented software for direct display. The interface between statistical packages and graphics devices formed the bottle-neck in such analyses. Customized programming, software tool kits, and macro languages, available in the more sophisticated software packages, will increasingly facilitate the interface between analytical techniques and graphics software and devices for spatial analyses.
analyzed separately. The fact that the current large study area in the Appalachian Mountains could be evaluated successfully with a single set of equations is a measure of the effectiveness of using DEM data within a GIs. Where previous studies have been limited to relatively few topographic measurements done by hand on paper maps, the GIs technique allows the use of large digital datasets for increased precision. In this case the 4-mile-radius circular coverages around the weather stations involved over 18,000 elevation points each. The improved regression results possible with the described method, along with automated GIs processing procedures, should allow topographically sensitive interpolation of precipitation readings for more accurate mapping of precipitation surfaces.
The greatest shortcoming with the tested approach is that it deals only with topography and location. Meteorological factors such as storm type, wind speed, and wind direction are included only to the extent that they vary by season. Orographic barriers could not be analyzed, and some surface factors such as land cover were also
not studied. Further, the
G I s
coverages that were built around the weather stations fortopographic analysis were restricted to 4-mile-radius circles, while for some applications such as trend surface slopes, a smaller coverage size or even a different shape may have been more effective. Nevertheless, results from the regression analysis can be applied toward mapping precipitation surfaces more accurately through use of an interpolation scheme that recognizes environmental variability as well as distance between the data points.
RECOMMENDATIONS
The results of the analysis of precipitation events and the establishment of
relationships between events and large scale circulation patterns are encouraging. They provide a general precipitation event climatology for the southeast United States, and give preliminary indications of potential changes in event magnitude and frequency as
climate changes. A more refined analysis would provide better founded estimates of
the likely changes. Appropriate techniques of analysis have been developed by the project. Refinement, notably in spatial resolution and in the treatment of extreme events, is possible. Thus it is recommended that:
1. Refinement of the precipitation event climatology be undertaken, with emphases
on increases in the spatial resolution and on extreme events and the application of time series analysis methods.
The event climatology developed here provides a new method of analyzing precipitation data. A high quality precipitation event database is likely to become increasingly important as the new generation of radars (NEXRAD) begins to provide
precipitation event observations with high spatial and temporal resolution. Such a
database will be needed to ensure that analyses of individual-event NEXRAD are placed in the appropriate larger climatological context. Hence it is recommended that:
2. An event climatology database be developed which can be used to place NEXRAD-derived analyses of individual events into a climatological context.
The use of a Geographic Information System provides a convenient method of
displaying and assessing information about events. It is not appropriate for selecting the events themselves, but such a system allows analysis of the detailed spatial structure of a pre-selected event and can display and analyze that structure in relation to other spatial variables such as hydrologic basins and topographic features. The project identified techniques for establishing relations between precipitation and topography, but a more detailed investigation is needed before they can be used reliably and operationally to assess the spatial variation of precipitation in mountainous terrain. Hence it is recommended that:
3. Exploration of the use of GIs techniques to specify the relationship between
precipitation and topography be actively pursued.
1.
PRECIPITATION REGIMES
AND CLIMATIC
CHANGE
Future climatic conditions must be estimated if assessments of the impact of climatic change on human activity and society are to be made. Current understanding of atmospheric processes precludes the production of deterministic forecasts of climate. Rather, estimates must be in the form of scenarios, sets of estimates containing a range of possible future climates without indications of the probability of occurrence of any particular member of the set (National Research Council 1982). The main lines of scenario development are clear (Lamb 1987). At present general circulation model (GCM) outputs, which simulate atmospheric processes in order to specify in broad outline the likely climate after a doubling of atmospheric CO,, must be combined with the local spatial and temporal detail obtained from the observational record to get scenarios useful for impact assessment. The information needed for a particular impact assessment can be derived using one of the many techniques already available for analysis of the historical record (Robinson and Finkelstein 1991). However, there is relatively little experience with scenario development, and it is not clear which methods are appropriate for particular tasks. The present project explores the suitability of one approach for one aspect of water resources impact assessment.
Climate scenarios developed specifically for water resources have tended to use general circulation model outputs rather directly. The most comprehensive assessment of impacts on the broad regional scale for the whole of the United States (Smith and Tirpak 1988) involved a scenario development method where the ratio of precipitation amounts estimated from GCM outputs in the current and the doubled CO, climates was used to modify the current observations to give estimates of future conditions. A similar approach was adopted by Cohen and Allsopp (1988), who were concerned with long- term trends for the whole of the Great Lakes Basin. They used output from a single GCM and were particularly concerned with the ways in which the spatial variation indicated by the GCM's across the basin influenced the impacts. Gleick (1987), on the
other hand, used a similar methodology for the Sacramento River Basin, but he
assumed spatial homogeneity while emphasizing the differences created when several
GCM's are used for the same area. Each of these previous efforts, therefore, has
started with the GCM outputs and modified them, as far as possible, for local conditions. This has the advantage that it allows the relatively rapid development of complete scenarios. However, it cannot readily incorporate true local detail, and thus for example cannot be used with any confidence for small drainage basins on short time scales.
In order to incorporate smaller time and space scales, it is theoretically possible
to start with the local detail and work towards the broader scales where GCM
Both these approaches are potentially highly flexible and useful, but they are complex and do not, at present, lead directly to scenario development. Rather, they must be regarded as being at the exploratory and concept development stage.
There is a well established general relationship between precipitation and circulation (Barry and Perry 1973). This relationship can be used in various ways, including the development of long-range weather forecasts (Klein and Bloom 1987) and the analysis of variations in precipitation amounts (Yarnal and Leathers 1988). There have also been qualitative descriptions of the relationship between circulation and precipitation "events" (e.g. Winsberg 1990; Robinson 1979), the occurrence of individual periods of precipitation, whether they be short, sharp thundershowers, or prolonged periods of widespread steady rain. In particular, it is apparent that the magnitude and frequency of events depends on the atmospheric circulation pattern. However, while there have been numerous detailed analyses of individual events (e.g. Weisman 1990), there has been no synthesis of event information to produce a quantitative climatology of precipitation events. Consequently there has not been an attempt to relate an event climatology to circulation patterns.
The underlying hypothesis for the present work is that there is a quantifiable relationship between circulation patterns and precipitation events. It is postulated that each pattern is associated with a distinct suite of events. As the frequency of the patterns change, so will the associated precipitation. Thus the first step in the production of a scenario, using this approach requires the development of the event/circulation relationship using the historical observational record. Thereafter the
circulation in conditions of doubled CO,, as indicated by GCMs, can be used to
postulate future precipitation regimes. The strength of this approach is that it uses the GCM outputs only for the broad scale information, where the information is likely to be most reliable. However, the approach contains the assumption that circulation and precipitation will continue to be related in the changed conditions in the same way that they are in the present atmosphere. While the current GCM outputs suggest that this is reasonable, it remains an untested working assumption.
The present project develops a quantitative climatology of precipitation events and their relationship to circulation. The emphasis is on scales and types of analyses which lead directly to climate scenario production, but the work itself represents only the first stage in the creation of a scenario development technique. However, the climatology itself has direct implications for hydrology. Individual precipitation events occur on the smallest temporal and spatial scales likely to be of interest for water
resources, and it is possible to synthesize results if a broader scale is needed for a
particular analysis. This includes development and refinement of the type of information usually created when precipitation amounts over fixed time intervals are considered. Further, many of the emerging stochastic, time-series based hydrologic models require information about individual events. While the present climatology is not presented in strict time-series terms, it provides some required quantitative information about the
frequency and magnitude of events. Finally, it can be anticipated that detailed
Weather Radar (NEXRAD) into the field. This project thus provides a first analysis of the type of information they will yield.
The development of a "precipitation event climatology" presents numerous research questions. Preliminary questions range from the choice of the appropriate types of data to use through the precise definition of an event to the spatial interpolation techniques to be used to provide information for the region as a whole. Thereafter are those questions associated with the techniques of data analysis and the interpretation of results. The present chapter concentrates on exposition of the preliminary questions. Early in the project it became apparent that a major research component would be the investigation of appropriate spatial interpolation techniques. Theoretically the best techniques revealed by that investigation should be used to develop the soundest precipitation event climatology. However, for practical reasons the approach adopted was to use parallel tracks, with one track developing the precipitation event climatology using traditional spatial analysis techniques while the other track used Geographic Information Systems (GIs) techniques to explore the techniques in depth. As a result, Chapters 2 and 3 of this report emphasis traditional methods of analysis to develop the precipitation event climatology and its relation to circulation patterns, while Chapter 4 concentrates on the GIs-based spatial analysis. Potential links between the two are apparent. Indications of future research needed to strengthen these links and to more clearly indicate the precipitation response to climatic change are given in the Recommendations.
This project is part of a program whose ultimate aim is to assess the precipitation regime changes likely to arise from climatic changes, with emphasis on the information
needed for water resource planning. The goal of this specific project is to ascertain the
changes in precipitation regimes which arise from changes in atmospheric circulation
patterns. The area of concern is the southeast United States, defined primarily as the states of Alabama, Florida, Georgia, North Carolina, South Carolina, Tennessee, and Virginia.
To meet this goal, there are the following objectives:
o To define precipitation events;
o To develop methods of creating precipitation event climatologies;
o To specify such a climatology for the southeast United States;
o To develop individual station climatologies;
o To determine the spatial variation of these climatologies;
1.A. PRECIPITATION EVENTS AND ATMOSPHERIC CIRCULATION
Almost all previous analyses of precipitation, both for climatological and hydrologic purposes, deal with precipitation totals over a fixed time interval. The data may be modified to refer to intensities or area/depth/duration statistics, or raindays may be considered, but the basic temporal unit is fixed. The only common alternative approach is to select an individual storm of particular meteorological or hydrological interest and analyze it in detail. Here the time interval will be the length of the storm itself. However, there is no precedent for a climatological analysis of all such "storms", where the temporal unit is dictated by the storm itself. Such an analysis is the focus of the present study. Since there is no precedent in the literature, there is no appropriate terminology whereby the climatology may be described. Hence throughout the work the following terms are used:
A precipitation event is a single period of precipitation at a particular station, separated from other events by a distinct dry interval. An event is defined for a SINGLE station. Throughout the project the practical definition of an event is a period of one or more hours of precipitation separated from other events by a dry interval of at least 2 hours. A single event can contain dry periods of no more than one hour duration. Details of the rationale and options behind this definition are given in Chapter 2.
The term storm is used when periods of precipitation, concurrent or consecutive, at several stations are discussed. This is mainly used in connection with the GIs analysis.
The precipitation regime is the frequency distributions of a series of precipitation events which incorporate measures of event duration, event amount, and the interval between events. The regime can be considered for a single point, or more commonly for a geographic region containing a series of points with similar individual regimes. For this project a major emphasis is on the difference in regimes between periods of different circulation patterns.
A precipitation event climatology is a summation of the characteristics of the
precipitation events, incorporating the precipitation regime information but including measures of both temporal and spatial variability. It is thus the most general term, intended to be analogous to the more common climatology based on precipitation amounts and including long-term normals and variations about the normal.
The event attributes considered as part of the precipitation regime are:
(1) event duration
-
the length of the event (hours, to nearest hour) at a singlestation;
(2) event amount
-
the total precipitation (inches to tenths) at the station during theevent;
(3) event interval
-
the time (hours, to nearest hour) between the end of one eventThese definitions are derived from consideration of the surface based observational record of precipitation. While the rationale for use of these data is considered later, they have been the most commonly used data for precipitation analysis. Climatologically most previous work, whether addressing future climates or not, has emphasized total amounts occurring over specific time intervals such as a day
or a month (e.g. Plummer 1983; Eder et al. 1983). There has been some consideration
of relationships between amounts and the frequency of raindays (e.g. Jackson 1986), but no formal analysis of relationships between amounts, raindays and events. This
must be a component of any event climatology which is developed. There is a rapidly
growing body of climatological information linking precipitation to circulation, notably
for long-range forecasting through teleconnections (e.g. Hamilton 1988). Using
precipitation amounts, usually on a monthly basis, several authors (e.g. Ogallo 1988) have suggested that there is a relationship with circulation, but only weak correlations have been established. It must be anticipated that similarly low correlations are likely to be found when the event shorter term event information is used. From the water resources perspective, much more work has been implicitly concerned with precipitation events. Most notable are the efforts directed towards various forms of area-depth- duration curves as discussed in most hydrology texts (e.g. Chow 1964). Explicit treatment of individual events, specifically for assessing impacts (e.g. Wlks 1989) is increasing, while the stochastic models (e.g. Bodo et al. 1987) demand information akin to an event climatology. Most of the event based analysis, whether implicit or explicit, treat the underlying climate creating the events as invariant. The present work constitutes a first step in incorporation of a dynamic climate into the event analyses.
A major concern in any precipitation analysis has always been the spatially and temporally discontinuous nature of the phenomenon. The surface based observing network must perforce obtain only a small sample of the conditions. Interpolation between data points has always been uncertain, particularly in areas of topographic diversity. This can be a critical problem when relatively short-term individual events are
of concern. Traditional interpolation methods may incorporate the influence of
topography and surface character as well as distance from observing sites but must use standardized values for all events. Thus they can be highly misleading for an individual
event. However, as an event climatology is being developed, it is also possible to explore the use of the new techniques of spatial analysis being developed for GIs. This has the potential to expand the information available from point specific to area-wide, and thus to increase knowledge of the climatology of the spatial extent of events as well as their temporal detail.
Atmospheric circulation is commonly characterized by an "index" calculated from
atmospheric pressures at selected stations (Wallace and ~ u t z l e r 1981). It is
suitability of each of these well established indices, and to compare their performance to indices which could be specially constructed for the project.
Any index used for the project had to characterize the atmospheric flow in the southeastern United States in sufficient detail to allow separation of event characteristics
as a function of the index value, but at the same time had to be sufficiently general to
contain the type of broad-scale circulation information created by GCMs. Thus indices on various spatial scales were tried in an exploratory mode. The starting point was the pressure distribution across the Southeast itself, using pressures at New Orleans, Miami,
Washington and St. Louis obtained from the Daily Weather Maps
-
Weekly Series (Hatch1983). Indices using various combinations of these stations were tested, but all had a
major failing. Whenever a depression passed through the Southeast, the depression
position was largely responsible for the pressure distribution rather than being a
response to that distribution. Consequently any index developed tended to be rather unstable. It appears, although not rigorously tested during that analysis, that an index on this scale would be appropriate if conditions in a small area, such as part of an individual state, were being considered. For the Southeast as a whole, however, a much broader index was needed. Consequently the two broader, continental-scale indices, PNA and NAO were used throughout the project.
The Pacific North America (PNA) (Wallace and Gutzler 1981) index has been used frequently to characterize the zonality or meridionality of circulation across the
United States. In previous studies it has been shown that the PNA index explains a
significant portion of the variability in monthly totals of temperature and precipitation in the southeastern United States (Yarnal and Diaz 1986). The PNA index is based on 700 mb pressures at three points; the Gulf of Alaska, northwestern Canada, and the southeastern United States, such that:
PNA (Index) = 1/3[-z(47.9 N, 170.0 W)
+
z(49.0 N, 11 1.0 W)-
z(29.7 N, 86.3 W)] (1)where z is the standardized 700mb height anomaly. Positive numbers indicate
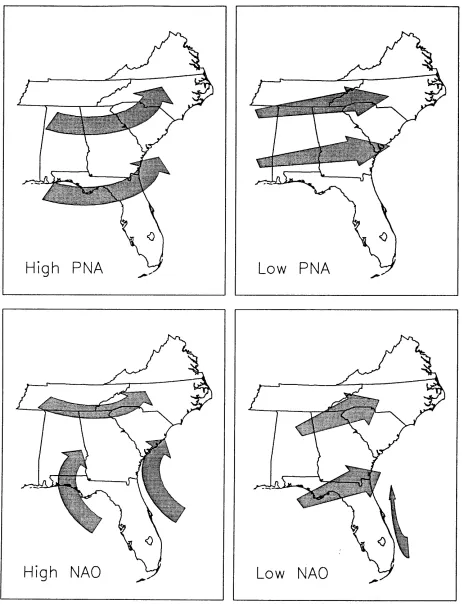
meridional flow over the continent and negative numbers are indicative of zonal flow (Yarnal and Leathers 1988). For the Southeast this implies that with a negative index air is sweeping into the area more or less directly from the west. With a positive index, however, the major airflow is still generally from the west, but has a southward loop as it passes over the Southeast (Fig. 1).
The North Atlantic Oscillation (NAO) index (Barnston and Livezy 1987) is based on the difference in mean sea level pressure, p, between Ponta Delgarda, Azores, and Akureyri, Iceland (Rogers 1984):
NAO (Index) = ~(Azores)
-
~(lceland)(2)
High NAO
y
Low
NAO
Fig. 1 : Highly generalized schematic of the flow patterns over the southeastern United
The hypothesis that the circulation patterns indicated by these indices can be associated with specific precipitation regimes comes from the basic tenets of synoptic climatology (Hare 1966; Barry and Perry 1973). Various methods of linking circulation and precipitation are possible, from the highly subjective (Muller 1977) to the almost completely objective (Kalkstein and Corrigan 1986; Todhunter 1989), while some statistical techniques which are not strictly synoptic in character fulfill a similar linking function (Klein and Bloom 1987). An objective analysis is theoretically most desirable. However, it is premature for the present project, where simple measures such as the number of events, their interannual variation, or the spatial variation, are not known except in the most imprecise terms. Indeed, the emphasis throughout the project must be placed on exploratory and somewhat descriptive analysis. An objective approach becomes appropriate after this exploratory stage, and indeed would constitute the next step in the analysis of the precipitation regimes and in scenario development.
A qualitative discussion of the links between precipitation events and circulation in the Southeast can be used to illustrate the underlying hypothesis of this project. At the simplest level, precipitation events in most of the Southeast can be classed as having their origin either in travelling cyclonic features or in isolated convective storms. Cyclonic events tend to move across the Southeast from west to east, bringing periods of steady rain which may last for several hours and cover virtually a whole state (Hayden 1981). Embedded within the cyclone may be frontal activity and some convective
events. At a particular station a prime characteristic would be the possibility of a
relatively long-lived event with small rainfall amounts. This can be contrasted with the convective event, mainly envisioned as an isolated thunderstorm (Robinson and Easterling 1988). Here an event is likely to be of short duration but give copious rain. For both types of situation much natural variation will occur, with long-lived convective storms (Bosart and Sanders 1981) and intense depressions. In addition, the amounts, and to a lesser extent, the duration, will depend in the exact location of the measuring station relative to the storm activity (March et al. 1979). Thus the actual amounts from any event will depend on much more that the type of event (Cordova and Rodriguez- lturbe 1985). Hence there is no possibility of classifying storms by mode of origin simply using the amount and duration of an event. Nevertheless, when a long period of record is available so that frequency distributions can be developed, a tendency towards short durations suggests a convective regime while longer durations indicate a cyclonic one.
This tendency towards one type of storm or another is likely to be the result of the relative frequency of the various circulation patterns, and hence influenced by the various circulation indices. Some tentative links have been established between circulation indices and precipitation amounts (e.g. Yarnal and Leathers 1988), but not precipitation events. For events, the most which can be undertaken at present is to develop some hypotheses as to the linkages and provide preliminary tests of their validity. From climatological considerations it can be suggested that the link is likely to be most marked in the winter half year, when the whole of the hemispheric circulation is strongest and most clearly defined. In general winters with high NAO values should give above normal precipitation in the region (Lamb and Peppler 1987). The strong flow
duration convective storms while preventing many depressions from entering the area
from the west. High NAO values in summer, in contrast, are likely to lead to
precipitation deficits, since it is in high NAO summers that the well developed subtropical high pressure region extends from its common location over Bermuda to cover parts of the Southeast USA. Few storms can either develop in, or pass through, the region in this situation. For the PNA index the summer influence is likely to be highly variable. Circulation is usually weak over the Southeast, with a mixture of
depressions and convective storms in all cases. The variation with PNA in winter,
however, is likely to be much clearer. A zonal (negative) pattern brings rapidly moving and intense depressions from the west, while allowing some convective storms. Hence
short-duration and intense events are likely to dominate. With a high (meridional) PNA,
the influence depends largely on the exact location of the southward loop of the airflow. To a great extent, however, it is likely that the western part of the region will have below normal precipitation amounts, almost all coming from travelling depressions, while the east coast will have high precipitation amounts, when interactions between the subtropical Atlantic air and the cold air from the west can produce violent storms
(Douglas and Englehart 1981).
This qualitative analysis applies to most of the southeastern United States. However, it is likely that the extreme south of Florida has rather different characteristics. Cyclonic events are likely to be relatively rare in this near-tropical region, and convective events will dominate. Hence a less close connection between precipitation events and circulation can be anticipated. Nevertheless, analyses of the south Florida area are undertaken in the same way as for the mid-latitude area, providing information about the suitability of the method in two distinct climatic regions.
Much of the subsequent analysis is undertaken on a seasonal basis. In the tropical area the use of seasonal information based on the mid-latitude definition of seasons can be somewhat misleading. Nevertheless, again for consistency, the same seasonal definition is used throughout the work. Thus the seasons are:
Winter
-
December, January, February;(winter is identified by the year of the included December)
Spring
-
March, April, May;Summer
-
June, July August;Fall
-
September, October, November.The season was adopted as the prime unit of time for the project after a preliminary analysis of the frequency of events on a monthly basis. In particular, a seasonal scale
produces enough events to allow some statistical tests 'while retaining
many
climatological characteristics in common. In addition, it appears to be
an
appropriately1.B. DATA AND ANALYSIS METHODS
Precipitation can be measured directly using a raingauge or it can be sensed remotely using radar or satellite information. Although raingauge data were used exclusively in this work, some of the analyses have the potential to use other data sources in the future. For example, radar observations can provide great spatial detail over a wide area, and with a fine temporal resolution. Current instruments yield only imprecise quantitative information but the newer Doppler radar, due to be installed in the next few years, is likely to provide a highly reliable quantitative estimate of precipitation with a fine spatial resolution. Thus it can be anticipated that some of the techniques developed here will be directly applicable to the analysis of the radar information as it becomes available. Precipitation measurements from satellites are still
very much in the experimental stage, and cannot be considered sufficiently reliable for
use here. Again, technological advances are likely to change this picture, but probably not in the foreseeable future will satellite observations be the prime data source for anywhere but oceanic areas.
With the emphasis of this project on the long-term conditions, including means and variations, the surface-based gauge data provide the best available data source. Raingauge observations provide a direct record of rainfall amounts at specific locations on the surface of the earth. The catch of each individual gauge will depend on the type of gauge, the wind speed and direction, the amount of splash, and the exposure of the gauge as well as the actual precipitation amount falling (Robinson 1990). Hence the
observations are prone to error. It is normally assumed that the accuracy increases as
the accumulation period increases, with monthly totals being more reliable than daily ones. Here the accumulation is not for total amount, but for the number of events. Hence the values for an individual event are probably somewhat unreliable, but the suite of events indicated by a frequency distribution are likely to be more reliable. For the
present purposes the recorded values are accepted as accurate.
For an analysis of spatial patterns, two approaches have traditionally been used, statistical and spatial approaches. The statistical approach uses distance measures as independent variables in a linear or non-linear model to calculate the influence of geographic patterns on a dependent variable. This approach has the advantage of
providing some measure of association between two or more variables along with a
measure of statistical confidence in the observed association. The disadvantage in this approach is that the association is based on a sample and the sample may be spatially biased, or geographically unrepresentative of the population that comprise the events.
The spatial analysis approach is based on map comparisons. Map comparisons parallel statistical methods in that the maps being compared can be measured against
an expected surface, or two independently observed spatial distributions. This
data are point samples which are then spatially interpolated to yield continuous statistical surfaces. These surfaces are abstractions of the true continuous phenomena but the relationship between the true occurrence of the phenomena in space and the climate stations used to derive the subsequent surface is not known. The use of an
algorithm for the generation of this surface is subjective and, therefore, can be
insensitive and/or inappropriate either from a statistical or biophysical perspective. Secondly, a reliable measure of accuracy, such as a confidence interval spatially represented through isolines related to the interpolated surface, is not a standard by-product of the analysis. Overall, therefore, selection of an appropriate interpolation approach should be based upon spatial and environmental sensitivities and error calculation and reporting capabilities. Here the environmental sensitivities of the spatial interpolation approaches are defined as those interpolation techniques that integrate biophysical elements of the landscape, such as topography, with the spatial relationships between stations and their recorded precipitation amounts.
The statistical approaches have been commonly used in climatological research, while the spatial approaches are themselves the focus of research. Consequently, in order for the project to progress smoothly, a decision was made to proceed along two parallel tracks. Standard statistical methods would be used for the basic event
climatology determination (Chapters 2 and 3), while spatial techniques would be
examined for a series of individual events (Chapter 4).
There are two major observational networks, and associated datasets, having long-period precipitation records, Climatological Data (CD) for daily total values and
Hourly Precipitation Data (HPD) for hourly ones (Hatch 1983). The network of the
former is much more dense than for the latter. There are also some stations taking 15 minute observations, and some research sites with 1 minute values, but these are relatively few, with short periods of record. The observational networks themselves are not invariant, with old stations closing and new ones opening at frequent intervals. Further, no station has a complete unbroken record of observations throughout its life. Some have very small amounts of missing data, others may miss complete months. Hence any spatial analysis must consider both the density of the observing network and the quality of the data obtained by the various stations it contains.
From the practical viewpoint, the data were obtained on optical disks (Earthlnfo, Inc., Boulder, CO). For the precipitation event climatology this was a convenient method of data storage and allowed easy retrieval since most of the analysis was undertaken on microcomputers. It was somewhat less convenient than magnetic tape obtained directly from the National Climatic Data Center would have been for the GIs portion, where the machines are more adapted to tape media.
Numerous analysis of spatial variation, on various time and space scales, were required. In most cases it was impractical and inadvisable to use all stations for all analysis, and various data subsets were identified. No attempt was made to ensure that
each subset was completely consistent with the others. The prime concern was
that the
State GA SC TN GA GA AL TN GA FL NC FL TN FL TN GA TN AL AL FL VA SC NC VA VA VA NC VA
Station Latitude Longitude Start Stop Percent Missing
AUGUSTA WSO AP CHARLESTON WSO Crty CHAlTANOOGA WSO AP CLERMONT 3 WSW COOLIDGE
DADEVILLE 1 E DICKSON FOLKSTON 3 SW GRACEVILLE 1 SW CAPE HATTERAS WSO KEY WEST WSO AP KNOXVILLE WSO AP LAKELAND 3 SE LIVINGSTON 5 NE MACON WSO AP MEMPHIS FAA-AP MOBILE WSO AP MONTGOMERY WSO AP MOORE HAVEN LOCK 1
NORFOLK WSO AP PICKENS 5 SE POLKTON 2 NE RICHMOND WSO AP ROANOKE WSO AP WASH NATL WSCMO AP WlLMlNGTON WSO AP WYTHEVILLE 1 S
Month Month Complete Months
811 948 611 948 911 948 611 948 611 948 611 948 911 948 711 948 111 942 511 957 811 948 911 948 311 943 911 948 1 /I 949 911 948 711 948 711 948 1 11 942 811 948 811 951 611 948 811 948 811 948 511 948 1011 949 811 948
All stations continue through 1211987 (end of period of use)
The exploration of spatial techniques using GIs methods focussed exclusively on North Carolina conditions. As far as possible all available stations were used for each event. The HPD formed the basic data source, but where appropriate, CD data were also used. Since for North Carolina there are approximately 150 daily stations, in contrast to less than 50 hourly ones (Fig. 2), this considerably increased the available data and enhanced the spatial resolution.
For the development of the precipitation event climatology using the traditional
spatial analysis techniques and statistical approaches, the HPD dataset were used
exclusively. The prime subset was a 27 station network for the whole of the southeast
(Table 1). Here an attempt was made to develop a uniform 2' x 2" grid across the area
using stations with at least 30 years of record and with less than 10% of the data
Fig. 3: Stations in (A) the 2'
x
2' Southeast network (stations with detailed analysisshown by squares) and (B) the North Carolina network (stations in the mountain
Examination of data available for these stations indicated that for the 1958-1987 period there was little missing data at any station, and thus this was used as the prime period for analysis. Whenever detailed analysis of conditions across the whole southeast was
required, 6 stations were selected from this network: Cape Hatteras N.C., Key West FI.,
Macon Ga., Memphis Tn., Mobile Al., and Roanoke Va. These represent the full range of locations and climatic conditions across the area.
Some of the preliminary testing of methods and techniques was undertaken using networks in North Carolina. The basic network (Fig. 3B, Table 2) contained 37 stations including Cape Hatteras, Polkton and Wilmington, the North Carolina stations included
in the
2
'
x2
'
network. This network was used to investigate the influence of scalechanges on the event climatologies and the relationship with circulation. Data used covered the years 1950-1986. An attempt was made to use only those stations without significant missing data. However, it was necessary to include some stations with as many as seventy months missing in order to provide sufficient spatial coverage for mapping purposes. Consequently this network does not include a uniform reporting period for all stations, so that some biases are possible. Even so, there were still some areas not covered well by hourly recording stations and results in these regions should be treated with extra caution.
The analysis of the influence of topography on precipitation events required a dense network of stations within the Appalachian Mountains. Again North Carolina stations were chosen. Twenty stations, part of the basic North Carolina network, and stretching from the piedmont foothills into the western mountains, having data from January 1951 to December 1980 were used. This gave the most widespread and uniform coverage for the stations, allowing comparison for a more or less uniform
period. Overlap with the
2
'
x2
'
network is provided by the Polkton station. The 20stations used are the total number of stations with usable records in the area. This network was designed specifically for an analysis using the same techniques as for the rest of the precipitation event climatology. To a great extent it is coincident with the stations used in the GIs analysis of the effect of topography on individual events.
The decision to use the PNA and NAO indices as the circulation measures meant that the circulation datasets were readily available. These were obtained as monthly values from Leathers (1989, personal communication) for PNA and from Rogers (1984) for NAO. The only processing needed prior to their use was the creation of seasonal values from the monthly data.
STATION STATION ELEVATION LAT
NAME NUMBER (feet)
ASHEVILLE WSO AP 300
ASHFORD 31 2
BAD1 N 438
BURLINGTON 3 NNE 1241
CAPE HATTERAS WSO 1458
CARTHAGE 8 SE 151 5
CEDAR MOUNTAIN 1614
CHARLOTTE WSO AP 1690
DALTON 2230
DOBSON 2388
ELIZABETH CITY 271 9
ELIZABETHTOWN LOCK 2 2732
ELKVILLE 2757
FRANKLINTON 3 ESE 3232
GREENSBORO WSO AP 3630
GREENVILLE 3638
HAYWOOD GAP 3925
HELTON 3957
KILL DEVIL HILLS N M 4649
LAKE LURE 2 4764
LAURINBURG 4860
LEXINGTON 7 N 4975
MAX PATCH MOUNTAIN 5402
MOORESVILLE 2 WNW 581 4
MOREHEAD CITY 2 WNW 5830
MOUNT PLEASANT 5945
NORTH FORK 623 1
N WILKESBORO 12 SE 626 1
POLKTON 2 NE 6867
RALEIGH DURHAM WSFO AP7069
RALEIGH STATE UNlV 7079
ROARING GAP 1 NW 7324
SHELBY 2 7850
SNEADSFERRYZ ENE 8037
WlLMlNGTON WSO AP 9457
WILSON 3 SW 9476
YADKINVILLE 6 E 9675
LONG
82:33 81 5 7 80:07 79:24 75:33 79:20 82:38 80:56 80:24 80:44 76:12 78:35 81 :24 78:25 79:57 77:23 8255 81 :30 7540 82:14 79:27 80:16 82:57 8050 76:44 80:26 82:20 80:59 80: 1 1 78:47 78:42 81 :00 81 :33 77:24 77:54 77:57 80:31
PERIOD OF RECORD % NETWORK
Start 911 964 611 948 411 948 611 948 511 957 311 958 911 948 611 948 611 948 1011 942 1111954 611 948 611 948 611 948 611 948 1011955 911 948 411 958 611 948 611 948 611 948 611 948 911 948 311 949 611 948 611 948 611 948 911 948 611 948 611 948 611 948
lO/l942 611 948 611 948 10/1949 811 940 611 948
End' COMPLETE*