DOI: 10.1534/genetics.107.079988
Nucleotide Variation in Wild and Inbred Mice
Tovah Salcedo, Armando Geraldes and Michael W. Nachman
1Department of Ecology and Evolutionary Biology, University of Arizona, Tucson, Arizona 85721 Manuscript received August 4, 2007
Accepted for publication October 15, 2007
ABSTRACT
The house mouse is a well-established model organism, particularly for studying the genetics of complex traits. However, most studies of mice use classical inbred strains, whose genomes derive from multiple species. Relatively little is known about the distribution of genetic variation among these species or how variation among strains relates to variation in the wild. We sequenced intronic regions of five X-linked loci in
large samples of wildMus domesticusandM. musculus, and we found low levels of nucleotide diversity in both
species. We compared these data to published data from short portions of six X-linked and 18 autosomal loci
in wild mice. We estimate thatM. domesticusandM. musculusdiverged,500,000 years ago. Consistent with
this recent divergence, some gene genealogies were reciprocally monophyletic between these species, while others were paraphyletic or polyphyletic. In general, the X chromosome was more differentiated than the autosomes. We resequenced classical inbred strains for all 29 loci and found that inbred strains contain only a small amount of the genetic variation seen in wild mice. Notably, the X chromosome contains proportionately less variation among inbred strains than do the autosomes. Moreover, variation among inbred strains derives from differences between species as well as from differences within species, and these proportions differ in different genomic regions. Wild mice thus provide a reservoir of additional genetic variation that may be useful for mapping studies. Together these results suggest that wild mice will be a valuable complement to laboratory strains for studying the genetics of complex traits.
T
HE house mouse presents an excellent mammalianmodel for studies of the genetic basis of complex traits, including many diseases. Dozens of inbred strains are available with sufficient genetic variability among them for linkage mapping and association studies (Paigen2003a,b; Peterset al.2007). A variety of mo-lecular genetic tools are available for the mouse, mak-ing it possible to identify and functionally characterize candidate genes for some traits. The mouse genome
has been sequenced (Waterstonet al.2002), patterns
of expression in different tissues have been described
for nearly all genes (e.g., Suet al.2004), there is a large
and growing set of knockouts, and phenotypes have
been associated with.10% of all genes (Grimm2006).
The classical inbred strains in which these resources have been developed, including the sequenced C57Bl/
6J (Waterstonet al.2002), derive from matings among
different species of the house mouse (Silver 1995;
Wadeet al.2002). Thus, understanding the genetic var-iation among inbred strains requires understanding the evolutionary history of the species from which they were derived. The house mouse consists of three main
lineages:Mus domesticusin Western Europe,Mus
muscu-lus in Eastern Europe and Asia, and Mus castaneus in
Southeast Asia and India (also referred to as subspecies of Mus musculus: i.e., M. m. musculus,M. m. domesticus, and M. m. castaneus; Silver 1995). M. musculus and
M. domesticusdiverged between350,000 and 1,000,000
years ago (Sheet al.1990; Boursotet al.1996; Suzuki
et al.2004). These species recently came into secondary
contact following the spread of M. domesticus into
Western Europe from the Middle East with the spread
of agriculture over the last few thousand years (Cucchi
et al.2005).M. domesticusandM. musculusform a stable hybrid zone where they meet, and laboratory crosses between these species result in sterile hybrid males (Britton-Davidian et al. 2005). Classical lab strains
of mice derive principally from M. domesticus and M.
musculus, with a smaller contribution fromM. castaneus (Silver1995; Wadeet al.2002; Frazeret al.2007; Yang
et al.2007). The partitioning of genetic variation among M. musculus and M. domesticusis largely unknown. In particular, the recent separation of these lineages raises the possibility that some loci will retain ancestral poly-morphisms and that other loci will show fixed differ-ences. From a genealogical perspective, some loci may
be monophyletic within each species (i.e., all alleles
within a species are more closely related to each other than to any alleles in the other species), while other loci
may be paraphyletic or polyphyletic (i.e., some alleles
within a species might be more closely related to alleles Sequence data from this article have been deposited with the EMBL/
GenBank Data Libraries under accession nos. EF067347–EF067807 and EU220489–EU220697.
1Corresponding author:Department of Ecology and Evolutionary Biology, Biological Sciences West Bldg., University of Arizona, Tucson, AZ 85721. E-mail: [email protected]
in the sister species than to other alleles within the same species; Figure 1).
The relationship of classical inbred strains to wild mice is important for several reasons. First, it is likely that the different inbred strains capture a small amount of the naturally occurring variation, but the amount of variation in the wild is still unclear. What proportion of haplotypes and single nucleotide polymorphism (SNPs) found in wild mice are also present among inbred strains? Does this pattern differ between the X chromo-some and the autochromo-somes? Differences between the X chromosome and autosomes among inbred strains might arise if selection acted differently on the X and autosomes during the founding of these strains or if unequal numbers of males and females were used in the founding of these strains. Wild mice might provide a reservoir of additional genetic variation for studies that seek to understand the genetic basis of complex traits, but quantifying variation in the wild is a necessary first step. Second, some of the variation among inbred strains derives from fixed differences between species, while some of the variation reflects differences within
one or several species (Wadeet al.2002). Epistatic
inter-actions between alleles from different species are likely to have shaped the current variation among strains (Payseurand Hoekstra2005; Petkovet al.2005), and this is likely to affect the genetic architecture underlying complex traits.
Although several large-scale efforts have character-ized variation among classical and wild-derived inbred
strains of mice (Wadeet al.2002; Wiltshireet al.2003;
Frazeret al.2004; Ideraabdullahet al.2004; Petkov
et al.2004; Yalcinet al.2004; Frazeret al.2007; Yang
et al.2007), these studies do not adequately describe the amount of variation in natural populations for two
reasons. First, and most importantly,,10 wild-derived
inbred strains of each species (and often only 1) have been included in these studies, representing a very small portion of the geographic range of the wild house mice. Second, some of these studies have described variation among wild-derived inbred strains for polymorphisms
that were previously ascertained among the classical inbred strains. This ascertainment bias may hide the true distribution of variation in natural populations (Boursotand Belkhir2006).
To begin to address these issues, we compared varia-tion among nine of the most commonly used classical
inbred strains with variation among wildM. domesticus
and M. musculus. First, we present data from five X-linked loci sequenced in relatively large samples of wild mice and we compare these data to previously published X-linked and autosomal data. Second, we sequenced eight inbred strains and analyzed them with the already sequenced C57Bl/6J for nearly all genes for which polymorphism data have been published from wild M. domesticus and M. musculus for a total of 11 X-linked and 18 autosomal loci. Finally, we compared all data to the publicly available SNP databases.
MATERIALS AND METHODS
Samples: We sequenced five X-linked loci in large samples of wild mice and then resequenced eight classical inbred
strains and one eachM. spretusandM. carolifor 11 X-linked
and 18 autosomal loci. These include the five X-linked loci as well as 24 loci for which wild mouse population data have
al-ready been published (Harr2006a; Bainesand Harr2007).
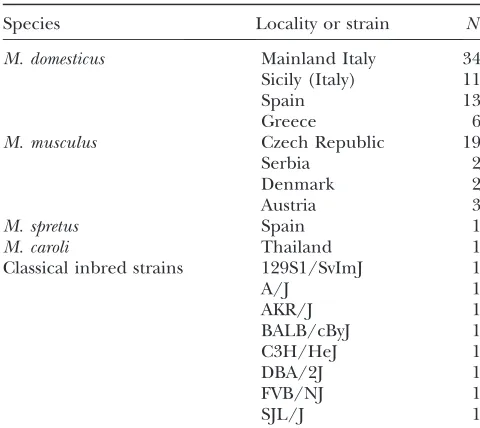
Male M. domesticus and M. musculus were wild caught in Europe (Table 1). Males were used to obtain unambiguous haplotypes for X-linked loci. The standard karyotype of M. domesticus is 2n¼40, with all acrocentric chromosomes.
However, M. domesticus has many chromosomal races with
2n, 40; allM. musculushave 2n¼40 (Pialeket al.2005).
To exclude chromosomal races, allM. domesticuswere
karyo-typed as described previously (Nachmanet al.1994), and only
mice with 2n¼40 were used. Genomic DNA representing the
classical inbred strains 129S1/SvImJ, A/J, AKR/J, BALB/ cByJ, C3H/HeJ, DBA/2J, FVB/NJ, and SJL/J, as well as one M. spretusand oneM. caroli, was purchased from the Jackson Laboratories (Bar Harbor, ME). Sequence for C57Bl/6J was downloaded from NCBI or Ensembl (Build 36).
Molecular methods:Five X-linked loci were surveyed in wild
mice:Maoa,Dmd,Msn,Dach2, andAmelx(supplemental
Fig-ure 1 at http://www.genetics.org/supplemental/). Loci were chosen so as to (i) be evenly distributed along the X chromo-some, (ii) have human homologs for which population genetic Figure1.—Hypothetical examples of gene
ge-nealogies for alleles sampled fromM. domesticus
andM. musculus. As two species diverge, gene gene-alogies are expected initially to be polyphyletic (left), then paraphyletic (middle), and finally monophyletic (right). Because of the variance in evolutionary history among loci, all three patterns might be present in different genes in the genome at the same time, especially in the early stages of divergence. Without recurrent mutation, shared polymorphisms (squares) will be associated only with polyphyletic genealogies, fixed differences (triangles) will be associated only with paraphy-letic or monophyparaphy-letic genealogies, and polymor-phisms that are present in just one species (circles) may be associated with any of these
data have been published (Hammeret al.2004), and (iii) have
at least one long intron (.5 kb). We focused on introns to
capture a large amount of genetic variation. Our survey of Amelxincluded four small exons, which were excluded from analysis. All sequence information was based on Build 36 of the mouse genome.
Amplification and sequencing primers were designed
us-ing Primer3 (Rozen and Skaletsky 2000) on sequences
prescreened using RepeatMasker (Smit et al. 1996–2004).
Amplification primer sequences are given in supplemental Table 1 at http://www.genetics.org/supplemental/. Portions ofDach2,Amelx,Maoa, andMsnwere PCR amplified in a single
amplicon using high-fidelity Taq polymerase (Invitrogen,
Carlsbad, CA). The following PCR conditions were used:
initial denaturation (94°for 2 min) was followed by 35 cycles
of 30 sec at 94°, 30 sec at 57°, and 5 min at 65°. High-fidelity
(Invitrogen) and HotMaster (Eppendorf, Westbury, NY)Taq
polymerases were used to amplify a portion of one intron of
Dmdin multiple amplicons. PCR products were cleaned using
either the QIAGEN (Valencia, CA) PCR clean-up kit or the 96-well format by the Genomic Analysis and Technology Core at the University of Arizona. Sequencing was performed on both strands using either an ABI 377 or a 3731 automated sequencer.
Data analysis:Sequences were trimmed and assembled into contigs using Sequencher (Gene Codes, Ann Arbor, MI). These contigs have been deposited in GenBank under ac-cession nos. EF067347–EF067807 and EU220489–EU220697. Alignments generated with Sequencher were manually edited using MacClade (Sinauer Associates, Sunderland, MA). Sum-mary statistics describing the level and pattern of nucleotide
variability were calculated manually or by DnaSP (Rozasand
Rozas1999). We also used DnaSP to calculate Hudson’s
mini-mum number of recombination events, Rm (Hudson and
Kaplan1985), and to describe linkage disequilibrium.
Hap-lotype networks were drawn manually and neighbor-joining
trees were generated using PAUP*, version 4.0b10 (Swofford
2003).
We performed several statistical tests of a neutral model of
molecular evolution. Tajima’sD(Tajima1989), Fu and Li’sD
(Fuand Li1993), and Fay and Wu’sH(Fayand Wu2000) all
describe the allele-frequency spectrum by comparing different
estimators ofu, the population mutation parameter (u¼3Nem
for the X chromosome andu¼4Nemfor the autosomes, where
Neis the effective population size andmis the neutral mutation
rate). We used several tests because they differ in their power to detect different perturbations from neutral equilibrium
conditions (Braverman et al. 1995; Simonsen et al. 1995;
Przeworski2002). These tests were conducted using software
available from Y. X. Fu (http://hgc.sph.uth.tmc.edu/fu) and from J. Fay (http://www.genetics.wustl.edu/jflab/htest.html). The HKA test compares the ratio of polymorphism to
diver-gence among two or more genes (Hudsonet al.1987).
Pair-wise and multilocus HKA tests were performed using software
developed by Jody Hey (http://lifesci.rutgers.edu/heylab/
HeylabSoftware.htm#HKA).FSTvalues and analysis of
molec-ular variance (AMOVA) results were calculated using Arlequin (Schneideret al.2000).
We also analyzed the data in the Mouse Phenome Database (MPD; http://www.jax.org/phenome) for the corresponding portions of the 11 X-linked and 18 autosomal loci. MPD includes a comprehensive database of all known mouse SNPs and it integrates SNPs from many sources, including the Broad
Institute (Lindblad-Tohet al.2000), Celera (e.g., Lemonet al.
2003), Perlegen (Frazeret al.2007), The Jackson Laboratory
(Petkovet al.2004), The Wellcome Trust Centre for Human
Genetics (e.g., Yalcinet al.2004), The Genomics Institute of
the Novartis Research Foundation (Pletcheret al.2004), and
others. This database contains.10 million SNPs representing
.100 classical and wild-derived inbred strains of mice. We
queried MPD for all SNPs in the regions that we sequenced. We conducted mouse-genome-specific BLAST searches using NCBI or basic local alignment tool (BLAT) searches with the University of California at Santa Cruz mouse genome server and identified sites that overlapped with our resequencing targets. All SNPs identified solely by differences from
repre-sentatives ofM. castaneusorM. molossinus(a hybrid between
M. castaneus and M. musculus) were excluded to match the sampling used here.
RESULTS
Level and pattern of genetic variation at five X-linked genes: We sequenced 4–5 kb of intronic DNA at each of five X-linked genes (supplemental Figure 1 at http://
www.genetics.org/supplemental/) in 60–64M. domesticus
and 18–22M. musculus. Levels of nucleotide variability
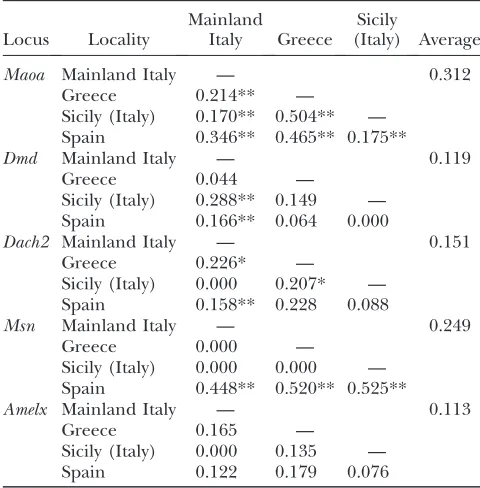
were low in both species, with 1–29 segregating sites/ locus (Table 2; Figure 2; supplemental Figures 2 and 3). InM. domesticus, nucleotide diversity ranged from 0.03 to 0.15% among the five genes, with an average value of 0.07%, almost identical to the average value for
X-linked genes in humans (e.g., Hammeret al.2004). InM.
musculus, nucleotide diversity was considerably lower, ranging from 0 to 0.06% among genes, with an average value of 0.03%. We used the estimates of nucleotide diversity to estimate species-wide effective population
sizes, assuming a mutation rate of 43109(Waterston
et al.2002). Thus, forM. domesticus,Ne¼u/3m¼(73
104)/(1.23 108)¼5.8 3 104, and for M. musculus,
Ne¼(33104)/(1.23108)¼2.53104. To the extent
TABLE 1
Sampling localities or origins of house mouse DNA samples
Species Locality or strain N
M. domesticus Mainland Italy 34
Sicily (Italy) 11
Spain 13
Greece 6
M. musculus Czech Republic 19
Serbia 2
Denmark 2
Austria 3
M. spretus Spain 1
M. caroli Thailand 1
Classical inbred strains 129S1/SvImJ 1
A/J 1
AKR/J 1
BALB/cByJ 1
C3H/HeJ 1
DBA/2J 1
FVB/NJ 1
SJL/J 1
All classical inbred strain DNA and samples ofM. spretus
and M. caroli were ordered from the Jackson Labs in Bar
Figure
2.—Neighbor-joining trees based on un-corrected distance matrices,
rooted with M. spretus for
five X-linked loci sequenced
here. Circles represent
haplotypes at each terminal node, with circle size pro-portional to the number of chromosomes and colors designating sample
identi-ties. Blue,M. domesticus; red,
M. musculus; yellow, classical inbred strain. Numbers ad-jacent to branches indicate
bootstrap values .50 (500
that selection has reduced levels of variation on the X
chromosome (Baines and Harr 2007), these will be
underestimates.
Levels of divergence with respect to M. caroli were
consistently3% (Table 2), similar to previous
obser-vations (Sheet al. 1990). Average divergence between
M. musculusorM. domesticusandM. spretus(1%) was
also consistent with previous estimates (Nachman1997).
The average pairwise divergence (k) between alleles from
M. musculusand alleles fromM. domesticuswas 0.43%. We can use this value to estimate the time of separation
of these species. Under a neutral model,k¼2mt13Nem
for X-linked loci, wheremis the neutral mutation rate,
tis the species divergence time in generations, andNe
is the effective population size of the ancestral
popula-tion. We can estimate the ancestral value of 3Nemas the
average of current nucleotide diversity inM. musculus
and M. domesticus ½p ¼ 3Nem ¼ (0.0003 1 0.0007)/
2¼0.0005. Assuming a neutral mutation rate of 43
109(Waterstonet al.2002), this leads to an estimate of t¼(k3Nem)/2m¼(0.00430.0005)/(83109)¼
475,000 generations. Although mice in captivity pro-duce several generations per year, mice in the wild often breed seasonally and may produce only one or two gen-erations per year. This suggests that these species di-verged on the order of 237,500–475,000 years ago. This is a very rough estimate but is consistent with a previous estimate of 350,000 years based on DNA–DNA
hybrid-ization data (Sheet al.1990).
We examined patterns of linkage disequilibrium (LD) both within and between genes. Within genes, we found no evidence for recombination: we never observed all four gametic types in pairwise comparisons between sites within a gene (Hudson’s minimum number of
recombi-nation events,Rm, was 0 for each gene). Our sequences
span 4–5 kb for each gene, suggesting that LD extends over distances greater than this for X-linked loci, similar
to patterns seen for many X-linked loci in humans (e.g.,
Hammeret al.2004). Between genes we found no LD. Of 4950 pairwise comparisons between all sites in our data set, 372 were found to be in significant LD using a Fisher’s exact test (FET). However, after a Bonferroni correction for multiple tests, only 86 of these values were significant, and all of those described intralocus pairs of sites.
We also considered the relationship among
haplo-types (Figure 2). WithinM. domesticus, there was
gen-erally a single common haplotype and several rare haplotypes, often separated by one or a few mutational steps from the most common haplotype. One exception
was Maoa, where several intermediate-frequency
hap-lotypes were observed within M. domesticus. Within
M. musculus, the pattern varied among loci, with some
showing a single common haplotype (Msn) and others
showing more intermediate-frequency haplotypes (Amelx,
Maoa). Reciprocal monophyly between M. domesticus
andM. musculuswas unambiguously observed atMaoa, Dach2, andMsn(Figure 2). AtAmelx, we observed two
divergent lineages corresponding to M. musculus and
M. domesticus, with one exception. A singleM. musculus
haplotype was identical to the most commonM. domesticus
haplotype over its entire 4-kb length, including all in-sertion/deletion (indel) variants, a microsatellite locus, and all nucleotide sites. Hybridization is known to occur between these two species not far from the sampling
locality at which this mouse was trapped (Munclinger
et al.2002). Given the geographic origin of this mouse
and itsAmelx haplotype that is identical to haplotypes
otherwise seen only in M. domesticus, this allele may
represent recent introgression from M. domesticusinto
M. musculus. Excluding this individual, the haplotype
network at Amelx is consistent with reciprocal
mono-phyly. At Dmd, the haplotype network is unresolved,
as the root (M. spretus) falls at a trichotomy, with one
branch leading to all M. musculus haplotypes and two
branches each leading toM. domesticushaplotypes. This
pattern is not inconsistent with reciprocal monophyly between the species, but additional data are needed to resolve this trichotomy.
We performed several statistical tests of neutrality
within M. domesticus and within M. musculus. First we
performed tests based on the distribution of allele
frequencies, including Tajima’s D (Tajima 1989), Fu
and Li’sD(Fuand Li1993), and Fay and Wu’sH(Fay
and Wu2000). InM. domesticus, we generally observed
negative values of Tajima’s D and Fu and Li’sD,
con-sistent with an excess of rare polymorphisms, although most of these values were not significant and no locus
showed significant values for all tests (Table 2). InM.
musculus, both positive and negative values for Tajima’s
D and Fu and Li’s D were observed, and none was
significant. We also calculated Tajima’sDfor short and
long indels withinM. domesticusand withinM. musculus,
summed across loci. None of these values was significant
(P.0.05 for each). Second, we compared the ratio of
polymorphism to divergence across multiple loci using
the HKA test (Hudsonet al.1987). This test was applied
in a pairwise manner and for all five loci simultaneously,
usingM. carolias the outgroup. Neither the pairwise tests
(Table 2) nor the multilocus test (sum of deviations¼
6.389) rejected a neutral model.
Mice are known to live in highly structured demes at
the local level (e.g., Delong1967), but large-scale
geo-graphic structure was less evident when mapped onto a
haplotype network forM. domesticus(supplemental
Fig-ure 4 at http://www.genetics.org/supplemental/). All geographic regions included the most common
haplo-type and several rare haplohaplo-types. We calculatedFSTto
as-sess the degree of population subdivision inM. domesticus.
Values of FSTobtained for each gene in comparisons
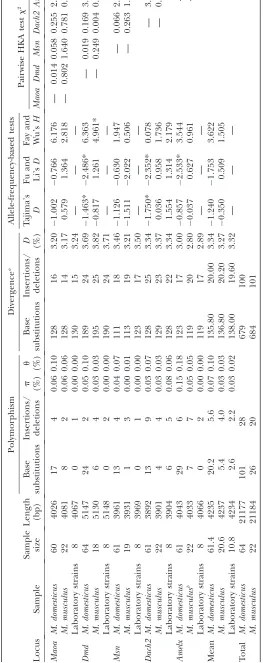
among major geographic regions ranged from 0 to 0.5, with a mean value of 0.189 (Table 3). Some comparisons revealed significant structure. For example, the average
FSTvalue atMaoawas 0.312 and comparisons between
significant. An AMOVA analysis was carried out for a
concatenated data set within M. domesticus. Consistent
with a lack of strong population structure on a conti-nental scale (across Western Europe), the greatest proportion of variation was found within populations (99.15%). Almost none of the variation was due to differences among regions (0.05%). In this multilocus
analysis, FSTwas low and marginally significant (0.09,
P¼0.06). BothfCTandfSC, measures of differentiation
among populations and among regions, respectively,
were low and nonsignificant (0.008, P ¼ 0.09 and
0.0006,P¼0.95, respectively).
Levels of variation and gene genealogies for 11 X-linked and 18 autosomal loci:We compared levels of variation at the five X-linked loci that we resequenced to levels of variation at six X-linked loci previously
pub-lished (Table 4). Meanpwas slightly higher for the six
loci in Bainesand Harr(2007) than for the five loci
sequenced here, both within M. domesticus (0.10% vs.
0.07%) and withinM. musculus(0.07%vs. 0.03%). These
differences might be due to sampling differences or
stochastic variation in levels ofpamong loci. The mean
length of the five loci sequenced here was 4234 bp while
the mean length of the six loci in Bainesand Harr
(2007) was 523 bp. We also compared the number of polymorphisms and fixed differences among the five X-linked loci that we resequenced and the six loci in Bainesand Harr(2007), and we found no significant
differences (FET,P¼0.869). These data sets are
there-fore pooled in the analyses below. The average level
of nucleotide variability on the X chromosome (p ¼
0.08%) was considerably lower than on the autosomes
(p ¼0.26%), as previously noted (Baines and Harr
2007).
Neighbor-joining trees for the 11 X-linked and 18 autosomal loci are shown in Figures 2 and 3, and the numbers of fixed differences, shared polymorphisms, and exclusive polymorphisms are given in Table 4. All three kinds of genealogies that are depicted in Figure 1 can be seen among these 29 loci (Figures 2 and 3). Some
loci showed reciprocal monophyly betweenM. musculus
and M. domesticus(e.g.,Bnc1), while others were
para-phyletic (e.g.,Melk) or polyphyletic (e.g.,Nkd1). Some
gene genealogies are unresolved due to an absence of informative sites, especially on the X chromosome, con-sistent with its low level of variation. Nonetheless, there are some interesting differences between the X chromo-some and the autochromo-somes. Excluding unresolved gene-alogies, the X chromosome included five monophyletic, no paraphyletic, and no polyphyletic gene genealogies, while the autosomes included nine monophyletic, three paraphyletic, and two polyphyletic gene genealogies. Thus, there was unambiguous evidence for paraphyly and polyphyly only at autosomal loci. Similarly, the proportion of fixed differences was greater on the X
chromosome (69/212¼33%) than on the autosomes
(57/271 ¼ 21%; Table 4). We compared the number
of fixed differences, shared polymorphisms,
polymor-phisms within M. musculus, and polymorphisms within
M. domesticuson the X chromosome (the counts in each category, respectively, are 69, 0, 35, and 108) and on the autosomes (57, 6, 71, and 137; Table 4). We used a
Monte Carlo procedure (Lewontinand Felsenstein
1965) to ask whether the counts are significantly differ-ent between the X chromosome and the autosomes in
this 2 3 4 contingency table. We generated 100,000
random tables with marginal sums equal to the observed data, using a program kindly provided by Bill Engels, and found that the observed table is highly unlikely
(P¼0.0005). Similarly, the ratio of fixed differences to
total polymorphisms was greater on the X (69:143) than
on the autosomes (57:214; FET,P¼0.004). Thus, both
the gene genealogies and the distribution of polymor-phic and fixed nucleotide sites support the notion that the X chromosome is more differentiated than the
auto-somes betweenM. musculusandM. domesticus.
To further investigate the differentiation of the X chromosome compared to the autosomes, we analyzed data from the Wellcome Trust Center for Human Genetics
in which8500 SNPs were typed in seven wild-derived
M. domesticusand eight wild-derivedM. musculus(http:// gscan.well.ox.ac.uk/gs/strains.cgi). Perl scripts were written to parse X-linked and autosomal variation. On the autosomes, we observed roughly equal numbers of fixed differences and shared polymorphisms, while on the X chromosome there were 112 fixed differences but only one shared polymorphism (Table 5). The relatively greater differentiation of the X chromosome in the
TABLE 3
PairwiseFSTvalues among groups ofM. domesticus
Locus Locality
Mainland
Italy Greece
Sicily
(Italy) Average
Maoa Mainland Italy — 0.312
Greece 0.214** —
Sicily (Italy) 0.170** 0.504** —
Spain 0.346** 0.465** 0.175**
Dmd Mainland Italy — 0.119
Greece 0.044 —
Sicily (Italy) 0.288** 0.149 —
Spain 0.166** 0.064 0.000
Dach2 Mainland Italy — 0.151
Greece 0.226* —
Sicily (Italy) 0.000 0.207* —
Spain 0.158** 0.228 0.088
Msn Mainland Italy — 0.249
Greece 0.000 —
Sicily (Italy) 0.000 0.000 —
Spain 0.448** 0.520** 0.525**
Amelx Mainland Italy — 0.113
Greece 0.165 —
Sicily (Italy) 0.000 0.135 —
Spain 0.122 0.179 0.076
T ABLE 4 Levels of variation and numbers of fixed dif ferences and polymorphisms for 11 X-linked and 18 autosomal loci in M. musculus and M. domesticus N p (%) V ariable sites by categor y Locus Chromosome musculus domesticus Length (bp) musculus domesticus T
otal aS
Wellcome Trust data compared to the data shown in Table 4 may reflect bias in the ascertainment of SNPs in
the Wellcome Trust data (Boursotand Belkhir2006;
Harr2006a,b).
Amount of wild variation captured by classical inbred strains:The haplotypes seen in the nine classical inbred
strains are shown in Figures 2 and 3. The number and origin of SNPs found among inbred strains for the 29 loci surveyed here are given in Table 6. These nine classical inbred strains capture only a small proportion of the variation seen in nature. For example, the strains were invariant at 12 of the 29 loci. Similarly, the inbred Figure3.—Neighbor-joining trees based on uncorrected distance matrices, rooted withM. spretus(except as noted), and based
on data from Harr (2006a), Bainesand Harr (2007), and nine classical inbred strains sequenced in this study (Top row)
X-linked loci. (Other rows) Autosomal loci. Circles represent haplotypes at each terminal node, with circle size proportional
to the number of chromosomes and colors designating sample identities. Blue,M. domesticus; red,M. musculus; yellow, classical
inbred strain. Numbers adjacent to branches indicate bootstrap values.50 (500 replicates).
TABLE 5
Fixed differences and polymorphisms among 15 wild-derived inbred strains from the Wellcome Trust database
Fixed differences
Shared polymorphisms
Polymorphisms within M. domesticus
Polymorphisms within M. musculus
Autosomes 929 989 5753 561
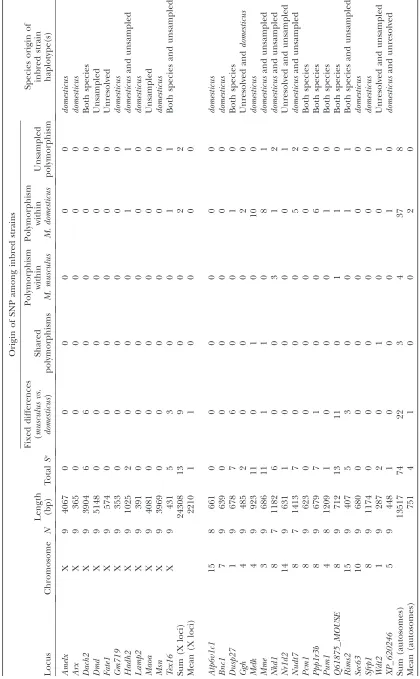
strains contained only 87 SNPs (Table 6), compared to 483 SNPs among wild mice at these same loci (Table 4). There are notable differences between the X chro-mosome and the autosomes in the levels of variation captured in the inbred strains. The inbred strains were
invariant at 8/11¼73% of loci on the X chromosome
and 4/18¼22% of loci on the autosomes, a difference
that was significant (FET,P ¼ 0.02). This can also be
seen in the number of SNPs on the X chromosome and on the autosomes; the inbred strains contained 6.1% of the SNPs present in the wild on the X chromosome and 26.6% of the SNPs present in the wild on the autosomes, a difference that was also significant (Table 7). Not only did the X chromosome contain less variation than the autosomes, but also the origin of the SNP variation on the X chromosome was different from the autosomes. The ratio of fixed differences to polymorphisms on the X (9/4) was significantly greater than on the autosomes (22/52; Table 7). In other words, much of the SNP variation among inbred strains on the X chromosome corresponds to differences between species, while most of the SNP variation among inbred strains on the auto-somes corresponds to differences within species. It is important to bear in mind that this conclusion derives from consideration of only 29 loci in nine strains; se-quencing of additional loci in samples of wild and laboratory mice will be needed to fully describe the ori-gin of genetic variation among lab mice.
Our data allowed us to identify the species origin of individual haplotypes among inbred strains. We sur-veyed nine strains at 29 loci, representing 261 gene cop-ies (supplemental Table 2 at http://www.genetics.org/ supplemental/). Of these, 16.5% were of uncertain ori-gin, usually because the corresponding haplotype was
shared betweenM. musculusandM. domesticus, 5.4% were
ofM. musculusorigin, and 75.1% were ofM. domesticus ori-gin. Thus, for these 29 loci, these inbred strains are
pre-dominantly ofM. domesticusorigin, consistent with other
recent studies (Frazeret al. 2007; Yanget al.2007).
Comparisons to MPD: We were interested in asking more generally how SNP variation in our wild sample compares to SNP variation in existing databases, includ-ing all laboratory strains (both classical and wild de-rived). This is important since these laboratory strains represent the existing tools for most current mapping
efforts. We were interested in asking two questions: (1) How many of the SNPs in existing databases were found in our survey of wild mice? and (2) How many of the SNPs in our sample of wild mice were found in existing databases? The MPD is the central repository for SNPs among all laboratory strains of mice. A total of 117 SNPs were found in MPD for the regions that we sequenced, and 107 of these were observed in wild mice (supplemen-tal Table 3 at http://www.genetics.org/supplemen(supplemen-tal/). Thus, nearly all of the SNPs known from laboratory strains were captured in these wild samples. A total of 483 SNPs were identified in the samples of wild mice and 107 of these (22%) were found in MPD. Thus, wild mice provide a large reservoir of additional genetic variation not currently captured in laboratory strains.
DISCUSSION
We studied DNA sequence variation at 11 X-linked and 18 autosomal loci in wild and inbred mice. We draw four main conclusions:
1. Levels of genetic variation in wild mice are generally low, although slightly higher than in humans.
Effec-tive population sizes for mice are on the order of 105.
2. M. musculusandM. domesticusdiverged recently, and many gene genealogies are reciprocally monophy-letic between these species, while others are para-phyletic or polypara-phyletic. In general, the X chromosome is more differentiated than the autosomes.
3. Nine commonly used inbred strains contain only a small amount of the genetic variation seen in wild mice. The X chromosome contains proportionately less variation among inbred strains than do the auto-somes. SNP variation on both the X chromosome and the autosomes derives from differences between species as well as differences within species, although the proportion of SNPs deriving from interspecific variation was greater on the X than on the autosomes for the genes that we surveyed.
4. Public SNP databases for the mouse, which include variants from all inbred strains, still contain only a small fraction of the SNPs seen in wild mice.
Below we discuss each of these conclusions in turn.
TABLE 7
Comparison between the autosomes and the X chromosome for inbred strain SNPs
Chromosome
No. of SNPs in wild mice
No. of SNPs in inbred strains
% variation captured by inbred strains
Fixed differences between species
Polymorphisms within species
Autosomes 271 74 27.3 22 52
X 212 13 6.1 9 4
Inbred strains contain significantly fewer SNPs on the X chromosome than on the autosomes compared to
wild mice (FET,P,106). Inbred strains contain significantly more fixed differences on the X chromosome
Levels and patterns of genetic variation in wild mice: We resequenced five X-linked loci and found generally low levels of nucleotide variation and little geographic structure on a continental scale. Previous studies of ge-netic variation in natural populations of house mice
have included work on allozymes (e.g., Selanderet al.
1969a,b; Huntand Selander1973; Britton-Davidian
et al.1989), mtDNA (e.g., Nachmanet al.1994; Prager
et al.1996; Tryfonopouloset al.2005), MHC alleles (e.g.,
Ardenand Klein1982; Pottset al.1991),t-haplotypes
(e.g., Ardlieand Silver 1998; Dod et al.2003),
chro-mosomal polymorphisms (e.g., Pialek et al.2005),
mi-crosatellites (e.g., Ihleet al.2006), and DNA sequence
variation at nuclear genes (e.g., Nachmanand Aquadro
1994; Nachman1997; Karnand Nachman1999; Harr
2006a; Ihleet al. 2006; Bainesand Harr2007). Our
results are concordant with some of these earlier studies in several respects. First, the average level of nucleotide diversity reported here for introns of five X-linked genes inM. domesticus (p ¼0.07%) matches very nearly the value previously reported for 6022 bp of X-linked intron
sequence from a sample of 10M. domesticus(p¼0.08%;
Nachman1997) and 6 X-linked genes in six to eight
mice from across the range ofM. domesticus(p¼0.10%;
Baines and Harr 2007). Second, studies of mtDNA and nuclear genes documented higher levels of genetic
variation inM. domesticusthan inM. musculus(Prager
et al.1996; Bainesand Harr2007), and this is corrob-orated by each of the five X-linked loci that we studied.
Third, studies of allozymes (Britton-Davidian et al.
1989), mtDNA (Nachmanet al.1994), and nuclear DNA
(Baines and Harr 2007) found relatively little
geo-graphic structure across Western Europe inM. domesticus,
comparable to our findings. The lack of strong
geo-graphic structure forM. domesticusis consistent with an
archaeological record indicating that this species ex-panded its range into Western Europe from the Fertile
Crescent within the past 10,000 years (Auffray et al.
1990; Cucchiet al.2005). The generally negative values
of Tajima’sD and Fu and Li’s Dsuggest a population
expansion, and this may have accompanied the known range expansion.
The observed levels of variation at X-linked loci suggest a long-term effective population size for mice
of 58,000 forM. domesticusand 25,000 forM. musculus.
As pointed out by Bainesand Harr(2007), however,
levels of variation on the X chromosome may be re-duced by selection, relative to levels of variation on the autosomes. The average level of nucleotide variation on
the autosomes (Baines and Harr 2007) suggests an
effective population size of 160,000 forM. domesticusand
100,000 for M. musculus ½M. domesticus: Ne ¼ u/4m ¼
(2.6 3 103)/(1.6 3 108)¼ 1.6 3 105; M. musculus,
Ne¼ (1.6 3 103)/(1.6 3 108)¼ 105. Given
uncer-tainties in the estimates of mutation rate, these values should be taken as rough approximations; however, it
seems that M. domesticushas a long-term species-wide
Neon the order of 105.
This study allows us to compare patterns of DNA sequence variation in mice to patterns seen in humans, the only other mammalian species for which extensive population samples of DNA sequence variation have been obtained. Levels of variation on the X chromo-some in mice are nearly identical to levels of nucleotide
diversity at X-linked introns in humans (p ¼ 0.07%;
Hammeret al. 2004), although levels of variation on the autosomes appear to be roughly twice as high in mice
(p¼0.26%: Table 4) as in humans (p¼0.11%; Liand
Sadler1991; Aquadroet al.2001). Similarly negative
values of Tajima’sDare seen in non-African populations
of humans and in European populations of mice at
X-linked loci (Hammeret al.2004), probably consistent
with population expansions associated with range ex-pansions in both species. Levels of intralocus LD are
also similarly high in both species (e.g., Hammeret al.
2004). Recombination rates in mice (0.5 cM/Mb; Shifmanet al.2006) are roughly half as high as in
hu-mans (1 cM/Mb; Konget al.2002); however, the larger
population size of mice suggests that the population
recombination rate (i.e., 4Nec) may be roughly similar in
both species. Recent work has shown that the decay of LD occurs over similar genomic distances in mice and
humans (Laurieet al.2007). The similarities between
mice and humans suggest that wild mice will provide a useful comparison to humans for understanding the forces governing genetic variation in nature. In addi-tion, wild mice might serve as useful models for genetic association studies.
Divergence between M. musculus and M. domesticus:
Our results suggest thatM. musculusandM. domesticus
diverged,500,000, or5Ne, generations ago. The
aver-age coalescence time for all alleles in a neutral
geneal-ogy is 4Ne generations; however, the variance in the
coalescent process is large, and even after 5Ne
gener-ations, reciprocal monophyly is not expected for all loci
between diverging taxa (Tajima1983). Consistent with
these theoretical expectations, we observed all three pat-terns in Figure 1 in our data (Figures 2 and 3).
None-theless, 14/19¼74% of all unambiguous genealogies
were reciprocally monophyletic between M. domesticus
andM. musculus. These data highlight the fact that these groups are genetically well differentiated.
the Wellcome Trust data (Table 5), although these SNPs were ascertained in classical inbred strains and then typed in wild-derived inbreds and thus may contain
some bias (Harr2006a,b; Boursotand Belkhir2006).
The greater differentiation of the X chromosome compared to the autosomes may be due to several fac-tors. One is the difference in effective population size.
The average coalescence time for all alleles is 3Ne
gen-erations for the X chromosome and 4Ne generations
for autosomes, and thus the X is expected to achieve reciprocal monophyly more quickly. Another possible explanation comes from levels of gene flow across the musculus–domesticus hybrid zone. A number of studies have documented reduced introgression of the X
chro-mosome compared to the autosomes (Tucker et al.
1992; Dod et al.1993; Prager et al.1997), and
repro-ductive incompatibilities map to the X chromosome (Okaet al.2004; Storchovaet al.2004). Third, if posi-tive selection is more frequent on the X chromosome
than on the autosomes (e.g., Charlesworthet al.1987),
then the X chromosome would be expected to exhibit shallower gene genealogies and reciprocal monophyly more often than the autosomes. Finally, it is possible that additional sampling will uncover X-linked genes with shared polymorphism.
Amount and pattern of genetic variation among in-bred strains:This study is the first to compare variation at multiple loci in the classical inbred strains of mice to variation in large samples of wild mice. Three important patterns emerge.
First, the inbred strains of mice capture a small percentage of the variation seen in nature. The inbred strains were invariant at 41% of the loci surveyed (12/ 29) and contained 85 SNPs compared to 483 in wild mice. The lack of variation among inbred strains has im-portant implications for their use in identifying genes underlying traits of interest. There are good mouse
mod-els for many complex diseases (Peterset al. 2007). If
laboratory strains are used to identify the genetic archi-tecture of disease phenotypes and if laboratory strains contain a small fraction of the variation seen in nature, then some genes of importance may go undetected. For example, the recent ‘‘collaborative cross’’ uses a set of eight inbred lines that will be intercrossed and then used to produce a set of 1000 recombinant inbred
lines (Churchillet al.2004). This panel will provide a
powerful tool for mapping genes to1 cM resolution.
The total amount of variation present in this panel, however, is limited by the variation present in the initial founders. It is important to recognize that inbred strains of mice may contain a sufficient number of SNPs to ‘‘tag’’ nearly every gene in the genome. However, the reduction in variation in lab strains compared to wild mice is likely to have excluded many functionally im-portant alleles, especially if they were rare in the wild. Wild mice could provide an additional source of
func-tional genetic variation for mapping efforts. Yanget al.
(2007) note that the genomes of laboratory mice con-tain large regions of extremely low diversity and that these represent ‘‘blind spots’’ for the study of complex traits. Our results suggest that wild mice could fill in these genetic blind spots.
Second, despite the overall low level of variation seen among inbred strains, there is significantly less variation on the X compared to autosomes, and this difference is greater than expected on the basis of levels of variation seen in the wild (Table 7). Thus, X chromosome varia-tion is underrepresented in lab strains of mice. This could be caused by a small ratio of females to males in
the founding of inbred strains (Ferris et al. 1982).
Another possibility is that the X chromosome contained a large number of incompatibilities in the crosses that were used to establish lab strains, resulting in selection against many X-linked alleles. The fact that hybrid male
sterility maps to the X chromosome (Oka et al. 2004;
Storchovaet al.2004) is consistent with this view. Third, among inbred strains, most of the SNPs on the X derive from differences between species, while most of the SNPs on the autosomes derive from differences within species at the genes that we surveyed (Table 7). The genes contributing to fixed differences on the X in
our study, Tex16 and Dach2, lie in a large region also
identified by Yanget al.(2007) as deriving from
differ-ent species (on the basis of a single inbred mouse from each species). However, for both the X and the auto-somes, a nontrivial proportion of SNPs derive from fixed differences between species. Such species-specific alleles have not been tested by natural selection in combination with species-specific alleles at other loci,
and this may give rise to epistatic incompatibilities (e.g.,
Payseur and Hoekstra 2005). The extent to which such interactions underlie phenotypes of interest in
mouse models is unknown, but it is clear that suchtrans
-species polymorphisms do not serve as an accurate model for most human genetic variation.
SNP databases include a small fraction of the varia-tion in nature: MPD includes a database of all mouse SNPs compiled from many sources. The database
con-tains.10 million SNPs representing.100 classical and
wild-derived inbred strains of mice. It is not compre-hensive in the sense that not all strains have been sequenced for all genomic regions, but it probably con-tains a large fraction of all SNPs among all strains since it
includes the .8 million Perlegen SNPs derived from
resequencing the genomes of 15 major inbred strains (Frazeret al. 2007). The Perlegen data are based on
oligonucleotide arrays that cover 58% of the
wild mice (supplemental Table 3 at http://www.genetics. org/supplemental/). This underrepresentation of var-iation supports the conclusion that studying even a diverse collection of inbred strains of mice may miss im-portant alleles underlying complex traits. Fixed
differ-ences betweenM. domesticusandM. musculusconstitute
a large proportion of the SNPs in MPD at these 29 loci (supplemental Table 3) on both the X (62%) and the au-tosomes (40%), which further suggests that the genetic architecture of traits mapped using these strains may not correspond to the architecture of the same traits in hu-man populations.
P. Basset, M. D. Dean, J. M. Good, E. Kelleher, L. Kent, M. Sans-Fuentes, M. A. Saunders, and G. Wlasiuk provided useful discussion and suggestions. We also thank D. J. Begun and three anonymous reviewers for helpful comments on the manuscript, J. G. Krenz and M. A. D’Urso for technical assistance, and M. D. Dean and M. Carneiro for computational assistance. T.S. was supported by a fellowship from the National Science Foundation (NSF) Integrative Graduate Educa-tion and Research Traineeship Program in EvoluEduca-tionary, FuncEduca-tional and Computational Genomics at the University of Arizona. A.G. was supported by a fellowship from the Fundacao para a Ciencia e a Tecnologia (SFRH/BPD/24743/2005). This work was supported by NSF and National Institutes of Health grants to M.W.N.
LITERATURE CITED
Aquadro, C. F., V. B. DuMontand F. A. Reed, 2001 Genome-wide variation in the human and fruitfly: a comparison. Curr. Opin. Genet. Dev.11:627–634.
Arden, B., and J. Klein, 1982 Biochemical comparison of major his-tocompatibility complex molecules from different subspecies of Mus musculus: evidence for trans-specific evolution of alleles. Proc. Natl. Acad. Sci. USA79:2342–2346.
Ardlie, K. G., and L. M. Silver, 1998 Low frequency ofthaplotypes in natural populations of house mice (Mus musculus domesticus). Evolution52:1185–1196.
Auffray, J. C., F. Vanlerbergheand J. Britton-Davidian, 1990 The house mouse progression in Eurasia: a paleontological and ar-chaeozoological approach. Biol. J. Linn. Soc.41:13–25. Avise, J. C., 1994 Molecular Markers, Natural History, and Evolution.
Chapman & Hall, New York.
Baines, J. F., and B. Harr, 2007 Reduced X-linked diversity in de-rived populations of house mice. Genetics175:1911–1921. Boursot, P., and K. Belkhir, 2006 Mouse SNPs for evolutionary
biology: beware of ascertainment biases. Genome Res. 16: 1191–1192.
Boursot, P., W. Din, R. Anand, D. Darviche, B. Dod et al., 1996 Origin and radiation of the house mouse: mitochondrial DNA phylogeny. J. Evol. Biol.9:391–415.
Braverman, J. M., R. R. Hudson, N. L. Kaplan, C. H. Langleyand W. Stephan, 1995 The hitchhiking effect on the site frequency spectrum of DNA polymorphisms. Genetics140:783–796. Britton-Davidian, J., J. H. Nadeau, H. Croset and L. Thaler,
1989 Genic differentiation and origin of Robertsonian popula-tions of the house mouse (Mus musculus domesticusRutty). Genet. Res.53:29–44.
Britton-Davidian, J., F. Fel-Clair, J. Lopez, P. Alibertand P. Boursot, 2005 Postzygotic isolation between the two European subspecies of the house mouse: estimates from fertility patterns in wild and laboratory-bred hybrids. Biol. J. Linn. Soc.84:379–393. Charlesworth, B., J. A. Coyne and N. H. Barton, 1987 The
relative rates of evolution of sex-chromosomes and autosomes. Am. Nat.130:113–146.
Churchill, G., D. C. Airey, H. Allayee, J. M. Angel, A. D. Attie et al., 2004 The Collaborative Cross, a community resource for the genetic analysis of complex traits. Nat. Genet.36:1133–1137. Cucchi, T., J. D. Vigneand J. C. Auffray, 2005 First occurrence of the house mouse (Mus musculus domesticusSchwarz & Schwarz,
1943) in the Western Mediterranean: a zooarchaeological revi-sion of subfossil occurrences. Biol. J. Linn. Soc.84:429–445. Delong, K. T., 1967 Population ecology of feral house mice.
Ecol-ogy48:611.
Dod, B., L. S. Jermiin, P. Boursot, V. H. Chapman, J. T. Nielsenet al., 1993 Counterselection on sex-chromosomes in theMus muscu-lusEuropean hybrid zone. J. Evol. Biol.6:529–546.
Dod, B., C. Litel, P. Makoundou, A. Orth and P. Boursot, 2003 Identification and characterization oft haplotypes in wild mice populations using molecular markers. Genet. Res.81:103– 114.
Fay, J. C., and C. I. Wu, 2000 Hitchhiking under positive Darwinian selection. Genetics155:1405–1413.
Ferris, S. D., R. D. Sageand A. C. Wilson, 1982 Evidence from mtDNA sequences that common laboratory strains of inbred mice are descended from a single female. Nature295:163–165. Frazer, K. A., C. M. Wade, D. A. Hinds, N. Patil, D. R. Coxet al., 2004 Segmental phylogenetic relationships of inbred mouse strains revealed by fine-scale analysis of sequence variation across 4.6 Mb of mouse genome. Genome Res.14:1493–1500. Frazer, K. A., E. Eskin, H. M. Kang, M. A. Bogue, D. A. Hindset al.,
2007 A sequence-based variation map of 8.27 million SNPs in inbred mouse strains. Nature448:1050–1053.
Fu, Y. X., and W. H. Li, 1993 Statistical tests of neutrality of muta-tions. Genetics133:693–709.
Grimm, D., 2006 A mouse for every gene. Science312:1862–1866. Hammer, M. F., D. Garrigan, E. Wood, J. A. Wilder, Z. Mobasher et al., 2004 Heterogeneous patterns of variation among multi-ple human X-linked loci: the possible role of diversity-reducing selection in non-Africans. Genetics167:1841–1853.
Harr, B., 2006a Genomic islands of differentiation between house mouse subspecies. Genome Res.16:730–737.
Harr, B., 2006b Regions of high differentiation—worth a check. Genome Res.16:1193–1194.
Hudson, R. R., and N. L. Kaplan, 1985 Statistical properties of the number of recombination events in the history of a sample of DNA sequences. Genetics111:147–164.
Hudson, R. R., M. Kreitmanand M. Aguade, 1987 A test of neutral molecular evolution based on nucleotide data. Genetics 116: 153–159.
Hunt, W. G., and R. K. Selander, 1973 Biochemical genetics of hybridization in European house mice. Heredity31:11–33. Ideraabdullah, F. Y., E. de la Casa-Esperon, T. A. Bell,
D. A. Detwiler, T. Magnusonet al., 2004 Genetic and haplo-type diversity among wild-derived mouse inbred strains. Genome Res.14:1880–1887.
Ihle, S., I. Ravaoarimanana, M. Thomasand D. Tautz, 2006 An analysis of signatures of selective sweeps in natural populations of the house mouse. Mol. Biol. Evol.23:790–797.
Karn, R. C., and M. W. Nachman, 1999 Reduced nucleotide vari-ability at an androgen-binding protein locus (Abpa) in house mice: evidence for positive natural selection. Mol. Biol. Evol.16: 1192–1197.
Kong, A., D. F. Gudbjartsson, J. Sainz, G. M. Jonsdottir, S. A. Gudjonssonet al., 2002 A high-resolution recombination map of the human genome. Nat. Genet.31:241–247.
Laurie, C. C., D. A. Nickerson, A. D. Anderson, B. S. Weir, R. J. Livingstonet al., 2007 Linkage disequilibrium in wild mice. PLoS Genet.3:e144.
Lemon, W. J., C. H. Swinton, M. Wang, N. Berbari, Y. Wanget al., 2003 Single nucleotide polymorphism (SNP) analysis of mouse pulmonary adenoma susceptibility loci 1–4 for identification of candidate genes. J. Med. Genet.40:e36.
Lewontin, R. C., and J. Felsenstein, 1965 Robustness of homoge-neity tests in 2xn tables. Biometrics21:19.
Li, W.-H., and L. A. Sadler, 1991 Low nucleotide diversity in man. Genetics129:513–523.
Lindblad-Toh, K., E. Winchester, M. J. Daly, D. G. Wang, J. N. Hirschhornet al., 2000 Large-scale discovery and genotyping of single-nucleotide polymorphisms in the mouse. Nat. Genet. 24:381–386.
Nachman, M. W., 1997 Patterns of DNA variability at X-linked loci inMus domesticus.Genetics147:1303–1316.
Nachman, M. W., and C. F. Aquadro, 1994 Polymorphism and di-vergence at the 59flanking region of the sex-determining locus, Sry, in mice. Mol. Biol. Evol.11:539–547.
Nachman, M. W., S. N. Boyer, J. B. Searle and C. F. Aquadro, 1994 Mitochondrial DNA variation and the evolution of Robertsonian chromosomal races of house mice,Mus domesticus. Genetics136:1105–1120.
Oka, A., A. Mita, N. Sakurai-Yamatani, H. Yamamoto, N. Takagi et al., 2004 Hybrid breakdown caused by substitution of the X chromosome between two mouse subspecies. Genetics 166: 913–924.
Paigen, K., 2003a One hundred years of mouse genetics: an intellec-tual history. I. The classical period (1902–1980). Genetics163:1–7. Paigen, K., 2003b One hundred years of mouse genetics: an intel-lectual history. II. The molecular revolution (1981–2002). Genetics 163:1227–1235.
Payseur, B. A., and H. E. Hoekstra, 2005 Signatures of reproduc-tive isolation in patterns of single nucleotide diversity across inbred strains of mice. Genetics171:1905–1916.
Peters, L. L., R. F. Robledo, C. J. Bult, G. A. Churchill, B. J. Paigen et al., 2007 The mouse as a model for human biology: a resource guide for complex trait analysis. Nat. Rev. Genet.8:58–69. Petkov, P. M., Y. M. Ding, M. A. Cassell, W. D. Zhang, G. Wagner
et al., 2004 An efficient SNP system for mouse genome scann-ing and elucidatscann-ing strain relationships. Genome Res. 14: 1806–1811.
Petkov, P. M., J. H. Graber, G. A. Churchill, K. DiPetrillo, B. L. Kinget al., 2005 Evidence of a large-scale functional organiza-tion of mammalian chromosomes. PLoS Genet.1:312–322. Pialek, J., H. C. Hauffeand J. B. Searle, 2005 Chromosomal
var-iation in the house mouse. Biol. J. Linn. Soc.84:535–563. Pletcher, M. T., P. McClurg, S. Batalov, A. I. Su, S. W. Barneset al.,
2004 Use of a dense single nucleotide polymorphism map for in silico mapping in the mouse. PLoS Biol.2:2159–2169. Potts, W. K., C. J. Manning and E. K. Wakeland, 1991 Mating
patterns in seminatural populations of mice influenced by MHC genotype. Nature352:619–621.
Prager, E. M., H. Tichyand R. D. Sage, 1996 Mitochondrial DNA sequence variation in the eastern house mouse,Mus musculus: comparison with other house mice and report of a 75-bp tandem repeat. Genetics143:427–446.
Prager, E. M., P. Boursotand R. D. Sage, 1997 New assays for Y chromosome and p53 pseudogene clines among East Holstein house mice. Mamm. Genome8:279–281.
Przeworski, M., 2002 The signature of positive selection at ran-domly chosen loci. Genetics160:1179–1189.
Rozas, J., and R. Rozas, 1999 DnaSP version 3: an integrated pro-gram for molecular population genetics and molecular evolution analysis. Bioinformatics15:174–175.
Rozen, S., and H. J. Skaletsky, 2000 Primer3 on the WWW for general users and for biologist programmers, pp. 365–386 inBioinformatics Methods and Protocols: Methods in Molecular Biology, edited by S. Misener and S. A. Krawetz. Humana. Press, Totowa, NJ.
Schneider, S., D. Roessli and L. Excoffier, 2000 Arlequin: a software for population genetics data analysis 2.0. University of Geneva, Geneva.
Selander, R. K., W. G. Huntand S. Y. Yang, 1969a Protein polymor-phism and genic heterozygosity in 2 European subspecies of house mouse. Evolution23:379–390.
Selander, R. K., S. Y. Yangand W. G. Hunt, 1969b XVI. Poly-morphism in esterases and hemoglobin in wild populations of the house mouse (Mus musculus). Studies in Genetics V. Univ. Texas Publ.6918:271–338.
She, J. X., F. Bonhomme, P. Boursot, L. Thalerand F. Catzeflis, 1990 Molecular phylogenies in the genus Mus: comparative analysis of electrophoretic, scnDNA hybridization, and mtDNA RFLP data. Biol. J. Linn. Soc.41:83–103.
Shifman, S., J. T. Bell, R. R. Copley, M. S. Taylor, R. W. Williams et al., 2006 A high resolution single nucleotide polymorphism genetic map of the mouse genome. PLoS Biol.4:2227–2237. Silver, L. M., 1995 Mouse Genetics: Concepts and Applications.Oxford
University Press, New York.
Simonsen, K. L., G. A. Churchilland C. F. Aquadro, 1995 Pro-perties of statistical tests of neutrality for DNA polymorphism data. Genetics141:413–429.
Smit, A. F. A., R. Hubleyand P. Green, 1996–2004 RepeatMasker Open-3.0. http://www.repeatmasker.org/.
Storchova, R., S. Gregorova, D. Buckiova, V. Kyselova, P. Divina et al., 2004 Genetic analysis of X-linked hybrid sterility in the house mouse. Mamm. Genome15:515–524.
Su, A. I., T. Wiltshire, S. Batalov, H. Lapp, K. A. Chinget al., 2004 A gene atlas of the mouse and human protein-encoding transcriptomes. Proc. Natl. Acad. Sci. USA101:6062–6067. Suzuki, H., T. Shimada, M. Terashima, K. Tsuchiyaand K. Aplin,
2004 Temporal, spatial, and ecological modes of evolution of Eurasian Mus based on mitochondrial and nuclear gene sequen-ces. Mol. Phylogenet. Evol.33:626–646.
Swofford, D. L., 2003 PAUP*. Phylogenetic Analysis Using Parsimony (*and Other Methods), Version 3b10. Sinauer Associates, Sunder-land, MA.
Tajima, F., 1983 Evolutionary relationship of DNA sequences in fi-nite populations. Genetics105:437–460.
Tajima, F., 1989 Statistical method for testing the neutral mutation hypothesis by DNA polymorphism. Genetics123:585–595. Tryfonopoulos, G. A., B. R. Chondropoulosand S. E. Fraguedakis
-Tsolis, 2005 Mitochondrial DNA polymorphisms of the house mouse Mus musculus domesticus from Greece, focusing on the Robertsonian chromosomal system of north-west Peloponnese. Biol. J. Linn. Soc.84:643–651.
Tucker, P. K., R. D. Sage, J. Warner, A. C. Wilsonand E. M. Eicher, 1992 Abrupt cline for sex chromosomes in a hybrid zone be-tween two species of mice. Evolution46:1146–1163.
Wade, C. M., E. J. Kulbokas, III, A. W. Kirby, M. C. Zody, J. C. Mullikinet al., 2002 The mosaic structure of variation in the laboratory mouse genome. Nature420:574–578.
Waterston, R. H., K. Lindblad-Toh, E. Birney, J. Rogers, J. F. Abrilet al., 2002 Initial sequencing and comparative analysis of the mouse genome. Nature420:520–562.
Wiltshire, T., M. T. Pletcher, S. Batalov, S. W. Barnes, L. M. Tarantinoet al., 2003 Genome-wide single-nucleotide poly-morphism analysis defines haplotype patterns in mouse. Proc. Natl. Acad. Sci. USA100:3380–3385.
Yalcin, B., J. Fullerton, S. Miller, D. A. Keays, S. Bradyet al., 2004 Unexpected complexity in the haplotypes of commonly used inbred strains of laboratory mice. Proc. Natl. Acad. Sci. USA101:9734–9739.
Yang, H., T. A. Bell, G. A. Churchilland F. Pardo-Manuel de Villena, 2007 On the subspecific origin of the laboratory mouse. Nat. Genet.39:1100–1107.