DOI: 10.1534/genetics.106.063677
Identification of Selective Sweeps Using a Dynamically Adjusted
Number of Linked Microsatellites
Thomas Wiehe,* Viola Nolte,
†Daniel Zivkovic* and Christian Schlo
¨tterer
†,1*Institut fu¨r Genetik, Universita¨t zu Ko¨ln, Ko¨ln, Germany and†Veterina¨rmedizinische Universita¨t Wien, Wien, 1210, Austria Manuscript received July 18, 2006
Accepted for publication October 14, 2006
ABSTRACT
There is currently large interest in distinguishing the signatures of genetic variation produced by demographic events from those produced by natural selection. We propose a simple multilocus statistical test to identify candidate sites of selective sweeps with high power. The test is based on the variability profile measured in an array of linked microsatellites. We also show that the analysis of flanking mark-ers drastically reduces the number of false positives among the candidates that are identified in a genomewide survey of unlinked loci and find that this property is maintained in many population-bottleneck scenarios. However, for a certain range of intermediately severe population population-bottlenecks we find genomic signatures that are very similar to those produced by a selective sweep. While in these worst-case scenarios the power of the proposed test remains high, the false-positive rate reaches values close to 50%. Hence, selective sweeps may be hard to identify even if multiple linked loci are analyzed. Nevertheless, the integration of information from multiple linked loci always leads to a considerable reduction of the false-positive rate compared to a genome scan of unlinked loci. We discuss the application of this test to experimental data fromDrosophila melanogaster.
T
HE central role of adaptation for the evolution of natural populations is widely accepted. Neverthe-less, until very recently no systematic approaches were available to uncover the genetic changes underlying adaptation processes in natural populations.One approach relies on population genetic principles to identify beneficial mutations from patterns of natural variation and has been called hitchhiking mapping (Schlo¨ tterer 2003). The basic idea of hitchhiking
mapping is that beneficial mutations increase in fre-quency until they become fixed in the population. Hereby, not only the selected site but also linked neu-tral variants are affected by such a selective sweep (MaynardSmithand Haigh1974). As a consequence
of the spread of a beneficial mutation, levels of vari-ability are strongly reduced in the genomic region flanking the selected site. Hence, hitchhiking mapping does not require the exact location of the selected site to be known; it is sufficient to analyze linked neutral markers. This approach has already gained widespread interest and a number of studies have set out to survey genomewide levels of genetic variability to trace regions in the genome that may have been shaped by natural selection (Schlo¨ ttereret al. 1997; Payseuret al. 2002;
Vigourouxet al. 2002; Glinkaet al. 2003; Kaueret al.
2003; Kayser et al. 2003; Scho¨ fl and Schlo¨ tterer
2004; Ihleet al. 2006; Poolet al. 2006).
In a genome screen for beneficial mutations, a large number of loci are analyzed. Due to their high amount of polymorphism microsatellites are well-suited markers (Schlo¨ tterer 2004). Their high informativeness and
the cost-effective typing has made microsatellites the marker of choice for many hitchhiking mapping stud-ies. The emerging picture from all of the various studies was that genome scans are a suitable tool for the iden-tification of putatively selected genomic regions (Kohn et al. 2000; Harr et al. 2002; Vigouroux et al. 2002;
Woottonet al. 2002; Kayseret al. 2003; Nairet al. 2003;
Schlenkeand Begun2004; Scho¨ fland Schlo¨ tterer
2004; Ihleet al. 2006).
Typical hitchhiking mapping studies use markers that are distributed across the genome. Despite some recent progress toward a high-throughput analysis of markers, the density of characterized markers is still fairly low. Hence, in most cases a candidate region is identified on the basis of a single locus only. The problem of such large surveys is that each locus is tested for deviation from neutral expectations and a large number of tests could result in substantial numbers of false positives. While statistical approaches, such as the Bonferroni correction (Sokaland Rohlf1995) and false discovery
rate (FDR) (Storey2002), could account for this, the
trade-off is that the sensitivity of the mapping strategy can be compromised.
Alternatively, after an initial genomewide survey one can perform a more detailed analysis of additional markers flanking a previously identified candidate locus. The rationale is that the genealogical history around a
1Corresponding author:Institut fu¨ r O¨ kologie, Universita¨t Innsbruck,
Technikerstrasse 25, 6020 Innsbruck, Austria. E-mail: [email protected]
selected site is more uniform, and resembles the history of the selected site, than would be expected under neutrality. Hence, since flanking loci are also affected by a selective sweep, they should be useful to obtain further confidence that an identified genomic region has been exposed to a recent selective sweep. In agreement with this expectation experimental work demonstrated that variability is often reduced in genomic regions flanking a putative selective sweep (Harret al. 2002; Nairet al.
2003; Schlenkeand Begun2004). Nevertheless, until
recently no statistical tests were available for microsatel-lite data to evaluate the statistical significance of re-duced variability at linked microsatellite loci.
Here, we describe a new test statistic for the identifica-tion of recent selective sweeps using linked microsatellites.
METHODS
Definition of lnRu: A selective sweep often reduces variability in the flanking sequences (Charlesworth
1992; Hudson 1994; Schlo¨ tterer 2003). Hence, a
genome scan for regions affected by selective sweeps could focus on those regions with low levels of variabil-ity. If microsatellites are used as genetic markers in such genome scans, the complication arises that microsatel-lites have a large heterogeneity in mutation rates (Schlo¨ tterer 2000; Ellegren 2004). To distinguish
between low variability due to a low mutation rate and a selective sweep, additional information is required. To overcome this limitation, it has been proposed to consider for each locus the ratio of the population variation estimators (u ¼4Nem) from two populations (Schlo¨ tterer2002; Kaueret al. 2003). If the mutation
ratemis the same in both populations, it cancels out and an estimator Ru is obtained that does not explicitly depend on the mutation rate but only on the hetero-zygosities in the two populations:
Ru¼qˆðPop1Þ ˆ
qðPop2Þ¼
4mNeðPop1Þ 4mNeðPop2Þ¼
1 1HðPop1Þ
2
1
1 1HðPop2Þ
2
1
: ð1Þ
In Equation 1, the first equality is the definition of Ru and the last equality is derived from Ohta and
Kimura’s(1973) formula of the expected
heterozygos-ity (H) in the stepwise mutation model.
For unlinked microsatellites extensive computer sim-ulations showed that the distribution of the natural logarithm of Ru is well approximated by a standard normal distribution with the mean corresponding to the ratio in effective population size of the two pop-ulations compared. The standard deviation was shown to be affected by mutation rate, sample size, and demography (Schlo¨ tterer 2002; Kauer et al. 2003;
Schlo¨ ttererand Dieringer2005). To test for
devia-tion from neutral expectadevia-tion, a set of neutrally evolving
loci (reference loci) is required to estimate the mean (m) of lnRu and its standard deviation (s). Hence, altogether four data sets are required. The loci to be tested need to be genotyped in two populations (test loci), and a set of reference loci needs to be genotyped from the same two populations. The lnRu-valuesyiof the
test loci are transformed according tozi¼(yim)/s,
i ¼ 1, 2,. . ., to obtain standard-normal-distributed variates. Throughout this article we assume that selec-tion or a bottleneck occurred in populaselec-tion 1 (Pop1). Thus, negative lnRu-values are expected for loci that are linked to a selected site. Due to the above transforma-tion the expected value of lnRu¼0 under a population bottleneck, since the reference loci are expected to be equally affected by the bottleneck as the test loci.
Principle of the test:Here, we extend the single-locus test to multiple linked loci. The rationale is that a selective sweep typically affects a genomic region that is large enough to contain multiple microsatellite loci. Thus, their joint analysis should provide more confi-dence about deviation from neutrality than an analysis based on a single microsatellite marker. The size of the region affected by a single selective sweep depends mainly on the strength of selection and the local re-combination rate. A rough estimate is obtained by calcu-lating the ‘‘half-life’’ of a selective sweep using Equation 19 from Stephanet al. (1992). The half-life (D) is the
size of the region around the selected site in which variability is reduced by 50% or more of its neutral equilibrium value. This is
1 2
2rD
s ð2NsÞ
2rD=sG 2rD s ;
1 2Ns
:
For instance, if 2Ns¼1000 and r/s ¼106the region in which variability is reduced by $50% has a size of 110 kb. Qualitatively similar estimates have been ob-tained by Kaplanet al. (1989). With the above
param-eters one would obtain an estimate of 370 kb (see Table 2 in Kaplanet al. 1989).
The experimental design for a survey of linked loci is tricky, as the parameters of a selective sweep, and therefore the size of the affected genomic region, are not known a priori. One further complication arises from the variation in microsatellite density among ge-nomic regions (Bachtrog et al. 2000). To avoid the
problem that the number of analyzed and/or available markers affects the test results, we propose the following multilocus test strategy:
1. Standardize lnRu-values of the test loci as described above.
2. Identify the locusx* with the lowest lnRu-value. 3. Starting from x* include all upstream and
(a number that may be different for different data sets).
4. Drop locusx* from further analysis; this results in a set ofKloci to be analyzed.
5. Calculate the test statisticT(K)¼Pzi, which is the
sum of the standardized lnRu-values of theKloci. 6. Determine theP-value.
Under neutral scenarios, either with constant pop-ulation size or with poppop-ulation bottleneck, and if the individual loci are not tightly linked, the distribution of T(K) is approximately normal with mean 0 and standard deviationOK. Tight linkage leads to a violation of the assumption of independence and in this case the distribution ofT(K) is not known analytically.
Two different approaches can be used to determine if T(K) deviates from neutral expectation. The first one is based on computer simulations and the second relies on the simplifying assumption of independence of linked loci. Both approaches are discussed in detail below.
Simulating the distribution of the test statistic: We use neutral coalescent simulations to determineT(K) for 10,000 neutral data sets. Assuming that selection will generate more extreme (negative) T(K) values than expected under neutrality, we determined the lower
a-quantile qsim(a) of T(K) (for example, a ¼ 0.05) below which we consider a test significant. Note that qsim(a) does not depend onK, since it is obtained from averaging over a large number of data sets (10,000) and in each data setKmay be different. A test may be sig-nificant either due to several slightly negative lnRu -values or due to a small number of strongly negative lnRu-values. The simulation approach is preferable for small populations and closely linked loci (seeresults).
Our computer simulations were performed with mod-ified versions of the program ‘‘ms’’ of R. Hudson (Hudson 2002) and a program of Y. Kim (Kim and
Stephan2002). Both programs were originally written
to simulate the distribution of segregating sites in DNA sequences. A modification was needed to account for microsatellite evolution. Furthermore, to avoid memory and runtime problems when simulating a large genomic region (of length 600 kb), we assumed that recombina-tion scales linearly. For our purposes it is then equiva-lent to simulate a region for which the length is downscaled by some factor and simultaneously the re-combination rate is upscaled by the same factor. Thus, we simulated a region of 600 bp with a 1000-fold in-creased recombination rate. Generation of the neutral and bottlenecked data sets N and B (see below) was performed with the modified version of ms, which is fast and permits the incorporation of demography, in particular, population bottlenecks. This program does not produce the genealogy of individual sites but partitions the unit interval into regions that share the same genealogy. We simulated microsatellite mutations according to an unbiased stepwise mutation model.
Each mutation either added or removed one repeat unit with equal probability. At the end of the simulation the program provides the number of repeat units for each locus and chromosome. To generate data set S (see below) we modified the program of Y. Kim (Kimand
Stephan2002) to simulate the genealogy of a positively
selected site embedded in a genomic region of 600 bp. This program generates polymorphism data and pro-vides the character state for each nucleotide in the re-gion. Microsatellites were modeled by reinterpreting the evolution of nucleotides. Each site that coincided with a microsatellite position was treated as a microsatel-lite array and each mutation either added or removed one repeat unit with equal probability.
Both programs produced consistent results for neu-tral simulations of constant-size populations when cor-responding parameters were used. We further checked the software with a different microsatellite evolution software (Schlo¨ tterer 2002) and also obtained
con-sistent results.
Simulated data sets: Neutral, constant population size (data set N): Assuming neutrality and a constant pop-ulation size, we generated various data sets differing in the scaled recombination rate (R ¼ 4Nr), the scaled mutation rate (u¼4Nm), and sample size (n). Each data set consisted of 10,000 replicate simulations.
Bottlenecked populations (data setB):Population bottle-necks were simulated assuming a three-phase model: a population of constant sizeNis reduced to constant size dNduring time intervald. The population size before and after the bottleneck was assumed to be identical. We further assumed that reduction and increase in population size was instantaneous. The population size reduction (d) and duration (d) of the bottleneck were combined into the bottleneck-severity parameter g ¼
d/d. The severity was varied from 0.1 to 10. Further-more, we also modified the timetwhen the bottleneck was completed (measured in 2N generations, going backward from the present). The population recombi-nation rate was set to 0.02/bp/generation and the scaled mutation rate was fixed atu¼5. Samples ofn¼ 60 chromosomes were simulated.
Selective sweep (data set S): Data sets with selected loci were obtained by the modified version of Kim’s program (Kimand Stephan2002). We varied the
selec-tion coefficient 2Nsfrom 10 to 2000. For all simulations we assumed a very recent selective sweep that was com-pleted t ¼0.001 generations ago, where time is mea-sured in units of 2N. We seteto 104(eis a parameter in a sweep scenario that determines from which minimal frequency onward the dynamics of the beneficial allele are treated as deterministic rather than stochastic; see Kimand Stephan2002 for a detailed discussion on the
choice ofe).
runsB: we selected from these simulations the 5% of the runs with the lowest lnRu-values at a particular locus (say x*). These subsets are called NL and BL, respec-tively. The rationale is that a significantly reduced value of lnRu at a locus would be falsely interpreted as the trace of a selective sweep in a one-locus test;i.e., for data setsNLandBLthe false-positive rate would be 100%. It is our goal to reduce the false-positive rate in such cases by adding information from flanking loci.
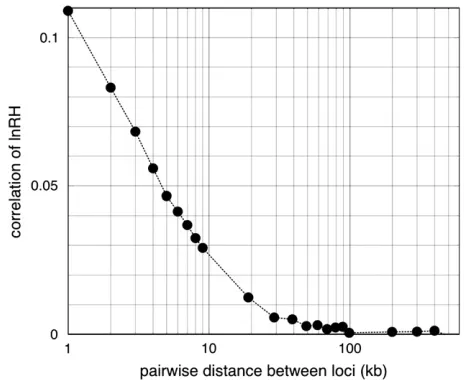
Approximate test based on the assumption of a nor-mal distribution:The second approach applies to large neutrally evolving populations and relies on the obser-vation that levels of heterozygosity are correlated only among very tightly linked sites (Figure 1). In contrast, a selective sweep leads to a drastic increase of the correla-tion of heterozygosity levels among linked microsatellite loci. As a simplifying null model we therefore treat neutrally evolving multiple microsatellites as indepen-dent even if there is some linkage. Since the sum ofk independent standard-normal-distributed random vari-ables is also normal with mean 0 and standard deviation
Ok, it is easy to construct a one-sided test on the basis of this distribution. More explicitly, one compares T(k) with thea-quantileqtheo(a,k) and rejects the null hypothesis (‘‘no selective sweep’’) ifT(k),qtheo(a,k), which is thea-quantile of the normal distribution with mean 0 and variance k. In contrast to the simulation approach described before, the critical valueqtheo(a,k) here is based on the numberkof loci that are included in a particular test. For different tests,kmay be different.
Multiple testing: A practical consequence of this method is that it can be applied to any number of linked loci. Irrespective of the number of loci surveyed, the locus with the smallest lnRu-value is identified andk flanking loci are then chosen for the test. Note that only a single test is performed per region, since thekflanking loci are tested jointly. Thus, no adjustment for multiple testing is required. Recall that the approximate analyt-ical test rests upon the assumption that the genealoganalyt-ical histories of the microsatellite loci are independent.
Calculation of lnRu and standardization: Similar to the lnRutest based on a single locus or unlinked loci, the multilocus test also requires data from two popula-tions, population 1 and population 2. They need to be typed for the same set of loci to calculate the lnRu -values. Throughout all analyses population 2 is assumed to evolve neutrally at a constant population size (N ¼ 53105). Once lnRu-values are obtained, they are stan-dardized. This requires two additional data sets from different loci for the same two populations to estimate mean (m) and standard deviation (s) of lnRu. For this we simulated an additional 10,000 unlinked loci with otherwise the same population parameters and calcu-lated m and s. Data set S is standardized with values obtained from neutral simulations.
Marker spacing: All test statistics that are based on multiple, linked loci depend on the number of loci,
their physical spacing, and the recombination rate. Thus, an almost infinite number of possible parameter combinations could be tested. We have therefore fo-cused on the analysis of some representative examples either to evaluate the influence of one parameter or to indicate a general trend. We considered different marker distributions along a 600-kb genomic region. In one case (marker topology A, see Figure 2) we assumed that the loci were evenly spaced and that the target of selection coincided with the position of one of the analyzed loci. In another set (marker topology B) we assumed the position of the selected site to be located between two adjacent neutral markers, all of them evenly spaced. In a third case (marker topology C) the marker spacing was obtained from an experimental data set of 15 microsatellites (Harret al. 2002).
Experimental data fromDrosophila melanogaster: We applied the new multilocus test to a recently identified sweep region on the third chromosome of Drosophila melanogaster(Harret al. 2002). For the standardization
of the data we were particularly cautious to use test and reference loci from the same populations. We used 40 third-chromosomal reference loci (Kaueret al. 2003)
for one African (Kisoro, Uganda) and one European (Katovice, Poland) population. We genotyped 15 micro-satellites covering the sweep region for 15 Kisoro and 30 Katovice females that were first-generation descen-dants from freshly collected flies, using standard typ-ing protocols (Schlo¨ tterer1998). All loci are located
on autosomes. Gene diversity was calculated with the ‘‘Microsatellite Analyzer’’ software (Dieringer and
Schlo¨ tterer2003).
RESULTS
The multilocus test statisticT(K) rests on the assump-tion that the pattern of variability at linked loci is more correlated under selection than under neutrality. How-ever, the increase of correlation as well as the reduction of variability produced by a selective sweep is transitory and depends on recombination rate and selection coefficient as well as on the time since the selective sweep was completed. Our approach focuses on the expectation that a recent selective sweep leaves reduced levels of variability in a genomic region flanking the target of selection. Therefore, such a region should harbor more linked loci with reduced variability than expected under a neutral scenario. To account for the large variation in microsatellite density across a ge-nome, we propose a dynamically adjusted, rather than a fixed, number of markers to be tested. The details are described inmaterials and methods.
way in which multiple markers are selected for the test: both the leftmost and the rightmost markers are re-quired to have positive lnRu-values, thereby creating a slight upward bias of the distribution ofT(K). The false-positive rate of the test for data sets NL and B is de-termined on the basis ofqsim(a).
While computer simulations yield an accurate esti-mate for the probability that a given data set is consistent with neutral expectations, they suffer from the disad-vantage thata prioriassumptions have to be made for a set of parameters, such as the mutation and recombi-nation rates,u¼4NmandR¼4Nr. Therefore, we also use an approximate analytical procedure that assumes independence between linked loci and standard nor-mality of the statistic lnRufor single loci. Figure 1 shows the correlation coefficient between the lnRu-values for a pair of loci with varying distance. Even for markers as close as 1 kb the correlation coefficient is quite low (0.1). This shows that under neutrality only a very small proportion of the variation at a given marker can be explained by a linked one, even if linkage is tight. We determined the power and the false-positive rate of the test with two test strategies, the one relying on the simulated distribution ofT(K) (Monte Carlo strategy) and the one relying on an analytical approximation (Tables 1–3). Both test strategies produced highly con-sistent results. For most cases we observed that the the-oretical false-positive rate was below the simulated one. The various data sets and their descriptions together with the symbols used are listed in Table 4.
Power estimates: The statistical power to detect de-viation from neutrality is assessed with the help of data setSin which data for a range of different selection intensities and recombination rates were simulated. Overall, our test had a high statistical power with many scenarios having a 100% detection rate of selective
sweeps. The most important factor influencing the power of our test is the strength of selection, with small selection coefficients (2Ns,10) resulting in a very low power. Similarly, high recombination rates (R . 2 3 102) also resulted in a loss of power to detect a selective sweep. Consistent with previous results for unlinked loci (Schlo¨ ttererand Dieringer2005), the mutation rate
had almost no impact on the statistical power. The same holds for the sample sizen, except for extremely small samples (Table 1). We also found the tests based on gene diversity (heterozygosity) to be more powerful Figure1.—Correlation between lnRu1and lnRu2of a pair
of markers vs. their distance (in kilobases) under a neutral constant-population-size model. Parameters are: recombination rateR¼23103, mutation rateu¼5, sample sizen¼60. The correlation coefficient between 23 pairs of loci at distances ranging from 1 to 500 kb was calculated on the basis of 10,000 replicates. At distances.5 kb the average correlation is,0.05.
TABLE 1
Power of the multilocus test (data set S)
Selection coefficient Recombination rate Mutation rate Sample size
s Simul Theor 4Nr Simul Theor u Simul Theor n Simul Theor
105 6.60 4.20 23104 100.00 100.00 5 99.40 99.60 10 85.20 85.20 53105 6.20 4.00 103 99.60 99.60 7.5 99.60 99.60 20 96.40 96.80 104 13.60 13.00 23103 99.40 99.60 10 100.00 100.00 30 98.80 99.00 53104 93.40 93.60 102 43.25 41.00 50 100.00 100.00 40 99.00 99.20
103 99.40 99.60 50 99.80 100.00
23103 100.00 100.00 60 99.40 99.60
100 99.60 99.80 200 99.40 99.60
than those based on the variance in repeat number (data not shown). Another parameter that strongly in-fluences the detection rate of selective sweeps is the time
tsince a selective sweep was completed. Recent sweeps are easy to detect, while older ones are not. We observe a
dramatic loss in power when the ratios/t,0.1; sweeps for which the ratios/t,0.01 are virtually undetectable (results not shown).
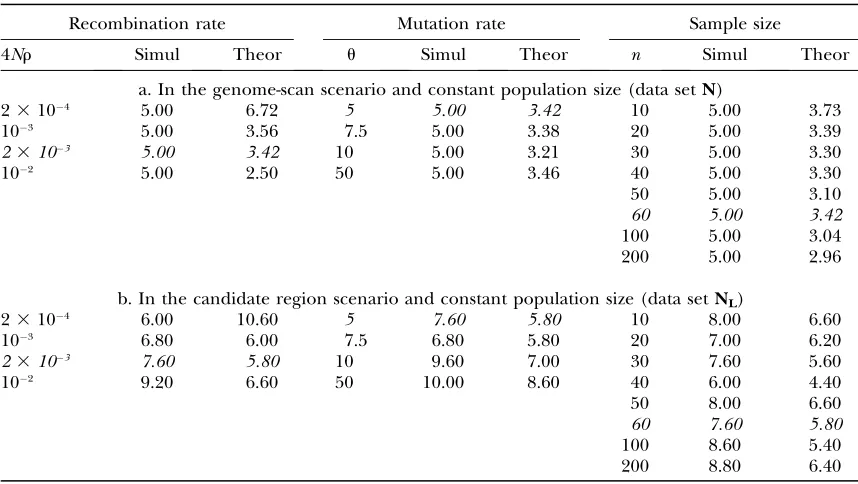
False positives:A set of linked microsatellites can be analyzed in two different experimental contexts. Either TABLE 2
False-positive rate: constant population size
Recombination rate Mutation rate Sample size
4Nr Simul Theor u Simul Theor n Simul Theor
a. In the genome-scan scenario and constant population size (data setN)
23104 5.00 6.72 5 5.00 3.42 10 5.00 3.73
103 5.00 3.56 7.5 5.00 3.38 20 5.00 3.39
23103 5.00 3.42 10 5.00 3.21 30 5.00 3.30
102 5.00 2.50 50 5.00 3.46 40 5.00 3.30
50 5.00 3.10
60 5.00 3.42
100 5.00 3.04 200 5.00 2.96
b. In the candidate region scenario and constant population size (data setNL)
23104 6.00 10.60 5 7.60 5.80 10 8.00 6.60
103 6.80 6.00 7.5 6.80 5.80 20 7.00 6.20
23103 7.60 5.80 10 9.60 7.00 30 7.60 5.60
102 9.20 6.60 50 10.00 8.60 40 6.00 4.40
50 8.00 6.60
60 7.60 5.80
100 8.60 5.40 200 8.80 6.40
See Table 1 legend for details.
TABLE 3
False-positive rate: bottleneck
Bottleneck severity (durationb/depth)
10 4 2 1 0.5 0.2 0.1
Onseta Simul Theor Simul Theor Simul Theor Simul Theor Simul Theor Simul Theor Simul Theor
a. In the genome-scan scenario with population 1 exposed to a bottleneck (data setB)
0.002 5.51 3.73 7.43 3.41 48.41 40.21 26.46 25.16 14.64 13.91 8.60 7.11 6.17 4.40 0.01 5.06 2.91 6.81 3.50 38.96 31.50 24.62 23.30 15.09 13.90 8.56 7.00 5.63 4.50 0.02 5.43 3.37 6.62 3.92 27.86 21.21 24.92 23.40 14.56 13.40 8.08 6.54 5.74 3.74 0.05 4.71 3.13 5.76 3.70 17.35 12.26 22.15 20.60 13.92 12.41 7.27 5.69 6.25 4.23 0.1 4.52 2.78 5.48 3.57 12.38 8.50 17.51 15.00 11.54 9.54 6.46 4.81 5.63 3.85 0.15 4.48 2.90 5.01 3.31 8.90 6.14 12.83 10.66 9.41 7.32 6.15 4.21 5.13 2.98 0.2 4.53 3.10 5.45 3.70 7.64 5.19 10.27 7.96 7.62 5.90 5.47 3.74 4.98 3.31
b. In the candidate region scenario with population 1 exposed to a bottleneck (data setBL)
0.002 9.82 6.70 15.81 5.84 66.80 58.55 53.63 53.23 38.00 37.20 17.20 15.40 11.20 8.80 0.01 6.40 4.20 8.00 5.40 56.60 48.60 53.40 52.60 36.20 34.40 16.60 16.20 13.00 11.00 0.02 9.40 7.80 8.80 6.80 40.80 32.60 53.20 52.60 37.20 36.60 20.00 17.20 8.00 6.60 0.05 8.20 6.00 6.00 4.60 25.00 21.40 50.40 50.00 32.40 31.20 140 12.60 9.60 7.20 0.1 8.00 5.40 9.40 9.00 20.40 16.80 35.80 32.00 28.00 24.60 13.40 11.00 10.80 8.60 0.15 6.00 4.00 8.80 7.40 13.60 11.40 28.00 24.40 20.00 16.80 11.40 9.20 10.20 6.80 0.2 6.20 5.00 8.40 6.20 11.60 10.60 21.80 20.60 16.40 15.20 7.00 5.60 8.80 6.20
See Table 1 legend for details. a
the genomic region was chosen in the absence ofa priori information (first-pass genome scan) or previous work suggested that a surveyed region might not evolve neu-trally and a dense marker analysis was subsequently per-formed for that region (candidate region analysis). Any statistical test using linked microsatellite data has to distinguish between these two scenarios.
False positives in first-pass genome scans: We de-termined the false-positive rate for a first-pass genome scan using linked microsatellites by the comparison of two neutral data sets (data setN). In this case the false-positive rate for the Monte Carlo test strategy isa fortiori equal to 5%, since the Monte Carlo simulations are used only to determine the critical value. However, the false-positive rate for data setNcan be determined for the approximate analytical test strategy. We find that, irre-spective of the mutation and recombination rates, the number of false positives is close to the expected value of 5% (Table 2a). Only in the case of very low re-combination rates (23 104) is the false positive rate slightly.5%.
False positives in a candidate region analysis: The analysis of linked microsatellite data for a fine-scale
can-didate region analysis is more complicated. Depending on the choice of the levela of the test, each genome scan will identify a fraction of putatively selected loci, even if both populations have been evolving neutrally. Thus, an important question is whether the analysis of flanking microsatellite loci could reduce the number of false positives. We used a neutral data set consisting of 10,000 simulations of linked microsatellites and selected those runs for which the lnRu-values of one particular locus fell in the lower 5% tail (data setNL, as explained inmaterials and methods). The resulting
500 simulations all had low lnRu-values at the same locus and were subject to the multilocus test. The results show that the analysis of linked loci drastically reduces the number of false positives. Compared to an analysis of linked loci with no a priori information (‘‘first-pass genome-scan’’ scenario), the false-positive rate in-creased generally less than twofold (Table 2b). Interest-ingly, even for the case of low recombination the approximate analytical test resulted only in 10.6% false positives. Hence, the analysis of flanking markers can provide an efficient tool to enhance the specificity of hitchhiking mapping studies.
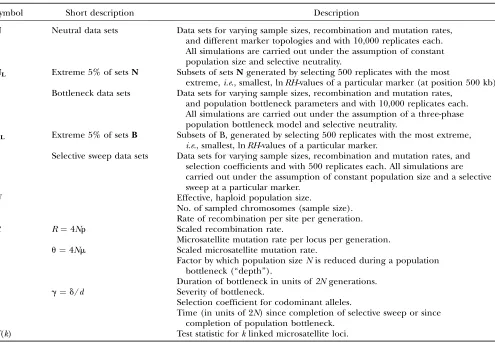
TABLE 4
Description of simulated data sets and symbols used
Symbol Short description Description
N Neutral data sets Data sets for varying sample sizes, recombination and mutation rates, and different marker topologies and with 10,000 replicates each. All simulations are carried out under the assumption of constant population size and selective neutrality.
NL Extreme 5% of setsN Subsets of setsNgenerated by selecting 500 replicates with the most
extreme,i.e., smallest, lnRH-values of a particular marker (at position 500 kb) B Bottleneck data sets Data sets for varying sample sizes, recombination and mutation rates,
and population bottleneck parameters and with 10,000 replicates each. All simulations are carried out under the assumption of a three-phase population bottleneck model and selective neutrality.
BL Extreme 5% of setsB Subsets of B, generated by selecting 500 replicates with the most extreme,
i.e., smallest, lnRH-values of a particular marker.
S Selective sweep data sets Data sets for varying sample sizes, recombination and mutation rates, and selection coefficients and with 500 replicates each. All simulations are carried out under the assumption of constant population size and a selective sweep at a particular marker.
N Effective, haploid population size.
n No. of sampled chromosomes (sample size).
r Rate of recombination per site per generation. R R¼4Nr Scaled recombination rate.
m Microsatellite mutation rate per locus per generation.
u u¼4Nm Scaled microsatellite mutation rate.
d Factor by which population sizeNis reduced during a population bottleneck (‘‘depth’’).
d Duration of bottleneck in units of2Ngenerations.
g g¼d/d Severity of bottleneck.
s Selection coefficient for codominant alleles.
t Time (in units of 2N) since completion of selective sweep or since completion of population bottleneck.
Dependence on the number and spacing of micro-satellites: In the analyses described above, we consid-ered 29 loci evenly spaced over 600 kb of genomic DNA and the target of selection coincided with one of the microsatellite loci (Figure 2, marker topology A). We also tested how the number and distribution of micro-satellites affect the power and false positives. First, we analyzed the case that the target of selection falls in the middle between two microsatellites. The region was again of length 600 kb and contained 30 microsatellite loci spaced at a distance of 20 kb (Figure 2, marker topology B). We observed a slight reduction in power. The loss in power is more pronounced only for the case of high recombination and the approximate analytical test strategy. On the other hand, the false positive rate is slightly increased for the case of low recombination. In general, the loss in power and increase in false positives do not severely compromise the test (supplemental Ta-ble S3 at http://www.genetics.org/supplemental/). Thus, the position of markers relative to the target of selection has no major effect on the test statistic.
Second, we varied the physical distance of micro-satellites. Although this analysis is equivalent to varying the recombination rate, we included it as a guideline for experimental design as experimentalists are often in-terested to what extent the additional expenses of an increased marker density are paid off by an increase in statistical power. Our analysis of different recombina-tion rates already indicated that more densely distrib-uted microsatellites might yield higher power. We investigated this effect in detail by fixing the recombi-nation rate, the selection coefficient, and the number of markers (supplemental Table S2 at http://www.genetics. org/supplemental/). Consistent with our results for dif-ferent recombination rates, we also observe an increase in power with marker density. The trade-off is an increase in the false-positive rate of the test for tightly spaced markers. However, even for a marker distance as close as 5 kb the false-positive rate in the candidate region scenario is only 10.8% when the approximate analytical test strategy is applied.
Third, we determined the influence of the number of loci genotyped. We analyzed an increasing number of loci (5, 10, 15, and 20 loci), but the spacing of the loci remained constant at 10 kb. As expected, we observe no
reduction in statistical power when fewer loci are avail-able. The false-positive rate also remains under 7% in the candidate region scenario and when the approxi-mate analytical test strategy is applied. For the Monte Carlo test strategy, the false-positive rate increases almost fourfold in the case of only five available markers (supplemental Table S1 at http://www.genetics.org/ supplemental/).
Finally, we determined power and false-positive rate of the multilocus test for a set of 15 microsatellites with physical distances as in the experimental data set from Harret al. (2002) (Figure 2, marker topology C). In line
with the above results we find that the power of the test depends most critically on the recombination rate, with low power for high recombination rates. The number of false positives remains under 10.6% for all cases in-vestigated (supplemental Tables S4a–S4c at http:// www.genetics.org/supplemental/).
Impact of demography: Until now, we were consid-ering only stable populations with no changes in pop-ulation size. Most genome scans for selected genomic regions are, however, performed in populations that experienced a recent reduction in population size. While genome scans using the lnRu-test statistic for unlinked loci are not strongly affected by changes in population size, an analysis of linked loci needs to account for demographic events.
Typically, three parameters are used to characterize population bottlenecks, the depth of the bottleneck (d), the duration of the bottleneck (d), and the timetwhen the bottleneck was completed, looking backward from the present. We also call the latter the time of onset. The depth is the factor by which the original population size N is reduced during the bottleneck. To shrink the parameter space, we use the ratiog¼d/dof bottleneck duration and depth, called severity, and fix the duration atd¼105(in units of 2N). While this simplification is unproblematic for typical parameter values, it should be noted that it becomes incorrect for very long and shallow bottlenecks. However, as far as our test is con-cerned such cases do not inflate the false-positive rate (see supplemental Figure S1 at http://www.genetics. org/supplemental/). Very recent and very severe bot-tlenecks result in a high proportion of invariable loci (.15%). For such demographic scenarios the Figure2.—Schematic of three different
micro-satellite marker topologies that have been used to generate the simulated data sets. Topology A: equidistant marker spacing of 29 markers at a dis-tance of 20 kb. The selected site (vertical bar at position 500 kb) coincides with one of the markers. Topology B: equidistant marker spacing of 30 markers at a distance of 20 kb. The selected site (vertical bar at position 500 kb) is in the mid-dle between two adjacent markers. Topology C: 15 markers positioned as those in the experimental study by Harret al. (2002).
lnRu-statistic is not applicable since the high number of invariant loci makes lnRu nonnormally distributed (Schlo¨ tterer2002). Nevertheless, such extreme
bot-tlenecks can be easily distinguished from selective sweeps by the large number of invariant loci occurring throughout the entire genome. Furthermore, the multi-locus test did not result in an increased number of false positives for old bottlenecks, irrespective of their sever-ity. Recent bottlenecks with a low severity (g,0.2) were also unproblematic. In contrast, bottlenecks with in-termediate severities (gbetween 0.5 and 2) produce a signal that the multilocus test often misinterprets as deviation from neutrality. In the worst case (g¼2,t¼ 0.002) we detected 40.2% false positives (Table 3a, Figure 3B, and supplemental Table S4d at http:// www.genetics.org/supplemental/). We also tested to what extent population bottlenecks compromised the ability to reduce the number of false positives in a set of candidate loci derived from a first-pass genome scan. As for the constant population case described above, we selected those data sets for which the lnRu-values of one particular locus fell in the lower 5% tail. In contrast to the previous analysis, the low 5% were taken from bottleneck simulations. As expected for old bottlenecks and low severity values, the analysis of linked loci resulted in a considerable reduction of false positives. Bottlenecks with intermediate severities remain prob-lematic in being distinguishable from selective sweeps. Nevertheless, even in the worst case the analysis of linked loci reduces the number of false positives from 100 to 58.6% (Table 3b, Figure 3B, and supplemental Table S4e at http://www.genetics.org/supplemental/).
Application: We analyzed a genomic region that has previously been identified as a putative target of a selective sweep. Most important, despite that linked microsatellites were genotyped, only a single locus was found to be deviating from neutral expectations. We genotyped the same 15 microsatellites that were ana-lyzed previously by Harret al. (2002) in one additional
European (Poland) and one African (Uganda) popula-tion. Figure 4 indicates the lnRu-values for all 15 loci covering a 600-kb region on the third chromosome in D. melanogaster. Similar to the results of Harr et al.
(2002) we found one locus with a pronounced re-duction in variability. Our multilocus test statistic was T(10)¼ 5.795. For a level ofa¼0.05 the quantile is qtheo(a, 10)¼ 5.201 and theP-value isP¼0.0334 [i.e., the cumulative probability of the normal distribution with mean 0 and variance 10 evaluated at T(10) ¼ 5.795]. Therefore, the reduction of variability at the 10 loci adjacent to the one with the strongest reduction of lnRHprovided sufficient information to reject the null hypothesis of neutrality.
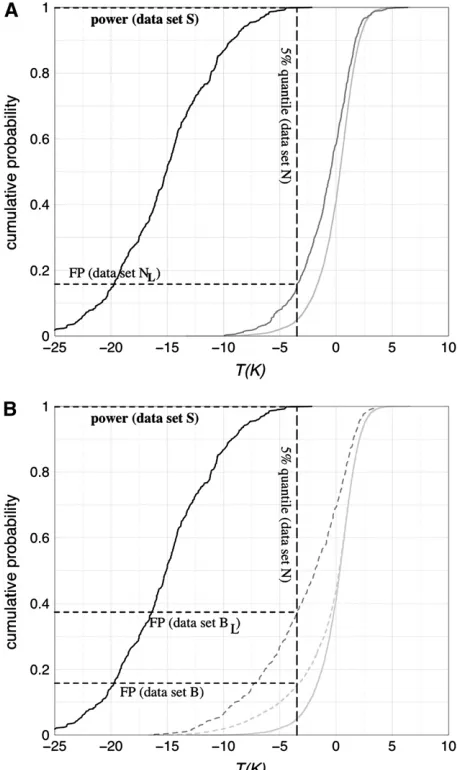
Given that the habitat expansion of D. melanogaster was associated with a pronounced population bottle-neck, it is important to consider its impact on the multilocus test. For instance, the population bottleneck Figure3.—(A) Constant population size: plot of the
cumu-lative distribution functions of the test statisticT(K) for neutral evolution (lines with dark and light shading) and a selective sweep (solid line). Simulations are for a region of 600 kb with 15 microsatellite markers (with spacings as shown in Figure 4) and an average distance of 37.6 kb. Additional parameters: re-combination rateR¼23103, mutation rateu¼5, sample size n¼60, selection coefficients¼103, effective population size N¼53105, time of completion of sweept¼0.001 (in units of 2N). Dashed vertical line: 5% quantile of the distribution of T(K) for the neutral data set N(constant population size, 10,000 samples). Dashed horizontal lines: power (99.8%) ob-tained on data setS(recent selective sweep, 500 samples) and false-positive rate (15.8%) on data setNL(candidate region
scenario, 500 samples; seematerials and methods). (B)
Bot-tlenecked population: plot of the cumulative distribution functions of the test statisticT(K) for a bottlenecked popula-tion (dashed lines with dark and light shading) and a selective sweep (solid line). For comparison also the distribution for a neutral constant size population is shown (solid line with light shading). Parameters areg¼2 (bottleneck severity) andt¼
0.05 (end of bottleneck; in units of 2N); other parameters are as in A. The false-positive rates are 15.8% for data setB(10,000 samples) and 37.2% for data setBL(candidate region scenario,
parameters that had been inferred by Haddrillet al.
(2005) for non-African populations ofD. melanogaster would yield a false-positive rate of 20.6% in the genome-scan scenario and of 49.6% in the candidate locus sce-nario. Assuming that a similar parameter range may apply to European populations ofD. melanogaster, there would be an odds ratio of1:2 for the observed data to be due to a bottleneck instead of a selective sweep.
DISCUSSSION
Neutrality tests based on microsatellites focus mainly on unlinked loci and are based on either reduced variability (lnRu) or population differentiation (FST). Tests of linkage disequilibrium are rarely used for microsatellite data due to the difficulty of haplotype inference of multiallelic loci. Furthermore, tests of linkage disequilibrium are extremely sensitive to the demographic history. In contrast, our proposed test considers lnRuof several linked loci for the inference of selection. While the single-locus lnRu-test is largely independent of the demographic past, the additional power of linked loci is balanced by the cost of an increasing dependence on the demographic past.
Previously, an alternative method using linked micro-satellites for the identification of selection was proposed (Pollingeret al. 2005). The authors show that a
pro-nounced reduction in variability at three linked
micro-satellite loci provides a very strong signal of a selective sweep. However, with this test strategy it is not clear how to account for a theoretical null distribution. A general method for the identification of selection at linked microsatellites should be more flexible and cope with the following challenges:
1. The method should be independent of the number of microsatellites genotyped, as the target of selec-tion is often not known.
2. The heterogeneity in microsatellite density could result in a clustering of markers and thus lead to false positives.
3. The mutation rate of microsatellites often differs by orders of magnitude; to distinguish whether low vari-ability is due to selection or due to a low mutation rate, it is important to filter out mutation rate differences. 4. It should be suitable for a candidate region study to
confirm or dismiss a selective sweep detected by a single-locus test in a genome scan.
Our proposed multilocus test is designed to meet these criteria. Its key property is the independence from an a priori choice of the number of loci to be typed. Through a dynamic,a posteriori, determination of the number of loci, the multilocus test can be applied to any number of available loci, allowing for an arbitrary spacing of markers. Nevertheless, if the genotyped markers do not adequately cover the selected region, the power of the test statistic may be reduced, as only a fraction of the loci carrying the signal of the selective sweep are included. Furthermore, because the ratio of variability in two populations is considered for each locus, mutational differences between loci are mostly eliminated (Equation 1)—at least as far as first-order moments are concerned. Therefore, the test statistic T(K)¼Pi¼1;...;KðziÞ, as described above, does depend
only marginally on the mutation rate u. We have analyzed heterozygosity (ln RH in the notation of Schlo¨ tterer 2002) as well as the variance in repeat
number at microsatellites (ln RV) as measures of variability. We find qualitatively corresponding results for ln RV and ln RH. However, the multilocus test generally is more powerful and has a similar or even lower false-positive rate for ln RH than for ln RV. Therefore, we decided to report here only the results for lnRH. Finally, as our multilocus test is based only on markers flanking the candidate locus, the false-positive rate can be kept low and is in fact close to the theoretical levelaof the test. While this strategy is conservative it leads to a minor loss in power compared to an approach that uses all markers. Nevertheless, the power to detect recent sweeps remains close to 100%, except in regions of high recombination. The power also drastically decreases with the age of selective sweeps.
As in all tests that use information from linked sites, the most difficult problem remains to disentangle the effects of a selective sweep from a medium severe, recent Figure 4.—Variability profile of 15 microsatellite loci
lo-cated on chromosome 3L ofD. melanogaster. x-axis: position on chromosome in base pairs.y-axis: lnRuas in Equation 1 for population 1 from Poland and population 2 from Uganda (seematerials and methods). Boxes denote the lnRu-values
bottleneck. If the demographic past and other popula-tion parameters are known, it is possible to use the Monte Carlo test strategy and determine the distribu-tion ofT(K) by simulations. As this information is often not available, we focused on an alternative test strategy. Assuming no linkage among the microsatellites, we determined the increase in false positives when one population experienced a change in population size. We found that bottlenecks of intermediate severity resulted in the most pronounced increase in false posi-tives. Interestingly, a recent reanalysis of DNA sequence polymorphism data inD. melanogaster(Haddrillet al.
2005) also identified a demographic scenario that was compatible with data for which previously multiple selec-tive sweeps were detected (Glinkaet al. 2003). Recent
population bottlenecks with a severity roughly between 0.5 and 2 can produce a signature in the genome that is easily misinterpreted as selection. Similar results have been obtained for sequence variability data in-stead of microsatellites. Jensen et al. (2005) note that
the composite-likelihood-ratio test of Kimand Stephan
(2002) may yield an up to 90% false-positive rate for certain parameter combinations.
It can be shown that a high false-positive rate of our multilocus test for the mentioned range of bottleneck severities is associated with a high variance in heterozy-gosity at the microsatellite loci. Recent population bottlenecks of intermediate severity can lead to a more than fourfold increase of the variance of heterozygosity compared to the variance in a constant-size population (Figure 5). In a very similar manner, selective sweeps, while decreasing average heterozygosity, also lead to an increase of the variance of heterozygosity.
Our test assumes that variability data from two ge-netically isolated populations are compared. Migration
between populations generally results in a more distant common ancestor and increased genetic variability within a population. Therefore, migration might reduce the power but should not increase the false-positive rate of our test. Nevertheless, the details of the impact of extended gene flow upon false-positive rate and power of the test need further investigation. Furthermore, in classical hitchhiking models—and also in the one considered here—it is assumed that the selected allele is codominant. As has been pointed out by Teshimaet al.
(2006), recessivity or dominance may have a nonnegli-gible effect upon tests for selective sweeps.
We thank M. Thomas for many stimulating discussions and two anon-ymous reviewers for helpful comments. This work has been supported by grants from the Fonds zur Fo¨rderung der wissenschaftlichen Forschung to C.S. and from the German Ministry of Education and Research (FK 0312705A) and the German Science Foundation (DFG-SFB680) to T.W.
LITERATURE CITED
Bachtrog, D., M. Agis, M. Imhofand C. Schlo¨ tterer, 2000
Mi-crosatellite variability differs between dinucleotide repeat motifs-evidence from Drosophila melanogaster. Mol. Biol. Evol. 17:
1277–1285.
Charlesworth, B., 1992 Evolutionary biology. New genes sweep
clean. Nature356:475–476.
Dieringer, D., and C. Schlo¨ tterer, 2003 Two distinct modes of
microsatellite mutation processes: evidence from the complete genomic sequences of nine species. Genome Res.13:2242–2251. Ellegren, H., 2004 Microsatellites: simple sequences with complex
evolution. Nat. Rev. Genet.5:435–445.
Glinka, S., L. Ometto, S. Mousset, W. Stephanand D. DeLorenzo,
2003 Demography and natural selection have shaped genetic var-iation inDrosophila melanogaster: a multilocus approach. Genetics
165:1269–1278.
Haddrill, P. R., K. R. Thornton, B. Charlesworthand P. A ndol-fatto, 2005 Multilocus patterns of nucleotide variability and
the demographic and selection history of Drosophila mela-nogaster populations. Genome Res.15:790–799.
Harr, B., M. Kauerand C. Schlo¨ tterer, 2002 Hitchhiking
map-ping: a population-based fine-mapping strategy for adaptive mu-tations in Drosophila melanogaster. Proc. Natl. Acad. Sci. USA
99:12949–12954.
Hudson, R. R., 1994 How can the low levels of DNA sequence
var-iation in regions of the drosophila genome with low recombina-tion rates be explained? Proc. Natl. Acad. Sci. USA91:6815–6818. Hudson, R. R., 2002 Generating samples under a Wright-Fisher
neutral model of genetic variation. Bioinformatics18:337–338. Ihle, S., I. Ravaoarimanana, M. Thomasand D. Tautz, 2006 An
analysis of signatures of selective sweeps in natural populations of the house mouse. Mol. Biol. Evol.23:790–797.
Jensen, J. D., Y. Kim, V. B. DuMont, C. F. Aquadro and C. D.
Bustamante, 2005 Distinguishing between selective sweeps
and demography using DNA polymorphism data. Genetics170:
1401–1410.
Kaplan, N. L., R. R. Hudsonand C. H. Langley, 1989 The
‘‘hitch-hiking effect’’ revisited. Genetics123:887–899.
Kauer, M. O., D. Dieringerand C. Schlo¨ tterer, 2003 A
micro-satellite variability screen for positive selection associated with the ‘‘out of Africa’’ habitat expansion ofDrosophila melanogaster. Genetics165:1137–1148.
Kayser, M., S. Brauerand M. Stoneking, 2003 A genome scan to
detect candidate regions influenced by local natural selection in human populations. Mol. Biol. Evol.20:893–900.
Kim, Y., and W. Stephan, 2002 Detecting a local signature of genetic
hitchhiking along a recombining chromosome. Genetics 160:
765–777.
Kohn, M. H., H. J. Pelzand R. K. Wayne, 2000 Natural selection
mapping of the warfarin-resistance gene. Proc. Natl. Acad. Sci. USA97:7911–7915.
Figure 5.—Variance of heterozygosity, V(H) at unlinked
microsatellites under a population bottleneck of varying se-verity. x-axis: severity of bottleneck g ¼ d/d (d in units of 2N).y-axis:V(H); for comparison, the shaded horizontal line showsV(H) under a constant-size population. Parameters are
MaynardSmith, J., and J. Haigh, 1974 The hitch-hiking effect of
a favorable gene. Genet. Res.23:23–35.
Nair, S., J. T. Williams, A. Brockman, L. Paiphun, M. Mayxayet al.,
2003 A selective sweep driven by pyrimethamine treatment in southeast Asian malaria parasites. Mol. Biol. Evol.20:1526–1536. Ohta, T., and M. Kimura, 1973 A model of mutation appropriate to
estimate the number of electrophoretically detectable alleles in a finite population. Genet. Res.22:201–204.
Payseur, B. A., A. D. Cutterand M. W. Nachman, 2002 Searching
for evidence of positive selection in the human genome using patterns of microsatellite variability. Mol. Biol. Evol. 19:1143– 1153.
Pollinger, J. P., C. D. Bustamante, A. Fledel-Alon, S. Schmutz,
M. M. Grayet al., 2005 Selective sweep mapping of genes with
large phenotypic effects. Genome Res.15:1809–1819. Pool, J. E., V. BauerDuMont, J. L. Muellerand C. F. Aquadro,
2006 A scan of molecular variation leads to the narrow localiza-tion of a selective sweep affecting both Afrotropical and cosmo-politan populations of Drosophila melanogaster. Genetics 172:
1093–1105.
Schlenke, T. A., and D. J. Begun, 2004 Strong selective sweep
asso-ciated with a transposon insertion in Drosophila simulans. Proc. Natl. Acad. Sci. USA101:1626–1631.
Schlo¨ tterer, C., 1998 Microsatellites, pp. 237–261 in Molecular
Genetic Analysis of Populations: A Practical Approach 2/e, edited by A. R. Hoelzel. Oxford University Press, Oxford.
Schlo¨ tterer, C., 2000 Evolutionary dynamics of microsatellite
DNA. Chromosoma109:365–371.
Schlo¨ tterer, C., 2002 A microsatellite-based multilocus screen
for the identification of local selective sweeps. Genetics 160:
753–763.
Schlo¨ tterer, C., 2003 Hitchhiking mapping—functional
ge-nomics from the population genetics perspective. Trends Genet.
19:32–38.
Schlo¨ tterer, C., 2004 The evolution of molecular markers—Just a
matter of fashion? Nat. Rev. Genet.5:63–69.
Schlo¨ tterer, C., and D. Dieringer, 2005 A novel test statistic for
the identification of local selective sweeps based on microsatellite gene diversity, pp. 55–64 inSelective Sweep, edited by D. Nurminsky.
Kluwer Academic/Plenum Publishers, New York.
Schlo¨ tterer, C., C. Vogland D. Tautz, 1997 Polymorphism and
locus-specific effects on polymorphism at microsatellite loci in naturalDrosophila melanogasterpopulations. Genetics146:309– 320.
Scho¨ fl, G., and C. Schlo¨ tterer, 2004 Patterns of microsatellite
variability among X chromosomes and autosomes indicate a high frequency of beneficial mutations in non-African D. simulans. Mol. Biol. Evol.21:1384–1390.
Sokal, R. R., and F. J. Rohlf, 1995 Biometry: The Principles and
Prac-tice of Statistics in Biological Research. W. H. Freeman, New York. Stephan, W., T. Wieheand M. Lenz, 1992 The effect of strongly
se-lected substitutions on neutral polymorphism: analytical results based on diffusion theory. Theor. Popul. Biol.41:237–253. Storey, J. D., 2002 A direct approach to false discovery rates. J. R.
Stat. Soc. Ser. B64:479–498.
Teshima, K. M., G. Coopand M. Przeworski, 2006 How reliable are
empirical genomic scans for selective sweeps? Genome Res.16:
702–712.
Vigouroux, Y., M. McMullen, C. T. Hittinger, K. Houchins, L.
Schulzet al., 2002 Identifying genes of agronomic importance
in maize by screening microsatellites for evidence of selection during domestication. Proc. Natl. Acad. Sci. USA99:9650–9655. Wootton, J. C., X. Feng, M. T. Ferdig, R. A. Cooper, J. Muet al.,
2002 Genetic diversity and chloroquine selective sweeps in Plas-modium falciparum. Nature418:320–323.