DOI: 10.1534/genetics.106.062208
High-Resolution Quantitative Trait Locus Analysis Reveals Multiple Diabetes
Susceptibility Loci Mapped to Intervals
\
800 kb in the
Species-Conserved
Niddm1i
of the GK Rat
Charlotte Granhall,* Hee-Bok Park,* Hossein Fakhrai-Rad
†,‡and Holger Luthman*
,‡,1*Lund University, Department of Clinical Sciences, SE-205 02 Malmo¨, Sweden,†ParAllele BioScience, South San Francisco, California 94080 and‡Karolinska Institutet, Department of Molecular Medicine, SE-171 76 Stockholm, Sweden
Manuscript received June 19, 2006 Accepted for publication August 18, 2006
ABSTRACT
Niddm1i, a 16-Mb locus within the major diabetes QTL in the diabetic GK rat, causes impaired glucose tolerance in the congenic NIDDM1I strain.Niddm1iis homologous to both human and mouse regions linked with type 2 diabetes susceptibility. We employed multiple QTL analyses of congenic F2 progeny selected for one recombination event within Niddm1i combined with characterization of subcongenic strains. Fine mapping located one hyperglycemia locus within 700 kb (Niddm1i4,P¼53106). Two
adja-cent loci were also detected, and the GK allele at Niddm1i2 (500 kb) showed a glucose-raising effect, whereas it had a glucose-lowering effect at Niddm1i3 (400 kb). Most proximally, Niddm1i1 (800 kb) affecting body weight was identified. Experimental data from subcongenics supported the four loci.Sorcs1, one of the two known diabetes susceptibility genes in the region, resides within Niddm1i3, whileTcf7l2 maps outside all four loci. Multiple-marker QTL analysis incorporating the effect of cosegregating QTL as cofactors together with genetically selected progeny can remarkably enhance resolution of QTL. The data demonstrate that the species-conserved Niddm1i is a composite of at least four QTL affecting type 2 diabetes susceptibility and that two adjacent QTL (Niddm1i2GKandNiddm1i3GK) act in opposite directions.
T
YPE 2 diabetes or noninsulin-dependent diabetes mellitus (NIDDM) is defined by chronic elevation of plasma glucose, but the underlying pathophysiology is complex and profoundly influenced by both poly-genic background and environmental factors (such as di-etary habits, smoking, and physical activity). Consequently, the phenotypes associated with type 2 diabetes suscep-tibility usually show a quantitative variation (Permuttet al.2005).
The risk to type 2 diabetes in humans has a measur-able genetic component as indicated by familial clus-tering and higher concordance rates in monozygotic twins compared with dizygotic twins (Mediciet al.1999;
Poulsen et al. 1999) and by the high heritability of
insulin secretion and insulin action (Iseliuset al.1985;
Lehtovirtaet al.2000; Poulsen et al.2005). Genetic
studies of inbred animals raised in standardized envi-ronments facilitates the identification of disease mech-anisms via identification of naturally occurring alleles capable of influencing the progression from health to diabetes (Aitmanet al.1999; Fakhrai-Radet al.2000).
The GK rat was developed by selective breeding of the most hyperglycemic offspring of outbred Wistar rats during nine generations, followed by inbreeding to
gen-erate a strain with stably inherited and spontaneously developing diabetes without concurrent excessive obe-sity (Goto 1975). Progeny from F2 intercrosses
ar-ranged between GK and normoglycemic strains have been subjected to genomewide linkage analyses, and several significant quantitative trait loci (QTL) for diabetes-associated phenotypes have been identified
(Galliet al.1996; Gauguieret al.1996). TheNiddm1i
locus on the telomeric end of rat chromosome 1q is a locus within the major glucose-controlling QTL (Niddm1) in F2intercrosses between GK and the normoglycemic
F344 rat. Studies of the congenic strain NIDDM1I dem-onstrated that Niddm1iGK encoded hyperglycemia and
insulin secretion defects in pancreatic islets (Galliet al.
1999; Fakhrai-Radet al.2000; Linet al.2001).
Genomewide linkage analyses in humans (Duggirala
et al. 1999; Reynisdottir et al. 2003), mice (Stoehr
et al.2000; Kimet al.2001), and the OLETF rat model
(Watanabeet al.1999) have also located QTL for
dia-betes in chromosome regions homologous toNiddm1i, human chromosome 10q24.3–q26.11, and mouse chro-mosome 19. Recently, two genes residing withinNiddm1i
have been associated with diabetes in humans (Tcf7l2;
Grant et al. 2006), and fasting insulin levels in an
obesity-induced mouse model for diabetes (Sorcs1; Clee
et al. 2006). The strong support for contributions to
diabetes-associated phenotypes within theNiddm1ilocus prompted us to undertake a high-resolution genetic
1Corresponding author:Department of Clinical Sciences, Lund
Univer-sity, CRC, Bldg. 91, Floor 11, SE-205 02 Malmo¨, Sweden. E-mail: [email protected]
study of glucose and body-weight regulation. We used a combination of two genotypically different sets of rats: (1) F2progeny from normoglycemic F344 and congenic
NIDDM1I selected for a single recombination event withinNiddm1iand (2) subcongenic strains with homo-zygous GK genotype in different intervals ofNiddm1i. QTL analyses of the F2 progeny were used to narrow
down the confidence intervals for diabetes susceptibility genes, and five subcongenic strains substantiated the presence of four subloci withinNiddm1i.
MATERIALS AND METHODS
Animals:Inbred normoglycemic F344/DuCrl2Swe were
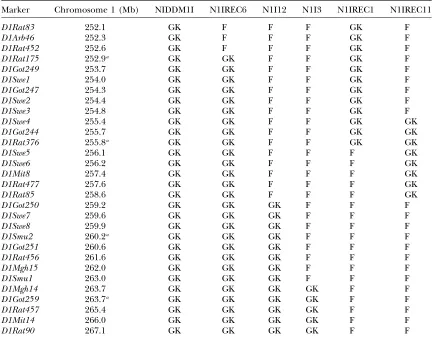
origi-nally purchased from Charles River Laboratories (Wilmington, MA). Diabetic GK/Swe was originally from Kyoto University. Generation of the congenic strain F344.GK-Niddm1i, or NIDDM1I in its shortened form, has been described (Galli et al.1999). It is homozygous for GK from 252 Mb to the end of chromosome 1 at 268 Mb (16 Mb, with the last markerD1Rat90 at 257.1 Mb) on a homozygous F344 genetic background with mitochondrial DNA and chromosomes X plus Y from F344. The congenic F2intercross between F344 and NIDDM1I was initiated from female F344 and male NIDDM1I. Markers D1Rat83andD1Rat90were genotyped in 1594 male progeny to select rats with a single recombination event withinNiddm1i for further testing. This protocol was designed to generate a homogeneous set of animals with recombination events spread throughout the locus. In each marker locus, the expected Mendelian segregation ratio of 1:2:1 in our F2population was not distorted by the genotypic selection procedure. At birth
10 males from different litters were pooled, and at 30 days of age they were weaned and five progeny from different litters were housed per cage. In the end, 210 male progeny had complete genotypic and phenotypic information. The subcon-genic strains N1IREC6, N1I12, N1I3, N1IREC1, and N1IREC11 were generated from F2progeny and carried homozygous GK genome in different segments ofNiddm1ion a homozygous F344 background (Table 1). All strains were maintained by sister–brother breeding. Litter sizes and number of rats per cage were matched in all experiments with congenic strains. Rats were maintained at constant temperature and humidity in a 12-hr cycle of light and dark with free access to standard laboratory chow and water. The local ethics committees ap-proved all experiments.
Phenotypic characterization:To avoid effects of the estrus
cycle and other minor gender-specific influences, only males were included in this study. No major sex-specific effect for Niddm1was seen in the original genomewide scan between GK and F344 (Galliet al.1996). Weight measurements and an intraperitoneal glucose tolerance test (IPGTT) with 2.0 g glucose/kg body weight were performed after 6 hr fasting without anesthesia at 95 days of age (Galliet al.1999).
Genotype analysis:Genomic DNA was extracted from both
ear and tail biopsies. Biopsies were incubated at 55°overnight in 500ml lysis buffer (100 mmTris–HCl, pH 8.0, 5 mmEDTA, 0.2% SDS, 200 mmNaCl) and 0.1 mg/ml proteinase K. The supernatant was cleared by centrifugation at 12,0003gfor 10 min; an equal volume of isopropanol was added, and DNA was collected by centrifugation at 12,0003gfor 30 min, dried, and dissolved in 75ml 10 mmTris–HCl, pH 7.6, 0.1 mmEDTA. Genetic markers were selected from public databases and in-house information and were mapped within theNiddm1i region in 45 (GK3F344)F2 rats (Galli et al. 1996). Eight new microsatellite markers (D1Swe1–8, available at RatMap at http://ratmap.gen.gu.se/) were added in regions lacking
in-formative markers. The PCR profile consisted of: 94°for 4 min, followed by 35 cycles of 94°for 40 sec, 55°for 40 sec, and 72° for 90 sec, with a final 7-min incubation at 72° (markers D1Swe7–8annealed at 50°). PCR amplification was performed with one primer in each pair labeled with [g-33P]ATP or
fluorescence (hex or fam) (DNA technology A/S, Aarhus, Denmark). The locations of markers were taken from Ensembl Rattus Norvegicus version 40.34j based on RGSC 3.4 (http:// www.ensembl.org) (see Table 1).
QTL analyses: Single-marker QTL analysis was performed
on the basis of linear regression using Minitab (Minitab, State College, PA). Conditional probabilities of the QTL genotypes, given the observed marker data, were estimated using the R/qtl package (Bromanet al.2003). These probabilities were used to calculate coefficients of additive and dominance com-ponents for putative QTL at each marker (Lynchand Walsh 1998). Phenotypic values were regressed onto the additive and dominance coefficients at each marker to compute like-lihood ratios (LR) using the following equation:
LR¼n3logeðSSEreduced=SSEfullÞ;
whereSSEfullis the error sums of squares for the full regression model with a QTL at the marker locus, andSSEreducedis total sums of squares for the null model without a QTL.ndenotes the number of observations. The genomic position with the highest LR was taken as the most likely position of a QTL. Multiple-marker QTL analysis was also performed to dissociate multiple linked gene effects during the identification of in-dividual QTL. This was achieved by multiple-regression an-alyses testing the hypothesis of the existence of a QTL at a particular marker conditioned on selected markers as cofac-tors ( Jansen1993; Zeng1993). The cofactors were chosen by a forward selection–backward elimination stepwise regression. The LR test statistic for the multiple-marker QTL analysis was calculated using the same equation as above, whereSSEfullis the error sums of squares for the full model and SSEreducedis the error sums of squares for the reduced model incorporat-ing all the cofactors except the QTL effect at the marker locus. Residuals of each trait were evaluated for normality by exam-ining the normal probability plot of the residuals. Both the multiple regressions and the cofactor selection were conducted using the Minitab program. The numbers for the cofactors are 15-min glucose 3, 30-min glucose 3, and body weight 1.
Multiple testing issues in both the single- and the multiple-marker QTL analyses were addressed by calculation of experiment-wise empirical thresholds using a numerical method
(Piepho 2001). Experiment-wise thresholds for significant
linkage (a¼0.05), and highly significant linkage (a¼0.001) were employed. Experiment-wise 20% significance levels were used as the threshold for suggestive linkage. Thus, we applied a more conservative threshold for suggestive QTL compared with the suggestive threshold used in genomewide scans (Lander and Kruglyak1995). Unless otherwise stated, theP-values are nominal. We applied the 1.5-LOD drop method to estimate support intervals for QTL (Senand Churchill2001).
Evidence for QTL interactions were investigated by two-dimensional scans for all marker pairs withinNiddm1iusing the scantwo function of the R/qtl package (Senand Churchill 2001; Bromanet al.2003). Experiment-wise significance (a¼ 0.05) of a joint LOD was established by 1000 permutations of data (Churchilland Doerge1994). The level of significance for an interaction LOD was set atP,0.05.
RESULTS
The F2progeny were established from a cross between
13.9-cM (16-Mb) genome segment on the telomeric part of chromosome 1 derived from the diabetic GK strain on a F344 genetic background. Only progeny with one recombination event within Niddm1iwere included in the QTL analyses. Subsequently, subcongenic strains were established and genotyped (Table 1).
Single-marker QTL analysis:Single-marker QTL ana-lyses were performed to determine the presence and mode of inheritance of QTL by testing additive and dominant models against the null model (no QTL) at each marker position withinNiddm1i. An experiment-wise highly significant QTL for postprandial glucose at 15 min (G15) during the intraperitoneal glucose toler-ance test (IPGTT) was localized to the distal half of
Niddm1i(Figure 1A; LR¼21.7,P¼33106). This QTL
colocalized with a highly significant QTL for postpran-dial glucose at 30 min (G30, Figure 1B; LR¼17.0,P¼
43105). Maximum LRs for both traits were obtained
at markerD1Smu2. The two QTL were additive and ex-plained 9.9 and 7.9% of the residual phenotypic variance.
The GK allele was associated with higher postprandial glucose levels.
Most proximal in Niddm1i, one significant QTL for body weight was mapped with a negative additive effect of the GK allele (Figure 1C; LR¼10.9,P¼13103).
The body weight of F2progeny homozygous for the GK
allele at this QTL was 5% lower than those homozy-gous for F344 at this locus. The residual variance was reduced by 5.1% by including the QTL in the model. Interestingly, all marker loci showed an additive in-heritance since no dominant effect was observed; and all the identified QTL were best fitted by additive mod-els (data not shown). Therefore we assumed strictly addi-tive alleles in the further QTL analyses. Single-marker QTL analysis of postprandial insulin concentrations was unable to resolve conclusive evidence for distinct insu-lin loci withinNiddm1i(data not shown).
Improved mapping resolution by multiple-marker QTL analysis:Incorporation of markers as cofactors was used to enhance the ability to detect and locate closely
TABLE 1
Microsatellite markers used forNiddm1iand genotypes of congenic NIDDM1I and subcongenic strains
Marker Chromosome 1 (Mb) NIDDM1I N1IREC6 N1I12 N1I3 N1IREC1 N1IREC11
D1Rat83 252.1 GK F F F GK F
D1Arb46 252.3 GK F F F GK F
D1Rat452 252.6 GK F F F GK F
D1Rat175 252.9a GK GK F F GK F
D1Got249 253.7 GK GK F F GK F
D1Swe1 254.0 GK GK F F GK F
D1Got247 254.3 GK GK F F GK F
D1Swe2 254.4 GK GK F F GK F
D1Swe3 254.8 GK GK F F GK F
D1Swe4 255.4 GK GK F F GK GK
D1Got244 255.7 GK GK F F GK GK
D1Rat376 255.8a GK GK F F GK GK
D1Swe5 256.1 GK GK F F F GK
D1Swe6 256.2 GK GK F F F GK
D1Mit8 257.4 GK GK F F F GK
D1Rat477 257.6 GK GK F F F GK
D1Rat85 258.6 GK GK F F F GK
D1Got250 259.2 GK GK GK F F F
D1Swe7 259.6 GK GK GK F F F
D1Swe8 259.9 GK GK GK F F F
D1Smu2 260.2a GK GK GK F F F
D1Got251 260.6 GK GK GK F F F
D1Rat456 261.6 GK GK GK F F F
D1Mgh15 262.0 GK GK GK F F F
D1Smu1 263.0 GK GK GK F F F
D1Mgh14 263.7 GK GK GK GK F F
D1Got259 263.7a GK GK GK GK F F
D1Rat457 265.4 GK GK GK GK F F
D1Mit14 266.0 GK GK GK GK F F
D1Rat90 267.1 GK GK GK GK F F
Genotypes of congenic strains are indicated as F344-derived genome (F) and GK-derived genome (GK).
aApproximate position based of the number of F
linked QTL and to estimate their effects ( Jansen1993;
Zeng1993). The maximum LR test statistics and QTL
map positions obtained with multiple-marker QTL analy-sis were very similar to those obtained with
single-marker regression (Table 2). The explained residual variances were also of similar magnitude. However, the 1.5-LOD support intervals (SIs) for the QTL identified by multiple-marker regression were considerably nar-rower than those for the single-marker regression. Whereas SIs of the major loci atD1Smu2for G15 and G30 based on single-marker QTL analysis were .6.0 Mb, they were reduced to 0.7 Mb by multiple-marker QTL analysis (Figure 1, A and B; Table 2). The location of the QTL for body weight was narrowed down to a 0.8-Mb interval betweenD1Rat83andD1Rat175(Table 1, Figure 1C). The QTL affecting body weight was desig-nated Niddm1i1 and the major hyperglycemia QTL linked withD1Smu2was denotedNiddm1i4.
Applying multiple-marker QTL analysis revealed two additional QTL for G15 at markersD1Swe2andD1Got244, separate from the major hyperglycemia locus atD1Smu2
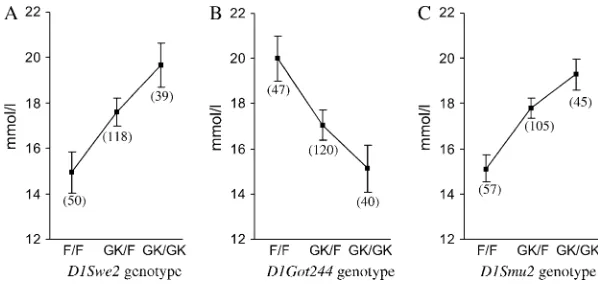
(Figure 1A). Surprisingly, while the GK allele atD1Swe2
was associated with higher glucose concentration, the opposite effect was seen for the GK allele atD1Got244
(Table 2, Figure 2). The effect sizes of the two opposing loci were of a similar magnitude (12.4 and2.6 mmol/ liter) and comparable to that of the locus at D1Smu2
(Table 2, Figure 2). The hyperglycemia locus atD1Swe2
was denotedNiddm1i2, and the adjacent QTL with an opposite effect of the GK allele was denotedNiddm1i3. We found no evidence of interaction between any two loci after examining all pairwise combinations of marker loci for associations with the traits.
Analysis of subcongenic strains: To substantiate the presence of multiple loci regulating diabetes-associated phenotypes within Niddm1i, a set of five subcongenic strains containing homozygous GK-derived segments cov-ering parts of the locus were phenotypically investi-gated (Table 1). Glucose homeostasis during IPGTT in congenic NIDDM1I was, as previously described (Galli
et al. 1999), impaired compared with F344 (Table 3).
N1IREC6, with the entire Niddm1i locus except for 0.8 Mb in the most proximal end, was also hyperglyce-mic compared with F344. In addition, N1I12, harboring GK-derived genome in the 9-Mb distal end ofNiddm1i, displayed a 13% increase in G15 and a 14% increase in G30. Three subcongenic strains did not show increased glucose levels compared with F344. These were N1IREC1, with a 4-Mb GK genotype most proximal in Niddm1i; N1IREC11, with a 3-Mb GK genotype within the proxi-mal half ofNiddm1i; and N1I3, with a 4-Mb GK genotype in the most distal end ofNiddm1i(Table 1 and Table 3). This supported the presence of the major hyperglyce-mic locusNiddm1i4(D1Smu2) in the genomic interval differing between N1I12 and N1I3. In fact, N1IREC11 with GK genotype in the proximal half ofNiddm1ishowed an improved glucose homeostasis compared with F344, which substantiated the location ofNiddm1i3(where the GK haplotype resulted in lower postprandial glucose concentration). The lower glucose levels of N1IREC11 were not simply an effect of the significantly lower body
Figure 1.—Single- and multiple-marker QTL analyses of
weight of N1IREC11, since the levels remained different after adjustment for the effect of body weight on glucose concentration in plasma (data nor shown). The N1IREC1 congenic strain covers both Niddm1i2 and Niddm1i3
(Tables 1 and 2); therefore the glucose-lowering ef-fect ofNiddm1i3 would be expected to counteract the glucose-elevating effect ofNiddm1i2. This was also seen, since N1IREC1 did not display an improved glucose homeostasis compared with F344. There is no congenic strain with the GK genome solely in theNiddm1i2 lo-cus; as a result we could obtain only indirect evidence for the presence ofNiddm1i2 by comparing N1IREC1 with N1IREC11 (P¼0.02 for G15,P¼0.01 for G30).
There was no difference in body weight between NIDDM1I and F344 (Table 3). However, the presence of a body-weight-reducing QTL encoded by the GK hap-lotype was confirmed most convincingly by the differ-ence in body weight between NIDDM1I and N1IREC6. NIDDM1I, differing from N1IREC6 only in the 0.8 Mb most proximal part ofNiddm1i(Table 1), had 7% lower body weight compared with N1IREC6 (Table 3,P¼33
106). This confirmed the localization of Niddm1i1 to
the small GK-derived segment most proximal inNiddm1i.
In the congenics, theNiddm1i1GKeffect is penetrant only
in the two congenic strains (N1IREC6 and N1I12) that also harbor GK alleles in the region differing between N1I12 and N1I3 (D1Got250toD1Smu1), since N1IREC1 with GK genotype at Niddm1i1 did not display lower body weight than F344. Hence, an explanation of this observation would be the presence of additional loci for body weight betweenD1Got250andD1Smu1(Niddm1i4). Indeed, in the F2 progeny there was an indication of
three linked loci with opposite effects on body weight in this region. These three indicated body-weight QTL mapped within a genetic distance considerably shorter than for postprandial glucose atD1Swe2andD1Got244
(Niddm1i2 and Niddm1i3). As a result, there were too
few recombinants to significantly resolve and map these potential loci (data not shown). Furthermore, the N1IREC11 congenic strain was significantly lighter than F344, indicating the presence of an additional body-weight locus betweenD1Swe4andD1Rat85that was not observed in the F2progeny.
NIDDM1I and N1IREC6 were the only strains that displayed significantly lower postprandial insulin levels compared with F344 (Table 3). N1IREC11, containing
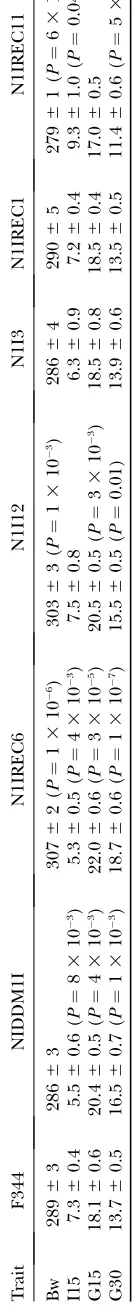
TABLE 2
Quantitative trait loci for diabetes-associated traits identified by multiple-marker QTL analysis
QTL Marker6SI (Mb)a Trait LRb NominalP-value Effectc6SE Vard% No. of genese
Niddm1i1 D1Rat8310.8 Bw 11.0** 13103 6.862.0 5.1 13
Niddm1i2 D1Swe260.25 G15 8.5* 33103 12.460.8 4.0 2
G30 4.1 0.04 11.460.7 2.0
Niddm1i3 D1Got24460.2 G15 8.3* 43103 2.660.9 3.9 1
G30 4.3 0.04 1.560.7 2.1
Niddm1i4 D1Smu260.35 G15 20.9*** 53106 12.260.5 9.6 7
G30 15.6** 83105 11.560.4 7.2
Bw, body weight (grams); G15, postprandial glucose at 15 min, and, G30 at 30 min in mmol/liter.
aSI for QTL support intervals estimated by the 1.5-LOD drop method; Mb, megabase pair.
bLR denotes the likelihood ratio test statistic for QTL and level of significance: *suggestive experiment-wise significance (a¼
0.2); **significant experiment-wise significance (a¼0.05); ***highly significant experiment-wise significance (a¼0.001).
cAdditive effect defined as AA-BB/2, where AA is the genotypic value for GK homozygotes at the QTL, and BB is the genotypic
value for F344 homozygotes; SE, standard error.
d
Var is percentage of phenotypic residual variance explained by the QTL.
e
The number of positional candidate genes within the QTL interval using NCBI assembly 3.4 of the rat genome.
Figure2.—The effect of QTL on the 15-min
GK genome at the glucose-lowering locusNiddm1i3, dis-played higher insulin levels compared with F344, which supported its improved glucose control. The phenotype displayed by N1IREC11 demonstrated that the GK hap-lotype betweenD1Swe4andD1Rat85encodes a complex pattern of diabetes-associated phenotypes (low glucose, high insulin, and low body weight).
Figure 3 portrays a summary of the location of the breakpoints for subcongenic strains and a summary of significant additive effects on diabetes-associated phe-notypes withinNiddm1i.
DISCUSSION
Development of type 2 diabetes involves variations in a large number of genes, and although the identities of some have been elucidated, several more are likely to contribute to the loss of normal glucose control and type 2 diabetes. By studying animal models of type 2 diabetes, environmental factors affecting expression of disease-associated phenotypes can be better controlled. Construction of congenic strains and substrains has become a widely used method to isolate and narrow chromosomal regions containing susceptibility genes for genetically complex diseases. NIDDM1I harboring 16 Mb from the diabetic GK strain provides a unique pos-sibility to combine mechanisms causing altered glucose homeostasis with detailed genetic information (Galli
et al. 1999; Fakhrai-Rad et al. 2000; Lin et al. 2001).
However, the map resolutions obtained from congenic
T ABLE 3 Phenotypic characterization of F344, NIDDM1I, and subcongenic strains T rait F344 NIDDM1I N1IREC6 N1I12 N1I3 N1IREC1 N1IREC11 Bw 289 6 3 286 6 3 307 6 2( P ¼ 1 3 10 6) 303 6 3( P ¼ 1 3 10 3) 286 6 4 290 6 5 279 6 1( P ¼ 6 3 10 3) I15 7.3 6 0.4 5.5 6 0.6 ( P ¼ 8 3 10 3) 5.3 6 0.5 ( P ¼ 4 3 10 3) 7.5 6 0.8 6.3 6 0.9 7.2 6 0.4 9.3 6 1.0 ( P ¼ 0.04) G15 18.1 6 0.6 20.4 6 0.5 ( P ¼ 4 3 10 3) 22.0 6 0.6 ( P ¼ 3 3 10 5) 20.5 6 0.5 ( P ¼ 3 3 10 3) 18.5 6 0.8 18.5 6 0.4 17.0 6 0.5 G30 13.7 6 0.5 16.5 6 0.7 ( P ¼ 1 3 10 3) 18.7 6 0.6 ( P ¼ 1 3 10 7) 15.5 6 0.5 ( P ¼ 0.01) 13.9 6 0.6 13.5 6 0.5 11.4 6 0.6 ( P ¼ 5 3 10 3 V alues are mean 6 SEM at 95 days of age. Bw , body weight (grams) for 22–26 rats/strain; I15, postprandial insulin ( m g/liter) at 15 min; G15, postprandial glucose at 15 min and 30 min (G30) in mmol/liter for 12–18 rats per strain during IPGTT . Phenotypes for the congenic strains were compared with those for F344 and evaluat ed by an unpaired Student t -test. Nominal P -values , 0.05 are indicated.
Figure3.—Congenic strains withinNiddm1iand locations
strains are often not appropriate for identifying in-dividual genes underlying a QTL. Theoretical ap-proaches to improve the precision estimates of QTL position by inclusion of cosegregation at many genomic segments affecting the trait of interest have been re-ported (Jansen1993; Zeng1993). Also, improved map
resolution can be achieved by selecting recombinants in the chromosome region (Darvasi 1998; Roninet al.
2003; Jinet al.2004; Xuet al.2005). To refine genomic
segments within Niddm1i coding for phenotypes rele-vant to type 2 diabetes, we performed multiple QTL analyses incorporating the effect of cosegregating QTL as cofactors using genetically selected progeny.In toto, one highly significant locus (Niddm1i4) and two sugges-tive loci (Niddm1i2 and Niddm1i3) were identified for postprandial glucose levels. The two suggestive QTL for glucose and one significant locus (Niddm1i1) for body weight were confirmed by independent characterization of the same phenotypes in subcongenics. The mapping data in this study confirm the theoretical predictions that data analyses based on more precise statistical ge-netic models for QTL analysis and a large number of recombinants are crucial factors for improving QTL mapping resolution for dissection of the genetic basis of quantitative traits such as type 2 diabetes susceptibility
(Visscher et al. 2000). The mapping resolutions of
Niddm1i1–Niddm1i4were all,1 Mb (Figure1, Table 2).
The considerable genetic complexity displayed in
Niddm1i is presumably a reflection of the selection
protocol used to establish the diabetic GK strain (Goto
1975). Allelic fixation in genomic regions responding to strong selection is expected during establishment of GK. Closely linked QTL with opposite effects encoded by the same haplotype could occur, since selection oper-ates on the net genotypic effect of several linked genes. Two inbred strains like GK and F344 represent only a limited fraction of the naturally occurring genetic varia-tion (polymorphism) in the original populavaria-tion (Flint
and Mott2001). Therefore, it is tantalizing to note the
species-conserved character ofNiddm1i, emphasizing the relevance of genetic investigations of the region as a major type 2 diabetes locus. Despite the substantial com-plexity of theNiddm1iQTL, it is still readily amenable to achieving high-resolution mapping of QTL and to identifying genes that regulate mechanisms behind the phenotypic variation associated with common diseases such as type 2 diabetes.
A number of genes within Niddm1i are involved in pathways that may be important to energy metabolism, apoptosis, and insulin secretion, which are critical fac-tors associated with the risk for diabetes. This high-resolution study has narrowed down the number of diabetes-associated candidate genes considerably. The 800-kb genome segment corresponding toNiddm1i1is gene rich and harbors 13 annotated genes, with
USMG5 (upregulated during skeletal muscle growth 5, or
DAPIT/LZAP) as a possible candidate (Paivarinneand
Kainulainen2001). The two loci with opposing effect
on glucose levels encoded by the GK alleles (Niddm1i2
andNiddm1i3) have exceptionally few identified
protein-coding genes:Sorcs3and a transposase from an L1 repeat
in Niddm1i2, andSorcs1withinNiddm1i3. Sorcs1was
re-cently identified as a type 2 diabetes susceptibility gene in the mouse (Cleeet al.2006). It is therefore
conceiv-able thatSorcs3also might be involved in the pathogen-esis of diabetes. The Niddm1i4 hyperglycemia locus covers a 700-kb genome interval with 7 known genes, including the gene for programmed cell death 4, three genes without known functions, one microRNA gene, the leucine-rich repeat protein SHOC2 (Selforset al.1998),
and the a-2-adrenergic receptor ADRA2A (Devedjian
et al.2000). The gene encoding TCF7L2 is located 1.4 Mb
distally ofNiddm1i4and is not a probable candidate for the phenotype encoded by this QTL identified using re-gression models with cofactors selected by the stepwise regression procedure.
In conclusion, the combined analysis of genotypically selected F2 progeny and subcongenic rat strains has
revealed an intricate pattern of genetic effects, which are amenable to experimental dissection and subse-quent molecular identification of disease mechanisms. Four QTL for phenotypes highly relevant to type 2 diabetes were mapped to intervals ,1 Mb and several positional candidate genes have been selected for studies of their relevance to this disease. The complex genetic interplay between several diabetes susceptibility loci under controlled environmental conditions, as reported here, emphasizes the need for caution when attempting to identify disease mechanisms and risk alleles in the genetically and environmentally heteroge-neous human population.
We thank Hans-Peter Piepho for discussions regarding thresholds for QTL analysis; Annika Andersson, Cecilia Johansson, and Berit Rydlander for genotyping; Martha Nordberg for breeding and phenotyping; Johannes Luthman for contributions to the design and accomplishment of F2progeny and congenic strains; and Agneta Petersson for phenotyping. Joakim Galli established the N1IREC series of congenics. This study was supported by grants from the Swedish Research Council, Swedish Diabetes Association, the Medical Faculty of Lund University, Malmo¨ University Hospital, MAS Stiftelser och Ga˚vor, and Albert Pa˚hlsson Research Foundation.
LITERATURE CITED
Aitman, T. J., A. M. Glazier, C. A. Wallace, L. D. Cooper, P. J.
Norsworthyet al., 1999 Identification of Cd36 (Fat) as an
insulin-resistance gene causing defective fatty acid and glucose metabolism in hypertensive rats. Nat. Genet.21:76–83. Broman, K. W., H. Wu, S. Senand G. A. Churchill, 2003 R/qtl: QTL
mapping in experimental crosses. Bioinformatics19:889–890. Churchill, G. A., and R. W. Doerge, 1994 Empirical threshold
val-ues for quantitative trait mapping. Genetics138:963–971. Clee, S. M., B. S. Yandell, K. M. Schueler, M. E. Rabaglia, O. C.
Richards et al., 2006 Positional cloning of Sorcs1, a type 2
diabetes quantitative trait locus. Nat. Genet.38:688–693. Darvasi, A., 1998 Experimental strategies for the genetic dissection
of complex traits in animal models. Nat. Genet.18:19–24. Devedjian, J. C., A. Pujol, C. Cayla, M. George, A. Casellaset al.,
in pancreatic beta-cells show altered regulation of glucose ho-meostasis. Diabetologia43:899–906.
Duggirala, R., J. Blangero, L. Almasy, T. D. Dyer, K. L. Williams
et al., 1999 Linkage of type 2 diabetes mellitus and of age at on-set to a genetic location on chromosome 10q in Mexican Amer-icans. Am. J. Hum. Genet.64:1127–1140.
Fakhrai-Rad, H., A. Nikoshkov, A. Kamel, M. Fernstro¨ m, J. R.
Zierathet al., 2000 Insulin-degrading enzyme identified as a
candidate diabetes susceptibility gene in GK rats. Hum. Mol. Genet.14:2149–2158.
Flint, J., and R. Mott, 2001 Finding the molecular basis of
quan-titative traits: successes and pitfalls. Nat. Rev. Genet.2:437–445. Galli, J., L. S. Li, A. Glaser, C. G. Ostenson, H. Jiao et al.,
1996 Genetic analysis of non-insulin dependent diabetes melli-tus in the GK rat. Nat. Genet.12:31–37.
Galli, J., H. Fakhrai-Rad, A. Kamel, C. Marcus, S. Norgrenet al.,
1999 Pathophysiological and genetic characterization of the major diabetes locus in GK rats. Diabetes48:2463–2470. Gauguier, D., P. Froguel, V. Parent, C. Bernard, M. T. Bihoreau
et al., 1996 Chromosomal mapping of genetic loci associated with non-insulin dependent diabetes in the GK rat. Nat. Genet. 12:38–43.
Goto, Y., M. Kakizakiand N. Masaki, 1975 Spontaneous diabetes
produced by selective breeding of normal Wistar rats. Proc. Jpn. Acad.51:80–85.
Grant, S. F., G. Thorleifsson, I. Reynisdottir, R. Benediktsson,
A. Manolescuet al., 2006 Variant of transcription factor 7-like
2 (TCF7L2) gene confers risk of type 2 diabetes. Nat. Genet.38: 320–323.
Iselius, L., J. Lindsten, N. E. Morton, S. Efendic, E. Cerasiet al.,
1985 Genetic regulation of the kinetics of glucose-induced in-sulin release in man. Studies in families with diabetic and non-diabetic probands. Clin. Genet.28:8–15.
Jansen, R. C., 1993 Interval mapping of multiple quantitative trait
loci. Genetics135:205–211.
Jin, C., H. Lan, A. D. Attie, G. A. Churchill, D. Bulutugloet al.,
2004 Selective phenotyping for increased efficiency in genetic mapping studies. Genetics168:2285–2293.
Kim, J. H., S. Sen, C. S. Avery, E. Simpson, P. Chandleret al.,
2001 Genetic analysis of a new mouse model for non-insulin-dependent diabetes. Genomics74:273–286.
Lander, E., and L. Kruglyak, 1995 Genetic dissection of complex
traits: guidelines for interpreting and reporting linkage results. Nat. Genet.11:241–247.
Lehtovirta, M., J. Kaprio, C. Forsblom, J. Eriksson, J. Tuomilehto
et al., 2000 Insulin sensitivity and insulin secretion in monozy-gotic and dizymonozy-gotic twins. Diabetologia43:285–293.
Lin, J. M., H. Ortsater, H. Fakhrai-Rad, J. Galli, H. Luthman
et al., 2001 Phenotyping of individual pancreatic islets locates genetic defects in stimulus secretion coupling to Niddm1i within the major diabetes locus in GK rats. Diabetes50:2737–2743. Lynch, M., and B. Walsh, 1998 Genetics and Analysis of Quantitative
Traits.Sinauer Associates, Sundrland, MA.
M , F., M. H , A. I , D. A. P and R. D. L ,
1999 Concordance rate for type II diabetes mellitus in monozy-gotic twins: actuarial analysis. Diabetologia42:146–150. Paivarinne, H., and H. Kainulainen, 2001 DAPIT, a novel
pro-tein down-regulated in insulin-sensitive tissues in streptozotocin-induced diabetes. Acta Diabetol.38:83–86.
Permutt, M. A., J. Wassonand N. Cox, 2005 Genetic epidemiology
of diabetes. J. Clin. Invest.115:1431–1439.
Piepho, H. P., 2001 A quick method for computing approximate
thresholds for quantitative trait loci detection. Genetics 157: 425–432.
Poulsen, P., K. O. Kyvik, A. Vaagand H. Beck-Nielsen, 1999
Heri-tability of type II (non-insulin-dependent) diabetes mellitus and abnormal glucose tolerance—a population-based twin study. Diabetologia42:139–145.
Poulsen, P., K. Levin, I. Petersen, K. Christensen, H. Beck-Nielsen
et al., 2005 Heritability of insulin secretion, peripheral and he-patic insulin action, and intracellular glucose partitioning in young and old Danish twins. Diabetes54:275–283.
Reynisdottir, I., G. Thorleifsson, R. Benediktsson, G. Sigurdsson,
V. Emilssonet al., 2003 Localization of a susceptibility gene for
type 2 diabetes to chromosome 5q34-q35.2. Am. J. Hum. Genet. 73:323–335.
Ronin, Y., A. Korol, M. Shtemberg, E. Nevo and M. Soller,
2003 High-resolution mapping of quantitative trait loci by se-lective recombinant genotyping. Genetics164:1657–1666. Selfors, L. M., J. L. Schutzman, C. Z. Borlandand M. J. Stern,
1998 soc-2 encodes a leucine-rich repeat protein implicated in fibroblast growth factor receptor signaling. Proc. Natl. Acad. Sci. USA95:6903–6908.
Sen, S., and G. A. Churchill, 2001 A statistical framework for
quan-titative trait mapping. Genetics159:371–387.
Stoehr, J. P., S. T. Nadler, K. L. Schueler, M. E. Rabaglia, B. S.
Yandellet al., 2000 Genetic obesity unmasks nonlinear
interac-tions between murine type 2 diabetes susceptibility loci. Diabetes 49:1946–1954.
Watanabe, T. K., S. Okuno, K. Oga, A. Mizoguchi-Miyakita, A.
Tsujiet al., 1999 Genetic dissection of ‘‘OLETF,’’ a rat model
for non-insulin-dependent diabetes mellitus: quantitative trait locus analysis of (OLETF3BN)3OLETF. Genomics58:233– 239.
Visscher, P., J. Whittakerand R. Jansen, 2000 Mapping multiple
QTL of different effects: comparison of a simple sequential testing strategy and multiple QTL mapping. Mol. Breed. 6: 11–24.
Xu, Z., F. Zouand T. J. Vision, 2005 Improving quantitative trait loci
mapping resolution in experimental crosses by the use of geno-typically selected samples. Genetics170:401–408.
Zeng, Z. B., 1993 Theoretical basis for separation of multiple linked
gene effects in mapping quantitative trait loci. Proc. Natl. Acad. Sci. USA90:10972–10976.