Division III
Multi-damping Spectral Matching for the Seismic Analysis of Nuclear
Power Plant Structures Based on Windowed Adjustment Function
Dookie Kim1, Sang-Hoon Lee2 and Kaiser Ahmed3
1
Professor, Dept. of Civil Engineering, Kunsan National University, South Korea
2 Seismic Analysis Specialist, KEPCO E&C Co., Giheung-gu, Yongin-si, Gyeonggi-do, South Korea 3
Researcher, Dept. of Civil Engineering, Kunsan National University, South Korea
ABSTRACT
The latest design response spectrum requires a better preservation technique in phase angles and avoidance of any shift in matched time history. This research presents an improved iterative spectral matching method in the time domain for generating acceleration time series compatible with the target design spectrum. The spectral matching is achieved for several standard frequencies and damping value simultaneously. The proposed method suggests an iterative technique via implementing windowed displacement impulse function for correcting the input acceleration time series to match the design spectrum for every frequency and damping values. Additional enhancement is carried out by applying a scale factor to achieve the spectral matching with accuracy and convergence enhancements. With an improved coherence in phase angles the effect of windowing on the adjustment function proves that the proposed method is effective over previous techniques in reducing the distortion of matched ground motions.
INTRODUCTION
For the time history analysis of NPP structures, a more complex time-consuming dynamic nonlinear analysis is applied. Therefore, seed time series are selected from real recorded earthquakes and the response spectra corresponding to the seed time series should be similar in shape to the target spectra across the frequency range of interest to the analysis (e.g., Houston, et al., 2010) and phasing characteristics of the real time series should be preserved (U.S. NRC SRP 3.7.1, 2012).
Various techniques that attempt to generate acceleration time series whose response spectrum closely matches the target design spectrum have been proposed. Kaul (1978) was the pioneer to propose a time domain spectral matching method. However, his method was limited for matching at one damping only. Thereafter Lilhanad and Tseng (1987) have extended the method by Kaul (1978) to develop design spectra-compatible acceleration time series that well matching with the target design spectra at several damping values simultaneously. However, the method did not preserve the nonstationary characteristics of the initial time series, and it has suffered several over-constrained mathematical problem such converging to a meaningless values, particularly when more than two damping values are used simultaneously (Choi and Lee, 2003). In addition, although the improved method by (Al Atik and Abrahamson, 2010) has suggested a new adjustment function that does not require base line correction, the modified time series are shifted as a result of zero-padding at the beginning of the acceleration time series.
PROPOSED TIME DOMAIN SPECTRAL MATCHING METHOD
In the first step, the correction of the selected recorded or artificial acceleration time series is calculated by applying the windowed adjustment function to the initial time series separately at every frequency and damping value. Applying the windowed impulse response function for each frequency and damping value reduces the distortion of the modified time series that occur when forcing the spectral matching of numerous several points simultaneously. Thereafter, in the second step, the spectral matching in every iteration cycle is significantly improved by applying a constant (scale factor).
First, artificial or real recorded acceleration time series are used as the reference time series that generally do not match with the target design response spectra. The reference acceleration time series can be described by the sum of sinusoids and phase angles as follows,
̈ ( ) = A sin( + ) (1)
Where ̈ ( ) is the reference acceleration time series, A is the amplitude, is the frequency, is the phase angle of the contributing sinusoid, and is time. The response of a single-degree-of-freedom-system (SDOF) can be obtained using the following formula,
̈ ( ) + 2 ̇ ( ) + ( ) = − ̈ ( ) (2)
Where ( ), ̇ ( ), and ̈ ( ) are the relative displacement, velocity, and acceleration response time series, respectively, and are the natural frequency and the damping value of the oscillator, respectively. The spectral adjustment which is the spectral difference between the target design spectrum and the time series spectrum at a given frequency and damping , is given by,
, = , + , (3a)
For the design of long-period structures, the spectral displacements rather than spectral accelerations are required. Present method suggests displacement spectral values rather than using acceleration spectral values to evaluate the spectral adjustment can be expressed as,
, = , + , (3b)
, = , (4)
Where , is the displacement spectral value of the reference time series, , is the spectral value of the target design spectrum, , is the spectral difference.
Windowing of displacement impulse function
In this step, the spectral adjustment is performed at one frequency and one damping value at a time using the unit response impulse function. The spectral difference between the spectral response of the reference time series and the target design response spectrum at frequency and damping is expressed as
, = ( )ℎ , −
,
Where is the coefficients (amplitudes) of the adjustment function ( ), and ℎ is the impulse function of a single-degree-of-freedom system (SDOF) at frequency and damping , and is the integration time parameter. The value to be determined at the frequency and damping of the maximum spectral difference , as follows,
, = = ( )ℎ , −
,
(6)
Where is the convolution of adjustment function and impulse response function, and , is the time of the peak response. The adjustment function is incorporating Hann Window ( ). The windowed adjustment function of a SDOF oscillator can be expressed as
( ) = ( )ℎ , − (7)
Where
ℎ ( ) = 1
,
( )
,( ) (8)
, = 1 − (9)
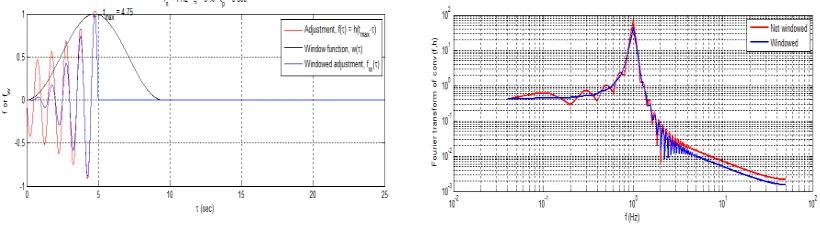
Figure 1 shows reverse impulse response function (left) and adjustment function (right) at 1 . Therefore, the correction of the reference time series is obtained by,
̈ ( ) = , − (10)
Where ̈ ( ) is the acceleration adjustment. Finally, the corrected acceleration time series for iteration (n+1) can be obtained from the previous iteration (n) as
̈ ( ) = ̈ ( ) + ̈ ( ) (11)
These steps are repeated until the desired accuracy of the spectral matching is achieved for the target frequency and damping value.
Figure 1. Reverse Impulse response function (left) and adjustment function (right) at 1 .
function and Hann window called windowed adjustment function which matches the time of peak response of adjustment function. Figure 1(right) represent the Fourier transform of the convolution of adjustment function and impulse response function at frequency 1 Hz that yield less distorted result comparatively.
Scaling of adjusted time series
Scaling the corrected time histories and accordingly scaling their response spectra leads to improved convergence and hence more accurate spectral matching with the target design spectra. Therefore, the proposed method recommends multiplying the corrected time history by a constant (scaling factor) as a step two in its procedure. The design spectra are scaled by multiplying the scale factor by two control points of the design spectra at 9 and 2.5 , respectively. The scale factor can be expressed as,
= 1 − + (12)
Where and are the spectral mean and standard deviation between the corrected time histories and the design response spectrum at damping value and for iteration cycle , while is a constant related to the spectral standard deviation at each iteration.
ILLUSTRATION OF PROPOSED METHOD
Selected Ground Motions
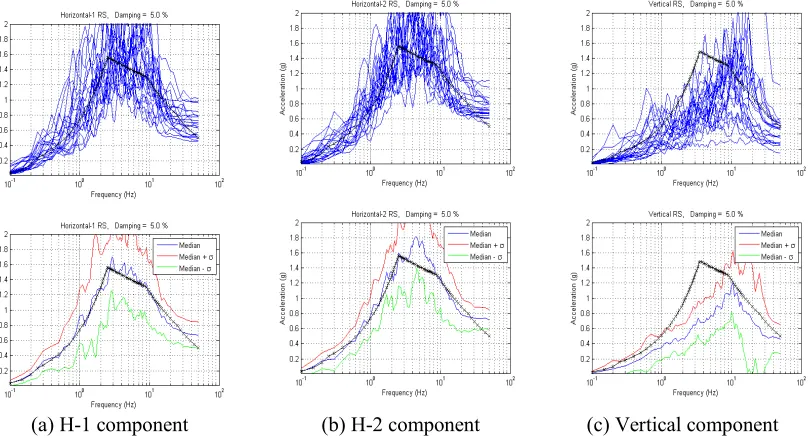
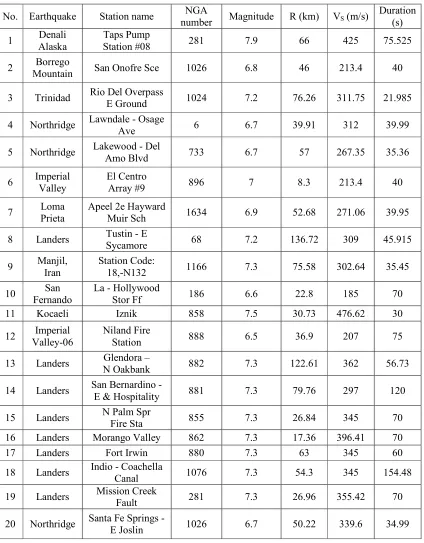
For illustrating the proposed iterative method, twenty sets of earthquake time series were selected from the Pacific Earthquake Engineering Research (PEER) Center NGA Strong Motion Database (PEER, 2014). Table 1 provides further details on earthquake name, recording station name, NGA number, magnitude, distance to epicenter, shear wave velocity, and duration of the selected ground motions. Figure 3 illustrates the acceleration response spectra of the three components of the selected scaled initial time series at 5% damping for the median and standard deviation confidence level at 0.5 peak ground acceleration. The scaling on initial (reference) acceleration time series has been applied in the time domain.
(a) H-1 component (b) H-2 component (c) Vertical component
Table 1: Selected twenty sets of earthquake.
No. Earthquake Station name NGA
number Magnitude R (km) VS (m/s)
Duration (s)
1 Denali Alaska
Taps Pump
Station #08 281 7.9 66 425 75.525
2 Borrego
Mountain San Onofre Sce 1026 6.8 46 213.4 40
3 Trinidad Rio Del Overpass
E Ground 1024 7.2 76.26 311.75 21.985
4 Northridge Lawndale - Osage
Ave 6 6.7 39.91 312 39.99
5 Northridge Lakewood - Del
Amo Blvd 733 6.7 57 267.35 35.36
6 Imperial Valley
El Centro
Array #9 896 7 8.3 213.4 40
7 Loma
Prieta
Apeel 2e Hayward
Muir Sch 1634 6.9 52.68 271.06 39.95
8 Landers Tustin - E
Sycamore 68 7.2 136.72 309 45.915
9 Manjil, Iran
Station Code:
18,-N132 1166 7.3 75.58 302.64 35.45
10 San
Fernando
La - Hollywood
Stor Ff 186 6.6 22.8 185 70
11 Kocaeli Iznik 858 7.5 30.73 476.62 30
12 Imperial Valley-06
Niland Fire
Station 888 6.5 36.9 207 75
13 Landers Glendora –
N Oakbank 882 7.3 122.61 362 56.73
14 Landers San Bernardino -
E & Hospitality 881 7.3 79.76 297 120
15 Landers N Palm Spr
Fire Sta 855 7.3 26.84 345 70
16 Landers Morango Valley 862 7.3 17.36 396.41 70
17 Landers Fort Irwin 880 7.3 63 345 60
18 Landers Indio - Coachella
Canal 1076 7.3 54.3 345 154.48
19 Landers Mission Creek
Fault 281 7.3 26.96 355.42 70
20 Northridge Santa Fe Springs -
E Joslin 1026 6.7 50.22 339.6 34.99
It can be noticed from Figure 3 that the median of the horizontal components of the scaled initial time series shows higher compatibility with the design spectrum than the vertical component. The median response spectra of the vertical component show low spectral matching with the design spectrum, particularly in the low frequency content (<1 ).
= − (13)
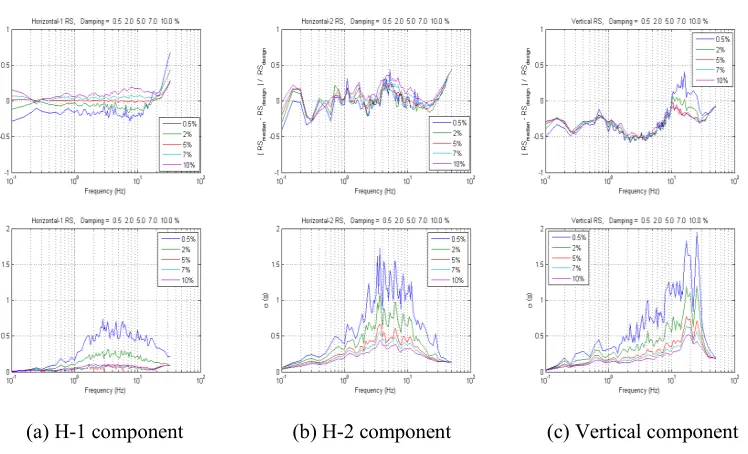
(a) H-1 component (b) H-2 component (c) Vertical component
Figure 4 Spectral error of the scaled initial time series.
Multi-damping design spectra-compatible time series
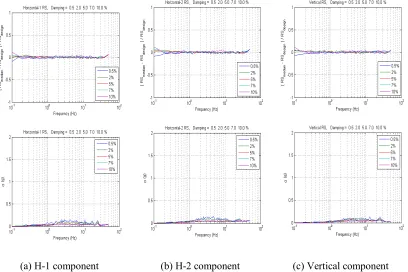
The proposed method has been applied to match the initial acceleration time series with the target design response spectrum at several damping values. The typical frequency point-by-point spectrum compatibility plot for the three components of the design spectra-compatible response spectra of the modified time series is introduced in this section. This spectrum compatibility comparison is considered reliable on ensuring the efficiency of the spectrum compatibility (Aziz, 2004). The acceleration response spectra of the modified time series and the target design spectrum at 5% damping are shown in Figure 5.
It can be noticed from Figure 5 that the response spectra of the modified time series are well matching with the target design spectrum, particularly at the low frequency content. In addition, imperfect spectral matching can be noticed at the high frequency range for few time series with frequencies larger than 15 . However, the median response spectra of the modified time series are perfectly matching with the target design spectra along the whole frequency content. Similarly, the acceleration response spectra for different damping values (0.5% to 10%) were checked.
content. In addition, the standard deviation of the spectral error decreases when increasing the damping value.
(a) H-1 component (b) H-2 component (c) Vertical direction
Figure 5 Acceleration response spectral of the three components of the modified time series at 5% damping.
(a) H-1 component (b) H-2 component (c) Vertical component
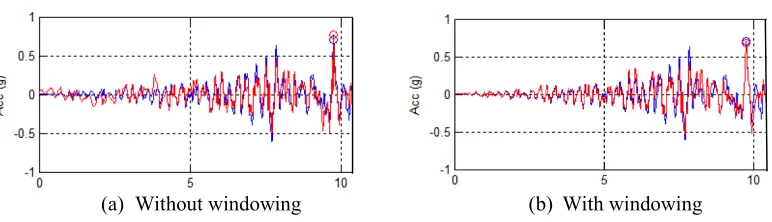
(a) Without windowing (b) With windowing
Figure 7 Matched time histories.
Figure 7 clearly demonstrate the accuracy and improvement of matching efficiency between two methods. The left figure represent method previously Choi and Lee, 2003 suggested, where right one represent the current method. From this figure it is clearly seen that current method improves the previous method of seed acceleration time histories matching technique in time domain.
CONCLUSIONS
The current study reports an iterative spectral matching method in the time domain to correct the acceleration time series to be consistent with the modified multi-damping design spectrum between 9 and 50 considering the effect of windowed adjustment function. Investigating the influence of the proposed spectral matching method indicates the following:
The median of the acceleration response spectra of the generated ground motions by the proposed method illustrates well spectral matching for all damping values and for all the frequency range including the high frequency contents.
The results of the spectral error of the median response spectra of the modified time series to the design response spectra indicate that the response spectra of the modified time series envelop the design response spectral for all the damping values which satisfied the U.S. NRC regulations. Finally, the proposed method is convincing to start using and applying limited number of input
acceleration time series that matching with the target design spectrum in the dynamic nonlinear analysis and design of the NPP instead of the costly and time consuming analysis with multi-input time series.
ACKNOWLEDGMENT
This work was supported by the Nuclear Power Core Technology Development Program of the Korea Institute of Energy Technology Evaluation and Planning (KETEP) grant financial resource from the Ministry of Trade, Industry & Energy, Republic of Korean (No. 2014151010170A).
REFERENCES
Houston, T.W., Mertz, G.E., Costantino, M.C., and Costantino, C. J., 2010. “Investigation of the impact of seed record selection on structural response.” Proceedings of the 2010 ASME PVP Conference, Division K, Paper 25919, Bellevue Washington, July 18-22.
U.S. NRC, 1973a. “Design response spectra for seismic design of nuclear power plants.” Regulatory Guide 1.60, Rev. 1.
U.S. NRC, 1973b. “Design response spectra for seismic design of nuclear power plants.” Regulatory Guide 1.61.
Choi, D.H. and Lee, S.H., 2003. “Multi-damping earthquake design spectra-compatible motion histories.” Nuclear Engineering and Design, 226(3), 221-230.
Al Atik, L. and Abrahamson, N.A., 2010. “An improved method for nonstationary spectral matching.” Earthquake Spectra, 26(3), 601-617.
Tsai, N.C., 1972. “Spectrum-compatible motions for design purposes.” Journal of the Engineering Mechanics Division, ASCE, 98(2), 345-356.
Lilhanand, K. and Tseng, W.S., 1988. “Development and application of realistic earthquake time histories compatible with multiple damping design spectra.” Proceedings of the 9th World Conference on Earthquake Engineering, WCEE, Vol. II, Tokyo, Japan, 819-824.
Abrahamson, N.A., 1992. “Non-stationary spectral matching.” Seismol. Res. Lett. 63, 30.
Hancock, J., Watson-Lamprey, J., Abrahamson, N.A., Bommer, J.J., Markatis, A., McCoy, E., and Mendis, R., 2006. “An improved method of matching response spectra of recorded earthquake ground motion using wavelets”, J. Earthquake Eng. 10, 67–89.
Kaul, M.K., 1978. “Spectrum-consistent time-history generation.” J. Eng. Mech. Div., ASCE 104, 781-788.
Newmark, N.M., Blume, J.A. and Kapur, K.K., 1973. “Seismic design spectra for nuclear power plants.” Journal of the Power Division, 99(2), 287-303.
PEER Database, 2014. http://peer.berkeley.edu/peer_ground_motion_database