Multi-mode Factor for Distributive Systems
William H. White, Independent Consultant to Bechtel National, Inc, former Chief Civil Eng. Bechtel Power Corp. Adeola K. Adediran, Technical Specialist with Bechtel National, Inc. ([email protected])
Orhan Gürbüz, Fellow and Principal Engineer with Bechtel National, Inc
ABSTRACT
For a nuclear safety related structure, where the primary structure is analyzed for seismic loads using a time history analysis, secondary structural systems (for example pipe racks and raceways) are commonly analyzed using an equivalent static method. ASCE 4-98 [1] and the NUREG-800 [2] suggests when using in-structure response spectra obtained from the time history analysis, the seismic load on these simple structures is obtained by multiplying the mass of sub-structure and supported commodities by an acceleration equal to 1.5 times the peak acceleration of the applicable response spectrum. The 1.5 multiplier is referred to as the multi-mode factor. ASME [3] also allows a simplified seismic load coefficient approach for which various factors are given for determining the seismic loads for the design of piping, for calculating the reactions, and for inline components. The factors provided depend on the site conditions, pipe sizes and spans.
The ASCE 4-98 guideline is deemed overly conservative in industry practice. This paper presents a case study using the pipe rack configuration in the Waste Treatment Plant Project in Washington State to investigate the claim that this ASCE 4-98 guideline is indeed conservative and suggests a more appropriate multi-mode factor for pipe racks and other similar simple sub-structures with non-uniform mass distribution.
In the study, the baseline case is the model where the earthquake-induced forces are obtained when the seismic loads are computed from multiplying the mass of the representative pipe rack framing and attached piping by 1.0 times the peak of the in-structure response at the point of connection of the sub-structure to the primary structure. This baseline case is compared to results from a dynamic model where the earthquake-induced forces are obtained from a response spectra analysis. The load input for this dynamic model uses typical nuclear facility response spectra at the points of connection to the primary structure. The sub-structure is modeled as a fixed base structure. Parametric studies are performed where the stiffness of the girders, beams and commodities are varied; 3 sets of girders, 3 sets of beams and 9 different commodity stiffnesses.
1.0 INTRODUCTION
In nuclear safety related structures, primary structures are analyzed for seismic loads using a time history or response spectra analysis but the secondary structures are commonly analyzed using an equivalent static method. ASCE 4-98 suggests determining the equivalent-static loads by multiplying the structure, equipment and supported commodities masses by an acceleration equal to 1.5 times the peak acceleration of the applicable response spectrum. For commonly configured commodity support structures, this study shows smaller values can be justified. This study uses a typical commodity support structure, varies the stiffness of the beams, girder and commodities over a wide range and determines equivalent-static load factors (ESLF), alternatively referred to as multi-mode factors. This study shows the ESLFs of 1.0 for the beams and girders and 1.5 for the supported commodities provide a reasonable basis for design.
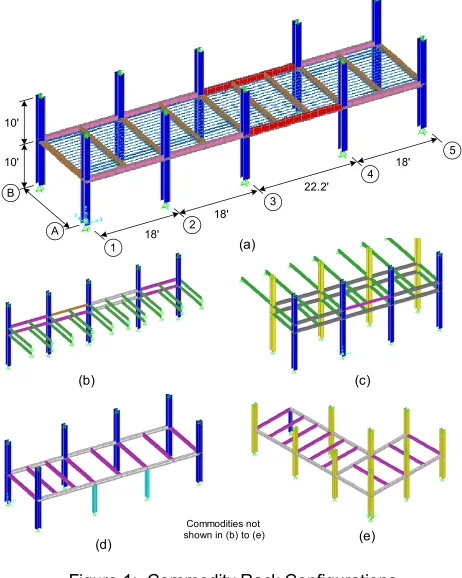
2.0 DESCRIPTION OF COMMODITY SUPPORT STRUCTURE
analyses, the weight of the commodities is assumed to be 50 psf. In the model, members representing the commodities are spaced at 12 inches.
Figure 1: Commodity Rack Configurations
(b)
(c)
(d)
(e)
(a)
A
B
1
2
3
4
5
18'
22.2'
10'
10'
18'
18'
Commodities not shown in (b) to (e)
3.0 RESPONSE SPECTRA USED IN THE ANALYSIS
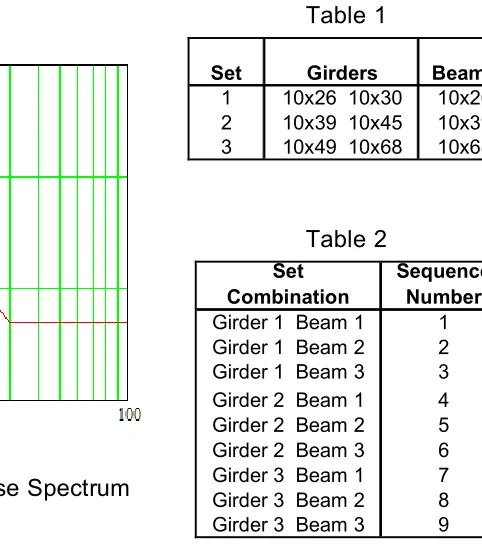
The response spectra used in the analysis of the commodity support structure (CSS) in the vertical direction is the envelope of the 5% damped response spectra at the top and bottom of the supporting columns and is patterned after the response spectra from the Pre-treatment Facility at the Waste Treatment Plant in Richland, Washington. This response spectrum, Figure 2, has a relatively narrow primary peak (between 2.9 and 4 Hz) with amplitude of 1.3G and two prominent plateaus. The first plateau is approximately 25% below the peak and the second plateau is 25 % below the first plateau. The response spectrum has been broadened according to ASCE 4-98. Clearly not all response spectra in nuclear facilities have this exact shape but it is very common for the response spectra to have a narrow peak and one or two plateaus.
Set Combination
Sequence Number Girder 1 Beam 1 1 Girder 1 Beam 2 2 Girder 1 Beam 3 3 Girder 2 Beam 1 4 Girder 2 Beam 2 5 Girder 2 Beam 3 6 Girder 3 Beam 1 7 Girder 3 Beam 2 8 Girder 3 Beam 3 9
Set Girders Beams
1 10x26 10x30 10x26
2 10x39 10x45 10x39
3 10x49 10x68 10x68
Table 1
Table 2
Figure 2: Acceleration Response Spectrum
4.0 VARIABLES IN THE PARAMETRIC STUDY
In order to determine a set of ESLFs that is applicable to a variety of CSS, the stiffness of the beams, girders and commodities are widely varied. To insure that the stiffness range includes only practical conditions, the size of the beams and girders were determined based on three stressconditions; limiting the bending stress to¾
,
½ and⅓of the allowable stress. The controlling load combination is dead load plus seismic. For the purposes of sizing the members, the seismic loads were assumed to be equal to a 1.0G load. By selecting three stress conditions, three sets of girders and beams are produced which will cover a wide range of beam and girder stiffnesses.The model was analyzed for each combination of girder, beam and commodity stiffness which results in 3x3x9 = 81 analyses. The girder and beam sizes based on the three stress levels are shown in Table 1. The first number in the girder column is the member for the 18-foot spans and the second number is for the 22.2- foot spans. These three sets of girders and beams were combined to form 9 unique sets of girders and beams as shown in Table 2. The model was analyzed for each set of girders and beams. In addition, for each unique set of girders and beams, the model was analyzed for each commodity stiffness. For example, for Girder 1 and Beam 1, the model was analyzed for each of the 9 commodity stiffnesses. These data were used to produce the variation of the ESLF for Girder 1 and Beam 1 as a function of commodity stiffness. The family of curves is discussed in Section 6.0
5.0 ANALYSIS OF THE PARAMETRIC MODELS
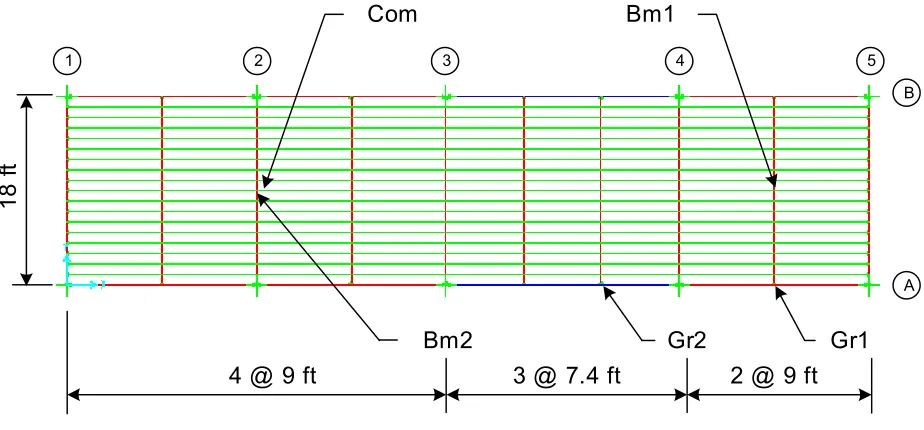
In this study, the baseline case computes the earthquake-induced forces by multiplying the mass of the CSS and attached commodities by 1.0 times the peak of the applicable RS. This baseline case is compared to results from a response spectra analysis. The comparison is made by forming the ratios of the moment from the dynamic analysis divided by the moment from the equivalent-static analysis. For typical CSS, shear does not control the design of the beams and girders and therefore is not monitored.
Bm1
Bm2
Gr2
Gr1
Com
4 @ 9 ft
3 @ 7.4 ft
2 @ 9 ft
1
8
f
t
Figure 3: Commodity Support Structure with Selected Moments
1 2 3 4 5
B
A
Since the design of the beams, girders and commodities is controlled by the vertical load combination DL + EQ, it must be used to identify the controlling locations. This load combination depends on seismic loads determined by response spectra analyses as well as equivalent static analyses. Moments from both sets of load combinations where considered in identifying the controlling locations
The controlling moment in the long girder on Column Line (CL) A is at the attachment point closest to CL 4, location 3.7A, see Figure 3. The moment at grid point 3.7A is slightly higher than the moment at 3.3A. Among the three locations along CL A for the 18-foot span, the moment at 4.5A is higher for all the stiffness combinations. For the moment in the beams, the maximum moment was either at location 2A.5 or 4.5A.5 so both locations were monitored for all the analyses. The maximum moment in the commodities for the combined loads occurred at location 2A.5 for all the stiffnesses. There were higher individual dead load moments and higher response spectrum moments but the moment from the combined loads was always higher at location 2A.5. Combined loads were used to determine the location of the controlling moment but to determine the ESLF, the ratio of the moment from response spectrum analyses and the equivalent analyses are used.
95% of the modal effective weight was included. In the equivalent static analysis, an acceleration of 1.0 times the peak acceleration was applied to the mass of the commodities (50psf) and the beams and girders.
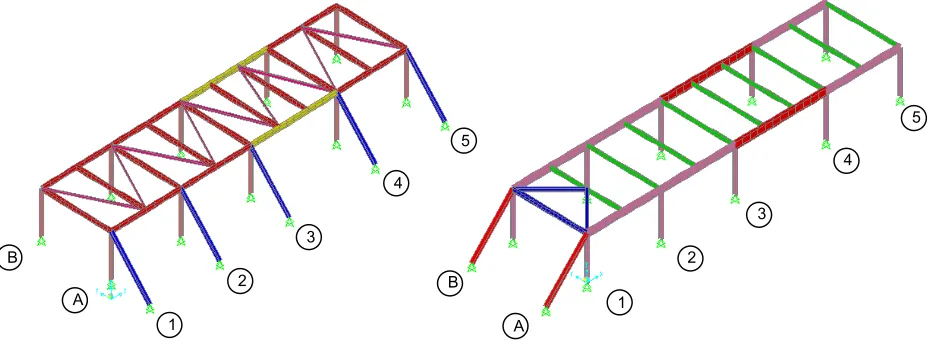
The horizontal response was determined for three conditions, 1) lateral response when one end of the beams attached to the a concrete wall, 2) lateral response when the beams and girders are supported by light columns and braced to avoid weak axis bending of the girder and 3) longitudinal response with the commodities restrained at one location. The first condition uses the model shown in Figure 3 with simple supports at the end of the beams along CL B. The second condition is shown in Figure 4. Braces in a vertical plane are placed at the end of the girders to carry the lateral load to the floor and the horizontal bracing is included to prevent weak axis bending in the girders. In the third condition, the commodities are typically restrained at long intervals (75 to 125 feet) in the longitudinal direction. Horizontal and vertical bracing are provided at this location.
For the horizontal response, the full range of parametric variables is not needed. For the first case, only the stiffness of the commodities needs to be varied since the beams experience only axial deformation and the girders can’t flex except due to their own weight. For the second case, the commodity stiffness is varied over the full range but only three bracing stiffnesses were considered because the variation in the system response was observed to be very small and the full variation of the bracing was not warranted. For the third case, the same approach as for case 2 was used, i.e., full variation of the commodity stiffness and three sets of bracing stiffnesses.
Figure 4: Lateral Braced Rack
Figure 5: Longitudinal Braced Rack
1
2
3
4 5
1
2
3
4
5
B
A B
A
6.0 RESULTS
6.1 Vertical Response
response, the columns could be included in a tier but their axial stiffness is much greater than the flexural stiffness of the other members so that the columns are neglected.
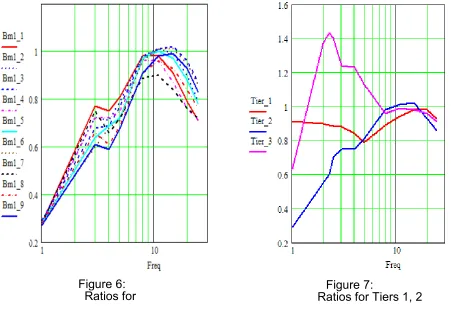
To determine if the ESLF of 1.0 for the beams and girders and 1.5 for the commodities is adequate, the ratio of the moments from the response spectrum analysis and the equivalent static analysis is determined. The ratio of these moments were determined for each of the 9 girder and beam combinations and for each commodity stiffness. The resulting ratios are plotted as a function of the commodity frequency. For each of the five critical moments, a family of curves were determined showing the variation in the ratio as a function of girder and beam stiffness. The variation in the ratio is shown for Bm1 in Figure 6. The quantities listed on the abscissa are Bm1 followed by an underscore and a number. The number following the underscore indicates the girder and beam combination used to determine that particular curve. For example, the curve shown for Bm1_7 used girder 3 and beam 1, see Table 2. Notice the ratios are less than 1.0 for all the stiffness combinations which indicates that the ESLF for this critical moment, an ESLF = 1.0, is adequate. Similar curves were developed of the other critical moments. The envelope of the curves for the three tiers is shown in Figure 7. From these curves, ratios for Tiers 1 and 2 (beams and girders) are less 1.0. The ratio for Tier 3 is greater than 1.0 but less than 1.5. Recalling that the ESLF applied to the weight of the structure for the equivalent static analysis was 1.0 times the peak of the response spectrum, these curves provide justification for using an ESLF of 1.0 for the beams and girders and 1.5 for the commodities.
In the design of the various members, use an ESLF of 1.5 applied to the weight of the commodities for their design. Then in a separate analysis, use an ESLF of 1.0 applied to the entire structure to design the beams and girders. It is not necessary to use the same ESLF for the entire structure.
Figure 6:
Ratios for
Ratios for Tiers 1, 2
Figure 7:
6.2 Lateral Response – Wall Supported
analyzed for the full range of commodity stiffnesses but the properties of the beams and girders were not changed because they have very little influence on the response. The maximum ratio is only 0.89 which is considerably below the suggested ESLF of 1.5. Two factors contribute to the difference. First, the factor of 1.5 was developed from an analysis that used a uniform response spectrum [4] and this analysis uses a typical response spectrum with a primary peak. Second, the factor of 1.5 resulted from the combination of two unique mode shapes from a four span beam model that are not reproduced in common CCS. In a common CCS supported from a concrete wall, the response is made of many modes; none have a modal effective weight greater than 15% of the total mass.
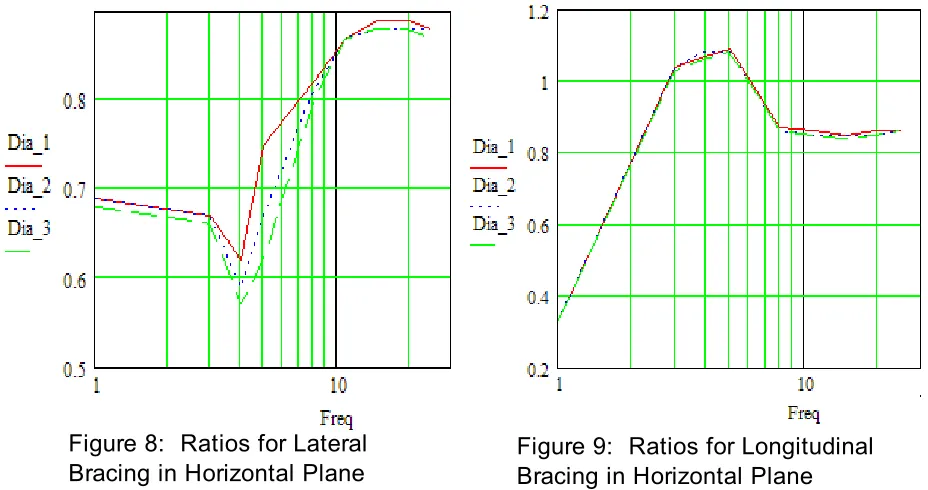
Figure 8: Ratios for Lateral
Bracing in Horizontal Plane
Figure 9: Ratios for Longitudinal
Bracing in Horizontal Plane
6.3 Lateral Response – Braced
As noted in Section 5.0, a horizontal and vertical bracing system is provided when weak axis bending of the girders can take place. When very stiff columns and girders are provided, the lateral bracing may be eliminated. If a bracing system is not provided, the response of the girders (2nd tier member) can result in ESLFs that approach 1.5 and the response of the commodities could be higher.
The amplification of the braced system was determined by a response spectrum analysis. The largest amplification occurred in the diagonal from 4A to 3.7B and is shown below in Figure 8. Since the variation of the amplification is relatively insensitive to the size of the bracing members, only three sets of members were used. Each set was sized by limiting the actual stress to 0.75, 0.5 and 0.33 of the allowable stress. The integer associated with each label indicates the sizes of the members used in the analysis with the smallest number corresponding to the smallest members. The amplification in the horizontal bracing was expected to be greater than the bracing in the vertical plane since the horizontal bracing is a 2nd tier member and the 2nd tier members usually experience greater amplification. The response of the commodities was also determined and had a maximum ESLF of 0.94. As expected, the ESLF is less than 1.0 in the lateral direction; the commodity support is rigid (i.e., the axial stiffness of beams) and does not cause any amplification.
6.4 Longitudinal Response - Braced
For purposes of this analysis, the longitudinal restraint of all the commodities is assumed to be on the same beam, CL 1 in Figure 5. To resist these longitudinal inertia loads, bracing in the vertical plane is provided as well as the horizontal bracing in the plane of the commodities. In the previous plots of the ratios, flexure deformation was the dominant behaviour of the commodities and the ratios were plotted verses the frequency of a 9-foot simply supported commodity. For the longitudinal response of the CSS, axial deformation is the dominant behaviour of the commodities. The frequency used in Figure 9 is the frequency of a commodity in axial extension, the full length of the rack model, 76 feet, and restrained at one end.
The ratio for the axial forces was determined in the same manner as for the lateral bracing. The ratios for the horizontal bracing (Tier 2) was slightly larger than for the vertical bracing (Tier 1), maximum values of 1.09 and 1.03 respectively, Figure 9. For the longitudinal direction, use an ESLF = 1.0 for both sets of bracing. The actual amplification from the response spectrum analysis is slightly higher than 1.0 but the use of 1.0 is considered adequate since conservatism exists in response spectrum analysis (e.g., using envelop response spectrum, envelop commodity weights, etc.).
7.0 SUMMARY AND CONCLUSIONS
A parametric study has been performed on a commodity support structure for a wide range of stiffnesses of the beams, girders and commodities to determine appropriate equivalent static load factors (ESLF) for seismic loads. To insure the member stiffnesses were in the practical range, the beams and girders were sized by limiting the stress to 0.75, 0.5 and 0.333 of the allowable stress. This results in 3 sets of beams and 3 sets of girders and produces up to 9 sets of beam/girder combinations.
Equivalent static load factors were determined for a common commodity support structure by comparing the responses from response spectrum and static analyses. The forces (bending moments or axial forces) at key locations were determined from a response spectrum analysis using a typical response spectrum from a nuclear facility. Forces at the same locations were determined by applying a static load equal to the mass of the structure and supported commodities multiplied by an acceleration equal to 1.0 times the peak of the response spectrum, 1.3 G. The ratios of the forces from the two analyses were produced from which the ESLF were determined.
ASCE 4-98 recommends an ESLF of 1.5 times the peak of the response spectrum. This study shows this recommendation can be relaxed for the beams and girders for common commodity support structures. The recommended ESLF are summarized in Table 3. For the vertical response, the ESLF for the beams and girders is 1.0 and for commodities is 1.5. For the lateral response of a braced commodity support structure and one supported by a concrete wall, the ESLF for the braces and the commodities is equal to 1.0. The bracing must be placed to eliminate weak axis bending of the girders and must provide a load path from the end of the girders to a very stiff system such as a concrete wall or floor. For the longitudinal response, the ESLF for the bracing is 1.0. Bracing should be placed at the location of the longitudinal restraint of the commodities.
REFERENCES
[1] ASCE 4-98, Seismic Analysis of Safety Related Nuclear Structures and Commentary, American Society of Civil Engineers, Reston, Virginia
[2] USNRC, Standard Review Plan, NUREG-0800, Section 3.7.2, Rev. 3 – March 2007 [3] ASME, ASME Section III, Division 1, Appendix N, 2001
[4] Stevenson, JD and Lapay, WS. 1974. “Amplification Factors to Be Used in Simplified Dynamic Analysis of Piping Systems,” Pressure Vessels and Piping Conference with Nuclear Engineering and Material Division, ASME