Optimization of Plant Layout Using SLP
Method
Shubham Barnwal
1, Prasad Dharmadhikari
2Student Scholar, Dept. of Mechanical Engineering, RCOEM, Nagpur, Maharashtra, India1
Student Scholar, Dept. of Mechanical Engineering, RCOEM, Nagpur, Maharashtra, India2
ABSTRACT: In this paper, ongoing engine reconditioning process layout of an automobile industry are studied and a new layout is developed based on the systematic layout planning pattern theory to reduce engine reconditioning cost and increase productivity Since it is an automobile assembly plant, the company has both processes as well as product layouts. The number of equipment and travelling area of material in engine reconditioning have been analyzed. The detailed study of the plant layout such as operation process chart, activity relationship chart and the relationship between equipment and area has been investigated. The new plant layout has been designed and compared with existing plant layout. The new plant layout shows that the distance and overall cost of material flow from stores to dispatch area are significantly decreased. The implementation of proposed model will help in the overall improvement of production performance of the engine reconditioning unit of the corporation.
KEYWORDS:Plant layout, Systematic Layout Planning, Flow analysis, Activity relationship chart, SLP
I. INTRODUCTION
The paper titled “Optimization of plant layout for a Maharashtra State Road Transport Corporation (MSRTC)” is aimed at identifying some of the major problems regarding the present layout of the engine reconditioning unit of a public sector transport corporation under the government of Maharashtra, and to develop an efficient layout design, so as to improve the production performance of the firm. Facility planning is very important in manufacturing process due to their effect on achieving an efficient product flow. Proper analysis of facility layout design could improve the performance of production line such as decrease bottleneck rate, minimize material handling cost, reduces idle time, raise the efficiency and utilization of labour, equipment and space. The basic industrial layout planning is applied to a systematic layout planning (SLP) method in which showed step-by-step of plant design from input data and activities to evaluation of plant layout. This method provides the new plant layout that improves the product flow through the plant. The study addresses these problems by designing a product layout with the principles of systematic layout planning for enhanced productivity and higher product outputs at the scheduled time or at a shorter cycle time.
II. LITERATUREREVIEW
search techniques. A genetic algorithm (GA) is a search technique used in computing to find exact or approximate solutions to optimization and search problems. Simulated annealing (SA) is a generic probabilistic metaheuristic for the global optimization problem of applied mathematics, namely locating a good approximation to the global minimum of a given function in a large search space.
III.BASICOPERATIONOFMANUFACTURING
In MSRTC Central workshop, Engine reconditioning unit deals with the reconditioning and assembly of diesel engines. They are doing reconditioning work for different types of engines a) 697(TCIC), b)TC Euro1, c) TC Euro 2, d) TC Euro 3.
Presently, around 40 employees are working in this unit. With the present manpower, they can recondition a maximum of 105 engines per month. The basic steps involved in reconditioning an engine are:
a) O.D.S (Old store)
b) Stripping (degreasing and dismantling) c) Pre-inspection
d) Auto machine shop e) General machine shop f) Subassembly
g) Assembly line (engine section) h) Fuel injection pumps section.
i) Final inspection.
IV. PROCEDUREFORSYSTEMATICLAYOUTPLANNING(SLP)
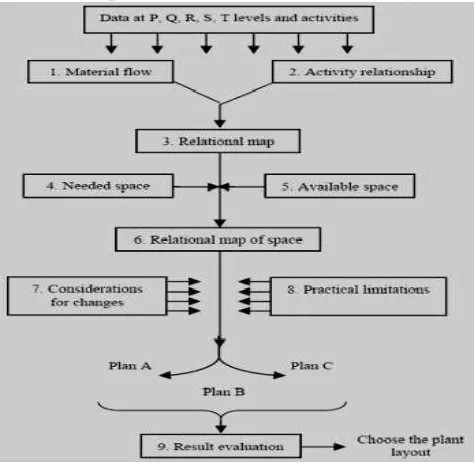
The systematic layout planning (SLP) is a tool used to arrange a workplace in a plant by locating two areas with high frequency and logical relationships close to each other. The process permits the quickest material flow in processing the product at the lowest cost and least amount of handling. Systematic Layout Planning is an organized way to layout planning. It involves of procedures, based on conventions for identifying, rating, and visualizing the elements involved in planning a layout. The detailed procedure for SLP is shown in the figure1.
FIGURE 1: SLP PROCEDURE BLOCK DIAGRAM
V. PROBLEMDESCRIPTION
In engine reconditioning unit, the work centres are not located in the order of product flow. Hence prolonged movements and several cross movements are existing in the present layout. Also, so many time-consuming activities exist in the present layout due to the lack of proper equipment.The other issues coming under the present layout are work delays, human safety issues, etc. In order to achieve a smooth material flow and to make the working environment more flexible, the existing plant layout needs to be modified.Hence, we can use plant more effectively. Thereby, the cost of production per engine can be reduced also; the productivity of this unit can be raised.
A. EXISTING LAYOUT OF THE COMPANY
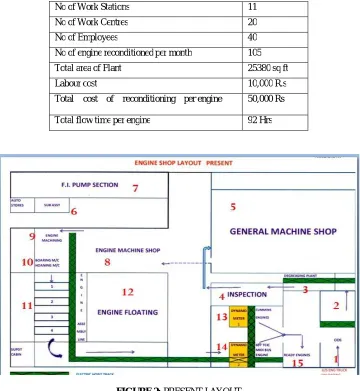
The present layout of the engine reconditioning unit of the company is shown in figure 2.In the existing layout; the work centres are not located in the true order of product flow. The data regarding the present layout of the bus body building unit is shown in the table1.
TABLE 1: PRESENT LAYOUT DATA
No of Work Stations 11
No of Work Centres 20
No of Employees 40
No of engine reconditioned per month 105
Total area of Plant 25380 sq ft
Labour cost 10,000 R.s
Total cost of reconditioning per engine 50,000 Rs Total flow time per engine 92 Hrs
FIGURE 2: PRESENT LAYOUT
B. ANALYSIS OF EXISTING LAYOUT
In this section, the existing layout is studied in detail to facilitate improvement. As a part of the work the first step to being done is a collection of department details. The precedence diagram is drawn along with this to gain a basic understanding of the material flow and also to identify the major activities and its successors as well as its predecessors. The precedence diagram that has been used is given in fig 3.
TABLE 2: AREAS OF DEPARTMENTS
Sr No
Department name
Area (sq ft)
Sr No
Department name Area (sq ft)
1. ODS 1200 9. Crankshaft Grinding M/c
400
2. Stripping 1680 10. Boring/Honing 450
3. Degreasing 480 11. Assembly Line 2000
4. Pre-Inspection 800 12. Engine Floating 3200
5. General M/c Shop
4000 13. Dynamometer 1 1400
6. Sub Assembly 620 14. Dynamometer 2 1400
7. F.I Pump Section
800 15. Ready Engines 2400
8. Engine M/c Shop
1350
As a part of the analysis, distance matrix and flow matrix is to be prepared. The distance matrix has been developed using the rectilinear distance between the departments having material flow. The rows and columns in the matrices indicate the departments and are given numbers from 1-15 in table 2. The flow matrix is developed by calculating the number of trips travelled for per product for the departments having material flow.
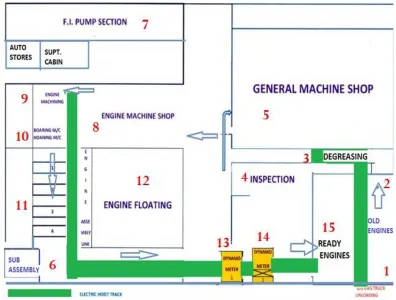
FIGURE 3: FLOW DIAGRAM
In this figure, material flows between different work stations are shown. Arrowhead shows the material flow between workstations and numbers 1-15 represent the station number.
C. DETERMINING MATERIAL HANDLING COST
FIGURE 4: RELATIONSHIP CHART
Activity Relationship chart or REL chart gives the information about the closeness between the departments. In REL chart, all pairs of relationships are evaluated and closeness rating (A, E, I, O, U) is assigned to each pair.
VI. MODIFIED LAYOUT DESIGN
A. ANALYSIS PLANT LAYOUT BASED ON SLP
According to the study of the manufacturing process, it was found that the long distance could be reduced for moving raw materials and the useless area could be minimised. The way to improve the plant was to apply SLP method to make the workflow continually by arranging the important sequence of the manufacturing. Then the relationship of each activity in closeness area was considered to make the relationship of each activity `in the form of a chart as shown in Fig 4, and the closeness value is defined as A = absolutely, E = especially important, I = important, O= ordinary closeness, U= unimportant, X= undesirable. The detailed distances for each activity were described in Table 3, as follows:
The important sequence of each activity was rearranged from the most important one to the least important one. The intensities of flow from each activity to another were developed. Based on modifying plant layout and practical limitations, a number of layouts were developed and the best suitable layout was chosen.
The present layout and modified layout can be analysed in terms of following parameters. 1. Distance
2. Production time (Flow time) 3. Labour cost
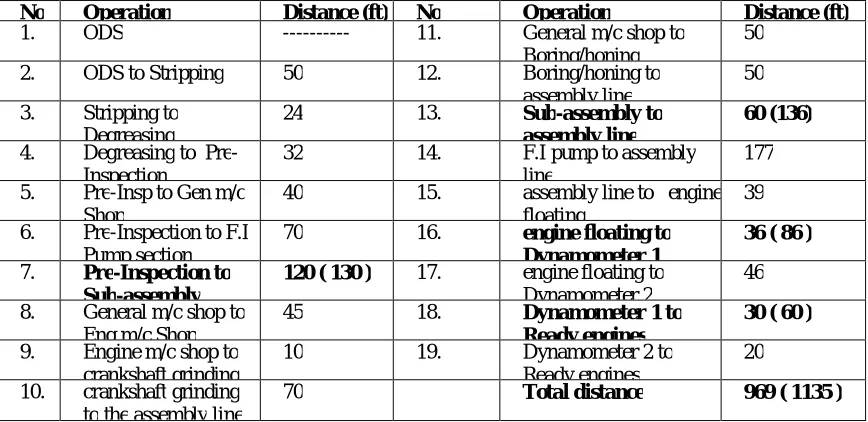
TABLE 3: DISTANCE
No Operation Distance (ft) No Operation Distance (ft)
1. ODS --- 11. General m/c shop to
Boring/honing
50
2. ODS to Stripping 50 12. Boring/honing to
assembly line
50
3. Stripping to Degreasing
24 13. Sub-assembly to assembly line
60 (136)
4. Degreasing to Pre- Inspection
32 14. F.I pump to assembly
line
177
5. Pre-Insp to Gen m/c Shop
40 15. assembly line to engine
floating
39
6. Pre-Inspection to F.I Pump section
70 16. engine floating to Dynamometer 1
36 ( 86 )
7. Pre-Inspection to Sub-assembly
120 ( 130 ) 17. engine floating to Dynamometer 2
46
8. General m/c shop to Eng m/c Shop
45 18. Dynamometer 1 to Ready engines
30 ( 60 )
9. Engine m/c shop to crankshaft grinding
10 19. Dynamometer 2 to
Ready engines
20
10. crankshaft grinding to the assembly line
70 Total distance 969 ( 1135 )
One of the major highlights of the modified layout design is that the locations of work centres are in the true order of product flow. Also, crossover and longer movements are less in the modified layout design when compared with the present layout. Hence, the distance travelled by the material can be reduced to a greater extent in the modified layout. By implementing the proposed design, we can also improve the production performance parameters like flow time, line efficiency etc.
In order to implement the modified layout design, so much of restructuring is not required. One of the major step to be taken as a part of the layout modification is that rearranging the location of work centres as per the modified layout design. Also, the new locations of the store as per the modified layout design will help to access the raw materials very easily. No extra space is required to implement the modified layout design.
1. Distance
2. Production time (Flow time)
In present layout, production time required for reconditioning an engine is 92 hrs. Since the time taken for transportation is also a function of total task time, the reduction in total distance will also reduce the total production time. Thus, an overall reduction in travelling time of material was reduced by 185 min i.e. equal to a total reduction of 3.08 hrs as shown in table 4.
TABLE 4: OPERATION TIME
NO Operation Time Taken After (Before)
1. Pre-Inspection to Sub-assembly 55min ( 60 )
2. Sub-assembly to assembly line 10 min ( 120 )
3. engine floating to Dynamometer 1 15min ( 60 ) 4. Dynamometer 1 to Ready engines 20min ( 45 )
3. Increase in no of engines reconditioned
From Table 1 we get that 105 engines are reconditioned per month. Therefore, a total of 3 engines gets reconditioned in 9 hrs. Hence for one engine, a total of 3 hours is required.
Now with the reduction of production time by 3.08 hrs per day, a total of 30 more engines can be reconditioned per month. This will enhance the total production of MSRTC and increase in productivity from 105 engines to 135 engines per month.
4. Labour cost
Since production hours are directly related to labour hours, reduction in total production time will reduce the total labour hours.
VII. COMPARISONOFPLANTLAYOUTS
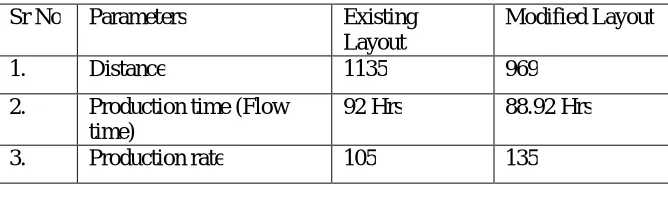
The results obtained were analysed and compared in terms of several parameters which are shown in table 5. The existing layout and modified layout were compared in terms of parameters such as distance, flow time and production rate.
TABLE 5: COMPARISON OF PLANT LAYOUT
Sr No Parameters Existing Layout
Modified Layout
1. Distance 1135 969
2. Production time (Flow time)
92 Hrs 88.92 Hrs
3. Production rate 105 135
VIII.CONCLUSION
be preferable while setting up a new plant implementation and will help in the overall improvement of production performance of the engine reconditioning unit of MSRTC.
REFERENCES
[1] Pramod P. Shewale, “Improvement in plant layout using systematic layout planning for increased productivity”, IJAERS/Vol. I/ Issue III/April-June, 2012/259-261
[2] Jeff Mohr, CIRAS, Mike Willett, CIRAS, “Simplified Systematic Plant Layout Management Guide” Iowa State university CIRAS News, Vol. 34, No. 1 Fall 1999, pp (5-8)
[3] Md. Riyad Hossain, Md. Kamruzzaman Rasel & Subrata Talapatra, “Increasing Productivity through Facility Layout Improvement using Systematic Layout Planning Pattern Theory”, Global Journal of Researches in Engineering: J General Engineering, Volume 14 Issue 7 Version 1.0, pp. (71-76), 2014
[4] Filippo De Carlo1,*, Maria Antonietta Arleo2, Orlando Borgia1 and Mario Tucci1, “Layout Design for a Low Capacity Manufacturing Line: A Case Study”, International Journal of Engineering Business Management Special Issue on Innovations in Fashion Industry, July 2013, Vol 5, pp.(1-10)
[5] Keerthi UR, Dr M S Jayamohan, “Optimization of plant layout for an SRTC ”, IJIRSET, Vol 2, Issue 1, Pg (671-680), December 2013 [6] Mahendra Singh, “Innovative practices in facility layout planning”, International Journal of Marketing, Financial Services & Management
Research Vol.1 Issue 12, pp(126-139), December 2012
[7] Vinod arya, “Increased Productivity and Planning By Improved Plant Layout Using Systematic Layout Planning at NCRM Division, Bhushan Steels Ltd. Khopoli, Mumbai ”, IJIET, Vol 2, Issue 2, April 2013
[8] W. Wiyaratn and A. Watanapa, 2010.Improvement Plant Layout Using Systematic Layout Planning (SLP) for Increased Productivity World Academy of Science, Engineering and Technology 48.
[9] Y. Zhu, and F. Wang, “Study on the General Plane of Log Yards Based on Systematic Layout planning,” IEEE. Computer Soci vol. 4, pp. 92– 95, 2009.
[10] “Industrial Engineering and Production Management” By Martand Telsang ( S. CHAND & COMPANY LTD )
BIOGRAPHY
Shubham Barnwal, is a student Scholar at Department of Mechanical Engineering, Shri Ramdeobaba College of Engineering and Management, Nagpur. He is actively involved in research projects related to automotives and refrigeration and is an active member of SAE India. He has also participated and contributed in BAJA, a vehicle design and development projects by SAE INDIA. He has also published research paper on Thermal Barrier Coatings and Different processes to apply them He is presently working on portable personal cooling systems for people working in hotter zones so as to establish micro-climate cooling.