TH E INTERRELATIONS OF TEMPERATURE, BODY
SIZE, AND CHARACTER EXPRESSION I N
DROSOPHILA MELANOGASTER’
JAMES V. NEEL
The University of Rochester, Rochester, ”IYork
Received November 11, 1939
INTRODUCTION
URING the past half-century, numerous investigations have shown
D
that the exact expression of many wild-type and mutant character- istics of diverse organisms depends upon the temperature a t which de- velopment takes place. Concurrently, studies on relative growth have frequently demonstrated a regular relation between the size of the whole individual and the degree of development of certain of its organs. Be- tween these two fields of investigation, which have grown up quite in- dependently, there is a bridge. I t is supplied by the fact that in some organisms, such as the insects, adult size is related to the temperature prevailing during development. Consequently, the results of any study of the effects of temperature upon character expression in these forms are possibly complicated by the failure of size to remain constant at all tem- pera tures.The present paper constitutes a step in an analysis of the interrelations of temperature, body size, and character expression in an insect, Dro- sophila melanogaster. It will be shown that in the cases of polychaetoid and Dichaete, two “temperature-responsive” mutants of this species, a large part of the apparent “temperature effect” is qnder the conditions of these experiments bound up with changes in body size attendant upon the tem- perature change. Were the flies of the various temperature series of equal size, then the so-called “temperature effect” would be greatly reduced.
The principal conclusions of this paper were summarily reported a t the Seventh International Genetics Congress.
THE POLYCHAETOID MUTANT
Flies homozygous for this mutant (pyd, 3-39 f 2) are characterized by
the presence of extra bristles a t or near the various normal bristle loci. Supernumerary macrochaetae are particularly likely to occur in the dorso- central and scutellar regions. A detailed description of the mutant will be given by NEEL (1940). The stock employed in this investigation had been inbred in small mass cultures (three-four pair matings) for two years prior to the beginning of the experiments.
the requirements for the degree of Doctor of Philosophy at the University of Rochester. This and a following paper (Genetics, in press) have been submitted in partial fulfillment of
2 2 6 JAMES V. NEEL
T h e size of the fly and the expression of polychaetoid, at constant temperature
The relation between the size of pyd flies and the number of bristles present has been investigated in several different ways. Thus, in a first approach to the problem, groups of pyd flies were raised under such unlike nutritional conditions as to result in differences in average fly size from group to group, and the relation between mean size, as expressed by body weight, and the mean number of dorsocentral bristles present per side per fly (M dc) established. As a standard procedure, two or three pairs of flies were introduced into half-pint milk bottles containing approximately
50 cc of corn-meal agar and allowed to remain there seven to eight days. The bottles were kept in an incubator similar to the two-shelf type de- scribed by BRIDGES (1932), in which temperature stayed within 0.2' of 24.ooC. When the offspring began to emerge the flies were collected a t three day intervals. From one to four collections were made from a set of bottles, and thus groups of flies developing a t different nutritional levels of the cultures and hence of different mean sizes were secured. The flies of each collection period were given unlimited access to food during the in- tervals between collections. ImmediateIy after collection, all the males were etherized and weighed together, and the average body weight estab- lished. Only males were used in the weight determinations, since their weight is less subject to fluctuation than that of the females. For all groups the time elapsing between removal from food, etherization, and weighing was made as short as possible (ca 10-15 minutes). This mini- mized errors due to dehydration of the flies. The M dc was then calculated.
A total of ten groups of flies, representing a range in average fly weight of from0.600$0.011 to 0.953 t0.004mg, a n d i n M dcof from 2.322 1 0 . 0 5 2
to 3.47010.034, was thus secured. The mean number of males weighed in a group was 98.7; an average of 139.6 half thoraces from these were used in the M dc determinations. The complete data for this experiment and for the similar experiments to be reported below have been filed with
GENETICS.
A simple expression for the relation between average body weight and
M dc was desired. It was found that while a plot of M dc against average body weight yielded an approximation to a straight line, a better approach
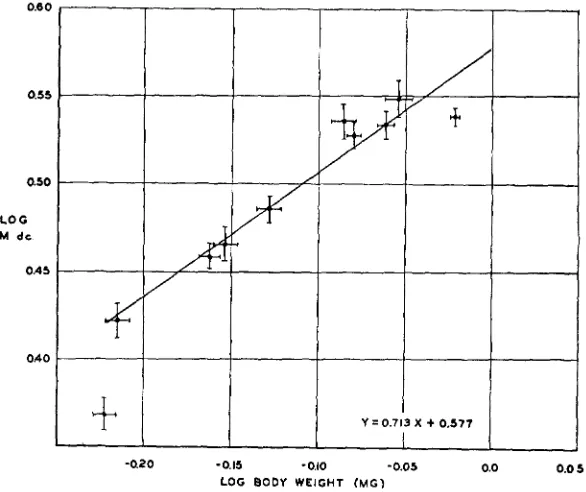
to linearity was secured with a double log plot (figure I). This indicates that the data can be treated as an expression of the power function
y = bxk
CHARACTER EXPRESSION I N DROSOPHILA 227 The ranges of the variables x and y are towards the lower limits of valid applications of logs.
The line which has been fitted to the points of figure I is the regression
line of log M dc on log mean body weight, as determined by the least squares method with unweighted ordinates. The equation of this line is
Y
= 0.713x+
0.577where Y corresponds to log M dc and X to log mean body weight. The aberrant point seen in the lower left hand corner of the figure has not been
-0.15 -0.10 -0.05 0.0 0.0 5
-620
LOG BODY WEIGHT (MG)
FIGURE I.-The correlation, in groups of male pyd flies raised at 24.ooC at various nutritional levels, between log average body weight and log M dc. The vertical lines attached to each point
represent the limits of +um for the M dc. The horizontal bars indicate the calculated magnitude of ,U,,, for the average weight. All logs are to the base IO. Details in text.
2 2 8 JAMES V. NEEL
Each of the points shown in figure I is based upon two means, M dc
and mean body weight. The determination of these means involves both methodological and sampling errors. In consequence of the simplicity of the operations involved (counting bristles and weighing groups of ca 50-150 flies on a Becker Chainomatic Balance with a sensitivity of 0 . 2
mg), methodological errors are small. Sampling errors are of somewhat greater magnitude. The sampling error for bristle number is given by the standard error of the M dc (a,). The upper and lower limits of the vertical bar attached to each point of figure I are respectively M dc+a, and
M
The evaluation of the sampling error for weight, which is the standard error of the mean body weight of a group, is somewhat more difficult. In the course of the experiments reported in this paper, two different methods have been used in raising groups of flies of different average sizes. a) The one method, used in securing the flies incorporated into figure I , involved
the withdrawal from culture bottles of flies emerging during successive three day periods, and has already been described in some detail. b) The other method, used in the derivation of the points of figures 3 , 4 , 5 , and 6,
was to place varying numbers of eggs from two to eight hour egg-laying periods on a given quantity of food (amount contained in a one centimeter layer of corn-meal agar in afinger bowl of 10.5 cm diameter). It seems that the first method should lead to a somewhat greater variation in body weight within the group than the second. Accordingly, the means of esti- mating the weight error which follows is based upon flies raised by the first procedure; this should be adequate for flies raised by the second method.
One hundred male flies composing a portion of the first three days emergence from culture bottles subjected to standard conditions were weighed individually on a microbalance with a sensitivity of 0.001 mg.
Repeated weighings of the same fly showed that the accuracy of the weight determination was within one percent. For these IOO flies, the mean body
weight (M) waso.881 mg; the standard deviation (a) was 0.089 mg; the stan- dard error of the mean (a,), 0.009 mg; and the coefficient of variability (CV), 10.1. From thesedeterminations, an estimateof the errorof the weight determination for each group can be made. It is assumed that from group to group, no matter what the average body weight, CV remains approxi- mately constant and equal to the value found in these IOO flies. Hence in
any other group, a, may be reasonably estimated as equal to .OI M / d % , since a,
=a/v'R
= ( C V X M ) / I O O ~ N . The standard errors so estimatedare indicated in figure I by horizontal bars.
Some of the points in figure I deviate significantly from the fitted line,
CHARACTER EXPRESSION I N DROSOPHILA 2 2 9
times the standard error of body weight or M dc. Similar deviations will be noted in later figures. Possible causes for these deviations are as follows: I) The relation between the two sets of values studied may not be strictly linear. Thus, HUXLEY (1932) has pointed out that in cases of insect heterogony, a t large body sizes points usually fall below the straight line fitted to a double log plot of the data. A deviation which may be of this nature is shown in the figure. 2) Experience has shown that the weight of a given group of flies may from time to time vary considerably, depending on feeding conditions. In this work, an attempt was made to give each group of flies the same free access to food, prior to weighing. I t is possible that this attempt was not entirely successful, and that therein lies the cause of a t least part of these deviations.
A second determination of the relation between size and dorsocentral number consisted in deriving the correlation in individual flies between femur length and total number of dorsocentrals present. Femur length has been used as an index to body size by a number of investigators (cf BREHMB 1yj9), but the exact relation between these two variables has not been established. Since an investigation of this point seemed desirable, the right fore-femurs of the males composing each of the ten samples incor- porated into figure I were mounted, and the mean femur length of each
sample determined from camera lucida drawings of the mounted femurs. Over a range in mean femur length from 516.0h4.55 to 5 8 2 . o f 3 . 1 6 ~ and in mean body weight from 0.600 10.011 to 0.953 A0.004 mg, these two
variables appeared to be linearly related. I t seems probable that with uni- form age and feeding this group relation would hold good for the individual flies which compose the group.
230 JAMES V. NEEL
number of dorsocentrals present on both sides of the fly. In the sample of
IOO p y d males which were weighed individually to determine the standard
error of mean body weight (p. 2 2 8 ) , the correlation was 0.278 +0.092. An
insignificantly higher value (0.308 0.090) is obtained when the logs of the two variables are correlated. This correlation between size and bristle number, although significant, is much looser than that indicated by the other two approaches. There are two outstanding reasons for this. I ) The
range in body size in these IOO flies was not as great as that utilized in the
TABLE I
The relation between length of egg-larval life and number of dmsocentral bristles present i n male pya jfies, when size is held constant.
a. Femur length between 569 and 581p
Interval after oviposition a t
which puparium formation 13 2.0-139.9 140.0-147.9 148.0-1 55 .9 I 56.0-1 63.9 occurred (hours at 21OC)
Mean total number of dorso-
Number of flies 28 35 59 '9
centrals 5 um 6.71 50.21 6.6850.15 6.68 ko. 1 2 6.64:
b. Femur length between $32 and 59411
Interval after oviposition at
which puparium formation 132.0-139.9 140.0-147.9 148.0-155.9 156.0-163.9 occurred (hours at 21OC)
Number of flies 26 77 41 8
Mean total number of dorso-
centrals & um 7 . 1 1 t o . 2 1 6.72k0.11 7.00fo.12 6.75*
* No um calculated because of the small number of iXes involved.
other two experiments. Since a correlation between two variables becomes more apparent as the range of either is extended, the smaller size distribu- tion probably contributes to the relatively low correlation observed. 2 ) The
flies weighed were those emerging in the first three days from a set of bottles subject to conditions described above. The weighings required two days. Although every effort was made to give the flies unlimited access to
food, microscopic investigation a t the time of weighing revealed consider- able differences from fly to fly in the degree of distension of the abdomen. These are in part due to age differences. Because of this variation in ab- dominal contents, body weight must be regarded as a less accurate index of innate fly size than femur length.
CHARACTER EXPRESSION IN DROSOPHILA 231
mean size. This appears a reasonable explanation for the fact that for dif- ferent groups of flies the correlation between average body weight and
M dc is quite high (figure I), although for individual flies the correlation between weight and total number of dorsocentrals is much lower.
It is apparent from each of these three procedures that a t a constant temperature bristle number is linked with body size; an estimate of the closeness of the association depends upon the particular approach used.
I36 140 144 148 152 156 160 164
LENGTH OF EGG-LARVAL LIFE (HOURS AT 21°C)
FIGURE 2.-The lack of correlation of length of egg-larval life with the total number of dor-
socentral bristles present in pyd fies. The circles connected by the broken lines represent groups of flies with femurs 582-594~ long, while those connected by solid lines are based on flies with femurs 569-581p in length. Details in text.
Independence of M dc and length of larval life, at constant temperature
Groups of flies of different average sizes have been obtained by varying cultural conditions. Thus, some of the groups used in deriving the regres- sion equations developed a t quite low nutritional levels. A concomitant of a restriction on food intake such as practiced here is an increase in the average duration of larval life. It seemed necessary to test for a possible correlation of this prolongation of the larval stadium with bristle number, for the existence of such a relation would complicate any interpretation of the size-bristle number relation. Accordingly, an experiment was designed which would permit a comparison of the total number of dorsocentrals in equal-sized flies whose larval lives had been of unequal lengths.
232 JAMES V. NEEL
of puparia were formed from 132 to 164 hours after oviposition. New pu- paria were isolated every four hours during this period. When the flies emerged, the males of each collection period were classified as to the total number of dorsocentrals present and the right fore-femur length. A total of 5 2 7 flies was treated in this manner. Some males with femurs between 569 and 594p in length were found in each collection. The mean total num- ber of dorsocentrals of flies having femurs 569 to 5 8 1 ~ long was calculated for each four-hour group. A similar calculation was made for flies whose femurs ranged in length between 582 and 5 9 4 ~ . Since this subdivision of the data meant that the number of cases in any four-hour group was small, adjacent groups have been combined, so that there are available four eight- hour periods.
The data are given in table I . In figure 2 for each of the two femur
length ranges ( = fly sizes) mean number of dorsocentrals has been plotted
against length of larval life. For each eight-hour group, the length of larval life has been treated as the mid-point of that period. The broken line con- nects circles representing groups of flies with femurs 582-594p long; the circles connected by the solid lines are based on flies with femurs 569- 581p in length. No significant trend in the data is evident. This suggests that the inequalities in length of larval life observed at the various nutri- tional levels are of no significance in the determination of bristle number.
The relation between temperature and M dc
To test the effect of temperature upon fly size and M dc, well fed p y d
females were allowed to oviposit a t room temperature on food exposed in small rectangular metal containers. The eggs obtained in a two to eight- hour egg-laying period were divided into lots of IOO and placed on well
TABLE 2
The effect of temperature upon bristle number and body weight i n pyd Drosophila melanogaster males. M dc stands for the mean number of dorsocentrals present per side per fly.
TEWERATURE M dcfu, NO. HALF AVERAGE BODY WEIGHT NO. FLIES
THORACES (YG k um) WEIGHED
.-. _._
("C)
14.0' 4.533kO.033 542 1.061+0.006 276 19.0' 4.213 k0.023 754 1.062+0.005 44 1 24.0' 3 . 4 7 0 f 0 . 0 3 4 536 0.953 0.004 500 29.0' 3.058fo.022 740 0.784 0.003 396
CHARACTER EXPRESSION I N DROSOPHILA 233
The temperatures a t which the flies were raised and the M dc and aver- age fly weight a t each temperature are given in table 2. A 15°C increase in
temperature is associated with a pronounced decrease in the M dc, from
4.533
t-
0.033 a t 14OC to 3.058 k0.022 a t 29°C. Simultaneously, however, mean weight is decreasing. In view of the above-demonstrated correlation between fly size and M dc, a question immediately arises. To what extent is this effect of temperature upon bristle number concerned with some bristle-forming process within the body not related to fly size, and to what extent is the effect mediated either through size or some processes common to size and M dc?0.65
0.60
0.55
LOG
M do
0.50
0.45
0.40
-0.20 -0.15 -0.10 -0.05 0.0 0.05
LOG BODY WEIGHT (MG)
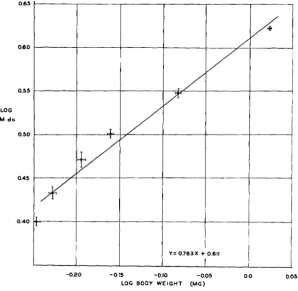
FIGURE 3.-The relation, in groups of pyd flies raised a t 19.ooC a t various nutritional levels, between log average body weight and log M dc.
A n evaluation of the manner of action of temperature
234 JAMES V. NEEL
the last paragraph may be restated thus: what are the relative roles of these two effects in the total temperature effect?
To answer this question, equations for the regression of M dc on weight a t each of the three lower temperatures employed are necessary. This equa- tion has already been obtained a t 24.ooC (p. 2 2 7 ) . The relation a t the other
two temperatures was determined by placing egg samples from two to eight-hour laying periods under various food conditions (different numbers of eggs per finger bowl containing food). Groups of flies showing wide dif- ferences in average body weight were secured.
0.70
0.65
040
LOG
M d e
0 3 5
0.50
-0.20
-
0. I5 - 0.10 -0.05 0.0 0.05LOG BODY WEIGHT (MG)
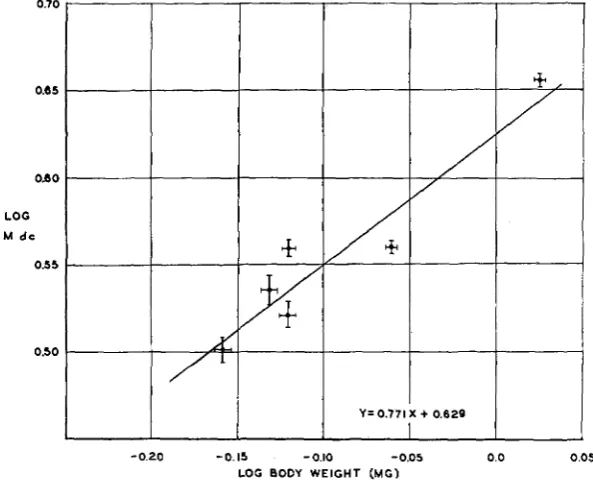
FIGURE +-The correlation between log average body weight and log M dc, in groups of pyd flies raised at 14.ooC at different nutritional levels.
Six lots of flies were raised a t 19.0"C. The highest mean body weight secured for any group was 1.062 ko.005 mg; this was accompanied by an M dc of 4.213 k0.023. These were the flies which have already been dis- cussed, raised under optimum conditions and listed in table 2. The lowest mean body weight was 0.568+0.005 mg; the corresponding M dc was
2.508 50.035. I n agreement with the 24.0°C data, a working approxima- tion to a linear relation is observed when log M dc is plotted against log average body weight (figure 3). The equation for the regression of log M dc on log weight is
CHARACTER EXPRESSION I N DROSOPHILA 235
Six groups of flies, varying in weight from I .061k 0.006 to 0.694
t-
0.007mg and in M dc from 4.533 ko.033 to 3.175 ko.049, were raised at 14.ooC.
The distribution of the data is such that it would be difficult to determine the exact nature of the regression. However, on the assumption that it is not different from that believed to obtain a t 24.0' and 19.0°C, a straight line of best fit to a double log plot of the results has been obtained (figure
4.) Its equation is
Y = 0 . 7 7 I x $- 0.629.
Possible causes for the significant departure of some points from the fitted line have already been discussed.
These regression equations make possible a determination of the relative importance of direct and indirect temperature effects. Two methods of evaluation have been imployed. The first is summarized in table 3. In
TABLE 3
A n evaluation of the relative importance of direct and indirect temperature ejects in the expression of the @yd mutant of Drosophila melanogaster.
_ _ ~
A B C D E F G
CALCU- DIFFERENCE OBSERVED OBSERVED LATED B-E ( = I N -
TENPER- M dc AT M dc AT DIFFER- M dc AT DIRECT D-F ( = D I - LOWER HIGHER ENCE LOWER TEMPERA- RECTTEM- RANGE TEMPERA- TEMPERA- B-C TEMPERA- TURE PERATURE
TURE TURE TURE* EFFECT) EFFECT)
H
RATIO OF P/G
29O-24' 3.470 3.058 0.412 3.177 0.293 0.119
29O-19' 4.213 3.058 1.155 3.373 0.840 0,315 29°-540 4.533 3.058 1.475 3.532 1 . 0 0 1 0.474 24O-19' 4.213 3.470 0.743 3.936 0.277 0.466
19°-140 4.533 4.213 0.320 4.457 0.076 0.244
24O-14' 4 4 3 3 3.470 1.063 4.102 0.43 I 0.632
2.46
2.66
2.11
0 . 5 9 0.68 0.31
* If size equals maximum size a t higher temperature.
column A of the table the six temperature combinations possible from these data have been listed. Column B shows the
M
dc a t the lower of thetwo temperatures composing a given combination, while column c gives the M dc a t the upper of the two. Column D, showing the difference B -c,
gives the total temperature effect on the M dc over the given temperature range. From the regression equations which have been developed, it has been calculated what the M dc would be a t each of the lower tempera- tures, if average fly size were equal to that obtaining a t the higher tem- peratures. The results of these calculations are entered in column E. The
236 JAMES V. NEEL
(indirect effect). The difference between the entries in columns D and F
(or E - c), given in column G, is the change in M dc independent of a size
factor (direct effect). Finally, the ratio of the entry in column F to that in
G (column H) is the ratio of indirect to direct temperature effects over the
given range. It appears that under these experimental conditions the major portion of the effect of temperature upon the M dc is indirect. The role of the indirect effect is not the same a t all temperatures, but is greatest a t high temperatures (where the M dc is changing most rapidly) and least a t low.
In the above procedure, in columns B and c have been listed the actu-
ally observed M dc a t the observed maximum size. This M dc does not always correspond to that expected on the basis of the regression equation. This is of course due to the circumstance that not all points fall right on the regression line. In this evaluation it is possible to use, not the actual observed M dc a t maximum size, but the M dc which as calculated from the appropriate regression equation should accompany this size. This modification of the procedure results in a slightly higher average value for the ratio of indirect to direct effects. If the deviation below the line of the terminal points in the 24.0’ and 19.0”C results is a systematic rather than a random occurrence, then this modification is less valid than the original procedure.
A second approach to this evaluation problem has been developed by
DR. D. R. CHARLES of this laboratory, who has kindly given me permis- sion to incorporate the method and its results into this paper.
EIGENBRODT (1930) has shown that as temperature decreases, weight increases, down to ca 17OC; “below 17°C there is very little increase in weight” (p. 395). Similarly, RIEDEL (1934) has found that the tibia length of wild-type flies increases with temperature decrease until the 15-16°C
point is reached. With further reduction in temperature, tibia length now decreases. The data contained in the present paper (see also below) tend to confirm these observations, that in the neighborhood of I ~ O C fly size is a t a maximum. On the assumption that weight is an exponential function of temperature deviation from I~OC, the following equation has been found to describe satisfactorily the observed relation of temperature to body weight, under optimum larval feeding conditions :
log W = 0.0373 - 0.0007 IT - 15 I2.O4l. (1) In this equation, W corresponds to body weight and T to temperature. rived from the preceding data which relates these three variables is:
The M dc is a function of both size and temperature. The equation de-
CHARACTER EXPRESSION I N DROSOPHILA 23 7
Here W and T have the same significance as in (I), and B represents M dc. Equations (I) and (2) may be written as
(3 )
(4)
W = I.0898 e-0.00151T-1512.041
and
B = 4.365 W0.800e-0.0159[T-1510~990.
For convenience in the following discussion, these equations will be repre- sented by
(5)
W = kl ek~lT-151~3
From equation ( 5 ) it follows that at any given temperature, the rate of change in body weight is given by
and the amount of change, AW, over a small temperature interval, A T , is (8)
(9)
Aw 2 klk2k3 [T - 15 Ik3-1ek21T-151k3AT which by substitution from (5) becomes
AW
A
kzk3lT-
15 Jk3-'WAT.Equation (6) is of the form B = f(W, T). As a resuIt of partial differentia-
tion of this equation with respect to W, it is seen that as temperature changes, a t any instant the rate of change in the M dc linked with the size change may be expressed as
and the amount of change in the M dc linked with the size change (ABw) as
(1 1) ABw 2 k4kgWk~--lek6[T-151klAW.
This by substitution from equation (9) and then ( 6 ) and simplification becomes
ABw k2k3k6 IT - 15 Ika-lBAT. (1 2)
238 JAMES V. NEEL
while the amount of change in the M dc due directly
td
the temperature change (ABT) isABT k4ksk7Wk5[T - 1 5 ] ~ 7 - ~ e ~ 6 [ ~ - ~ ~ l ~ ~ A T . (14)
(1.5) This by substitution from equation (6) becomes
ABT 1 ksk?[T - 15Ik'-lBAT.
Over a vanishingly small temperature interval, the ratio of the amount of change due to an indirect effect of temperature to the amount due to a direct effect is
ABw k2k3k6 IT - 15 Ik3-lBAT kzkak6
- - - -- - (T - 15 l k 3 - k 7 . (16)
ABT k6k7[T - 15Ik7-lBAT k6k7
After substitution of the numerical values of the above constants, which are given in equations (3) and (4), equation (16) reduces to
In order to evaluate the ratio of indirect to direct temperature effects over an infinitesimal temperature range at any given temperature, it is necessary only to substitute that given temperature for T of the equation. This substitution has been carried out at 1°C temperature intervals over the whole range employed (14.0-2g.o"C). The results are given below.
T 14" 15" 16" 17" 18" 19" 20" 21' 22' 23'
0.16 0.0 0.16 0.33 0.51 0.69 0.87 1.05 1.23 1.42 ABw
-
AB,24' 25" 26" 27" 28" 29"
1.61 1.80 1.98 2 . 1 7 2.36 2.56
Here again, in agreement with the results given in table 3, it is found that under these conditions the role of the indirect effect is greatest a t high temperatures. The chief difference between the results of the two evaluations is that the second method consistently assigns to the indirect effect a smaller value than does the first.
THE DICHAETE MUTANT
These findings concerning the role played by a size factor in the p y d
CHARACTER EXPRESSION IN DROSOPHILA 239
liminary survey of the literature the Drosophila melanogaster mutant Dichaete ( D , 3-40.4-41.0t-) was chosen for an analysis of the type con- ducted on pyd. BRIDGES has shown that this mutant is associated with a short inversion of 3L (MORGAN, BRIDGES, and SCHULTZ 1937). The char- acter is dominant, lethal when homozygous, and in addition to other morphological effects is characterized by a reduction in the number of chaetae present. The dorsocentral bristles are particularly likely to be affected. Either one or both of the two normally present on a side may be missing. When only one is absent, it usually corresponds to the anterior dorsocentral. Occasionally, when one bristle is missing, the remaining does not correspond strictly to either the anterior or posterior dorsocentral, but is located a t some point between the usual positions of these two. The character was studied in a balanced Lyra/Dichaete line.
PLUNKETT (1926) found that with an increase in temperature there is a marked decrease in the mean number of posterior dorsocentrals present per side per fly (M p dc) in Dichaete flies. At 24.soC, where the duration of the egg-larval-pupal period is 9.5 days, temperature was reported to
TABLE 4
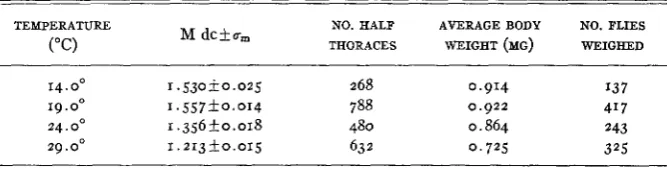
The relation of bristle number and body weight to temperature i n Dichaete Drosophila melanogaster males. M dc represents the mean number of dorsocentral bristles present per side per j y .
-
TEMPERATURE NO. HALF AVERAGE BODY NO. FLIES
M dckum
("C) THORACES WEIGHT (MG) WEIGHED
14.0' 1.530+0.025 268 0.914 I37
19. oo 1 . 5 5 7 k 0 . 0 1 4 788 0.922 417 24. Oo 1 . 3 5 6 f o . 0 1 8 480 0.864 243
29.0" 1.213+0.015 63 2 0 , 7 2 5 325
have an effect upon bristle number from the second to the eighth days. Puparium formation was found to mark the approximate mid-point of the tempera ture-eff ective period.
In the present work the criterion of size and temperature effects has been the mean frequency of occurrence of both the anterior and posterior dorso- centrals (M dc), rather than the mean frequency of occurrence of the posterior dorsocentral alone (M p dc) studied by PLUNKETT. This is due to the occasional difficulty, when only one dorsocentral is present, in defi- nitely identifying it as anterior or posterior.
The relation between temperatwe and M dc
240 JAMES V. NEEL
1.557fo.014 when the temperature decreased from 29.0~ to 19.ooC.
However, an additional s0C decrease, from 19.0' to 14.0°C, was without significant effect upon bristle number. It is of interest to note that the
19.0"C flies are 2 7 percent heavier than the 29.0°C group, and also slightly
heavier than the 14.ooC group. Already in these data there are indications of a parallelism between size and M dc. PLUNKETT (1926) found that in his stock a temperature decrease over the lower part of the range employed did have an effect upon M dc, since the N p dc a t 2o.o0C was .439 f 0.013,
a t 17.ooC 0.581 _+0.023, and a t 14.ooC 0.690+0.036.
T h e correlation between j l y size and Dichaete expression, at constant temperature
Groups of D flies were raised at a constant temperature but a t different nutritional levels and the relation between M dc and average weight de- termined. The D relation appears to be different from that observed for
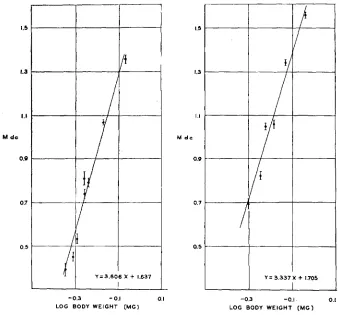
p y d . Whereas in the latter instance an approximation to a straight line was obtained when log M dc was plotted against log average body weight, in the former a straight line relation was observed with a semi-log plot. This is evident from figure 5 , where for eight groups of flies of different average sizes raised at 24.ooC, M dc has been plotted against log mean body weight. The equation of the regression line fitted to these points is
P
= 3.606X+
1.637where Y corresponds to M dc and X to log mean body weight. The mean- ing in this apparent difference in the relation of M dc to weight in pyd and
D
is not at present clear.In figure 6 is shown the 19.0"C regression of M dc on body weight. As at
24.ooC, so here an approximation to a straight line is obtained when log weight is plotted against M dc. The equation of the line of best fit to these data is
Y = 3.337x
+
1.705.The standard error of mean body weight has not been indicated in these figures. The calculation of this constant by the method given earlier de- mands data on the CV of individual body weight, and such data were not available for Lyra/Dichaete flies.
CHARACTER EXPRESSION I N DROSOPHILA 241
conditions; the M dc and weight for these flies has been given in table
4. By a fortunate coincidence, flies of the other group, grown under less favorable conditions, had an average body weight of 0.726 mg, which is
almost identical with the body weight of the 29.ooC flies. The M dc for this group was I . 139
k
0.02 I .1.5
1.3
e
I .I
M d c
0.0
0.7
0.5
Y = 3 . 6 0 6 X t 1.637 I
I
Y = 3.337 X + 1.705
1
-0.3-
0.1 0. ILOG BODY WEIGHT ( M G )
-0.3 -0.1 0.1 LOG BODY WEIGHT ( M G )
FIGURE 5 (left).-The relation, in D fles, between M dc and log average body weight Each point represents a group of flies raised a t a particular nutritiona! level a t 24.ooC. The limits of plus or minus one times the standard error of the M dc are indicated by vertical bars, as before.
FIGURE 6 (right).-As above, but a t 1g.o0C.
T h e relation between M dc and length of larval life, at constant temperature
As in the pyd case, so for
D
it is necessary to determine whether the in- crease in length of larval life a t lower nutritional levels is correlated with the M dc. PLUNKETT (1926) noted that in D flies malnutrition resulted in242 JAMES V. NEEL
lowered M p dc. Each of these three factors (malnutrition, maleness, Minutes) was observed to "decrease the size of the flies as well as the rate of development and the mean bristle numbers" (p. 229). Although it was recognized that the data then available were inadequate to analyze the interrelations among these three phenomena, it was thought more probable that the observed decrease in the M p dc was correlated with the increase in the length of developmental time than with the size decrease. Lyra/Dichaete eggs laid over a two-hour period were placed a t 19.0'C
under somewhat overcrowded conditions. When puparium formation be- gan, new puparia were isolated every four hours. Each fly after emergence was classified as to femur length and total number of dorsocentrals, and the bristle numbers of equal sized flies compared. The data are given in table 5 . Within the limits of this experiment there is no evidence that length of larval life is correlated with the number of dorsocentrals present in D flies.
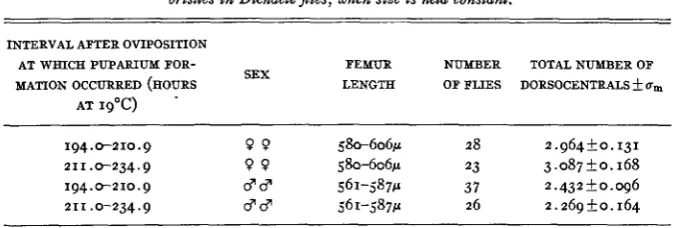
TABLE 5
The absence of correlation between length of egg-larval Iije and total number of dorsocentra,! bristles i n Dichaete flies, when size i s held constant.
INTERVAL AFTER OVIPOSITION
AT WHICH PUPARIUM FOR- FEMUR NUMBER TOTAL NUMBER OF
MATION OCCURRED (HOURS SEX LENGTH OF FLIES DORSOCENTRALS k a,
AT 19OC) .
194.0-210.9 9 9 580-606p 28 2.964fo.131
21 I .0-234.9 9 9 580-606~ 23 3.087 f 0.168
194.0-210.9 33 561-$37~ 37 2,432 -t 0.096
211.0-234.9 33 561-587~ 26 2.269 * o . 164
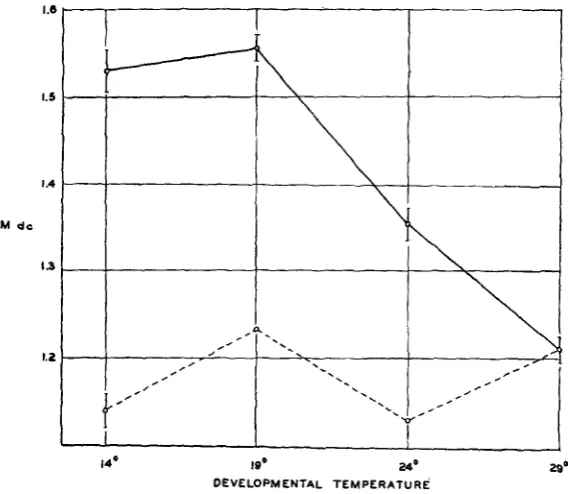
A n evaluation of the manner of action of temperature
The roles of indirect and direct temperature effects may now be briefly evaluated (figure
7).
The upper, solid line of figure 7 connects circles show- ing the values obtained for the M dc at each of the four experimental tem- peratures when fly size was maximum a t that temperature. Circles con- nected by the lower, broken line indicateM
dc values to be expected a t the same four temperatures if flies were the same (29.0"C) size a t all temperatures. The four points connected by this lower, broken line are :I ) The M dc obtained for the 29.0"C flies, 2) the M dc which the regression
equation indicates would be found at 24.0"C if average weight were equal to that of the 29.0"C flies, 3) the M dc which from the regression equation would be expected at 19.0'C if average weight were the same as observed a t
CHARACTER EXPRESSION I N DROSOPHILA 243
lower than that observed a t 29.ooC; at 19.0°C, somewhat higher. In no case is there a wide departure from the 29.0"C value. I t cannot be told at present whether the irregularities in the values are of some significance or whether they represent chance deviations from a straight line whose slope may be small and positive, small and negative, or of zero value. Yet it is quite apparent that in
D,
under these experimental conditions the ef- fect of temperature upon the M dc would either be small or non-existent ifthe flies raised a t the different temperatures all had the same average weight.
1.5
I A
M de
1.3
1.2
14' 1 9 O 24' DEVELOPMENTAL T E M P E R A T U R ~
FIGURE jr.-The effect of temperature upon the M dc of D flies. The upper, solid-line curve shows the effect of temperature upon the M dc when body size changes at the various tempera- tures are uncontrolled. The lower, broken line shows the calculated effect of temperature if size were the same a t all temperatures. Details in text.
The efect of temperature during the pupal period
PLUNKETT reported that the temperature-effective period in
D
extends over the major portion of larval and pupal life. I t was found that when lar- val life was spent at 24.5OC and pupal a t 17.ooC, the M p dc was the same as when larval life passed at 17.ooC and pupal at 24.soC, that is, "the ef- fect of a higher temperature is the same whether applied to the larval pe- riod alone or the pupal period alone" (p. 206). Later work (ROBERTSON244 JAMES V. NEEL
of the bristles in wild-type flies begins early in the second day of pupal de- velopment. I n view of the difficulty of reconciling this finding with that of PLUNKETT concerning the duration of the temperature-eff ective period, a repetition of the experiment was undertaken.
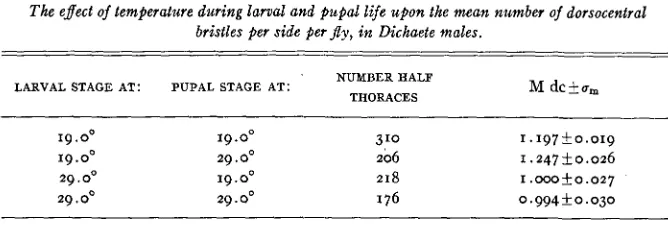
Larvae were raised a t 19.0' and 29.0'C. When puparium formation be- gan, puparia were collected every four hours. Those formed a t 19.0'C were divided into two lots, one of which continued to develop a t 19.ooC, and an- other which completed development a t 29.ooC. Similarly, one half of the puparia formed a t 29.0"C completed development a t this temperature, while the others were placed in the 19.0"C incubator. The results of this
TABLE 6
The effect of temperature during larval and pupal life upon the mean number of dorsocentral bristles per side per j l y , in Dichaete males.
LARVAL STAGE AT: PUPAL STAGE AT: NUMBER HALF
THORACES M dc+um
19.00 19.0" 3'0 I.197+0.019
19.0' 29.0' 206 I . 247 k0.026
29.0" 19.0" 218 I .oo0+0.027
29.0' 29.0' 176 0.994fO ,030
treatment are shown in table 6. No effect of temperature during the pupal period is evident. This lends further confirmation to the idea of tempera- ture working largely through its effect on size or a factor common to size and M dc. No reason for the discrepancy between these and PLUNKETT'S results can be advanced. (The M dc values given here are considerably lower than those given in table 4 for
D
flies raised under optimum food con- ditions. This is due to the higher larval densities per unit food in these ex- periments).DISCUSSION
CHARACTER EXPRESSION IN DROSOPHILA 245
changes to this effect. In this paper an attempt has been made to do this for two mutants under certain conditions. The Dichaete data, although presenting certain irregularities commented on above (p. q ) , indicate a negligible effect of temperature on mutant expression when there is no size change. In the polychaetoid case, analysis shows that only a minor portion of the temperature effect is due to a direct and differential action of tem- perature upon some bristle-forming processes, and that the role of this di- rect effect, relative to the total M dc change, is greatest a t the low temper- atures.
How general is the situation described for these mutants? In a survey of the Drosophila literature, a number of cases were found where the correla- tions of both size and temperature with the expression of a given character are known. These cases are summarized in table 7. While the list makes no pretense to completeness, it is probably representative. Some of the char- acters treated there are wild-type and some mutant. The correlation of decreased size with character expression is not always clearly stated as such in the literature. Thus, it is not uncommon to find references to a “starvation effect” or a “crowding effect” (where excess food is not sup- plied) in character expression. Obviously in these cases decreased size is involved.
In most of the eleven cases listed in the table we find that the characters studied are oppositely correlated with increased size and with increased temperature (attended as the latter is by a size decrease). The two clear exceptions to the general rule are infra-bar and number of teeth in the wild-type sex-comb.
Is this general agreement in the literature a mere coincidence, or is there a causal relation, namely, is the effect of temperature in part a t least through the medium of body size or some factors common to size and the characteristic? Certainly an answer to this question cannot be given at present. For none of the cases listed can conclusions be drawn until it is known what effect temperature has when body size is held constant at the various temperatures, and further, what role increase in length of larval life plays. It is to be expected that the part played in the temperature ef- fect by size factors will be found to vary from mutant to mutant, just as it seems to differ for the pyd and
D
cases reported here.A large amount of work has been done towards determining, for various mutants, the time during development a t which temperature exerts its ef- fect upon mutant expression. To cite one example, CHILD (193513) has re- ported that in the case of the scute-1 mutant, over a temperature range from 1 8 O to 30’ “the temperatbre-effective period in any one fly lies en-
246 JAMES V. NEEL TABLE 7
A comparison of the correlation between character expression and a ) increased temperatwe and b) in- creased body size. The symbol (+) in column z indicates that the expression of the normal or mutant character i s better (more pronounced) at a high temperature, while a (-) indicates a poorer manifesta- tion at the high temperature. The symbol (+) in column 4 indicates that the wild-type or mutant
character i s better expressed at large sizes, while (-) indicates poorer manifestation with increasing size.
HOW CORRE- HOW CORRE-
LATED WITH LATED WITH
INCREASED INCREASED
CHARACTER INVESTIGATOR INVESTIGATOR
TEXPERATURE SIZE
wild-type wing - ALPATOV and PEARL
+
AUATOV (1930)~EIGENBRODT (1930), HERSR and WARD
length (19291, ALPAToV (1930), GAUSE (1931)
(1934, IMAI (19331, STANLEY (1935)
fore-femur length
-
ALPATOV and PEARL+
NEEL (this paper) (19291, I M A I (I932),NEEL (unpub.)
number of teeth in
+
COMBS (1937) wild-type sex-comb+
CASTLE, CARPEN-TER, CLARK, MAST, and BARROWS (1906) Bar series of eye
shape alleles
a. Bar and dou-
+
SEYSTER (1919), KRAP- f. MARGoLIs (193S),ble-bar KA ( I ~ z o ) , ZELENY BODENSTEIN (1939)
(1923), A. H. HERSH (1924), E. C. DRIVER (1926, 1931)
b.infra-bar and
-
LUCE (1926), 0. W.-
LUCE (1931)double infra- DRIVER (1931)
bar
vestigial wings
-
ROBERTS (1918), HARN-+
HARNLEY (1930)LEY (I930), STANLEY CHILD (19391
(19361, REDEL (1937) (1931), LI and TSUI
scute bristles some bristles CHILD (1935a) some bristles CHILD (1936)
increase in increase in
frequency, frequency,
others de- others de-
crease crease
the D. funebris mu- NEEL (1937) tants
ascute
+
- -
evaginated
+
interrupted
+
CHARACTER EXPRESSION I N DROSOPHILA 247
of the egg-larval development has been completed” (p. 154). Other cases where temperature is reported to have an effect only during a brief portion of the egg-larval-pupal life are numerous.
Available evidence indicates that the effects of temperature on size are distributed over a considerable portion of larval life (IMAI 1937). How is this evidence to be reconciled with the usual relative briefness of the tem- perature-effective period, if a size factor generally plays a role in tempera- ture effects? As a possible answer to this question, capable of experimental tests, it is suggested that both gross size and the expression of a given char- acter may depend upon some such factor as metabolic level. But whereas size is influenced by the metabolic level of the entire larval period, char- acter expression is primarily dependent upon metabolic level a t the time of active differentiation of the character. This time may be only a minor portion of the larval period, and would correspond to the temperature-ef- fective period. Changes in the metabolic level at this time would have a much more profound effect upon character expression than on size.
The present work has shown that under a given set of experimental con- ditions elimination of size changes is attended by a reduction in tempera- ture effects on bristle numbers. It remains to be determined whether this correlation ever breaks down, and if so, to what extent. From the reason- ing of the above paragraph it appears possible that there exist periods in development where a decrease in nutritional level would have an effect upon the expression of a given character out of proportion to the effects on gross size.
At the end of the embryonic determination period of any part, the “size- effective’’ period for that part must come to an end. Accordingly, the ex- ploration of the role of a general size factor in character expression should involve a measurement of larval or pupal size during and at the end of the embryonic determination of the character. This would not only involve working with larvae, but would necessitate an exact knowledge of the de- termination period. The assumption is therefore implicit in all this work that adult size is proportional to larval size a t the time of determination.
ACKNOWLEDGMENTS
It is a pleasure to acknowledge my indebtedness to DR. CURT STERN for advice throughout the entire course of this work, and to DR. D. R. CHARLES and DR. ROBERT RAMSEY for aid during the preparation of the manuscript, particularly in connection with the more statistical portions
of the analysis.
SUMMARY
248 JAMES V. NEEL
of Drosophila melanogaster is correlated with fly size. This is shown in three ways :
a. When groups of male flies are raised a t varying nutritional levels, a double log plot of the mean number of dorsocentral bristles present per side per fly (M dc) against average body weight yields a straight line.
b. In individual flies, the correlation between femur length and the total number of dorso-centrals present on both sides of the fly or the total length of all dorsocentrals present is high.
c. I n individual flies, the correlation between weight and total number of dorsocentrals is significant.
2 . Increase in length of larval life is not correlated with the M dc of
polychaetoid flies.
3. A decrease from 29.0' to 14.ooC in the temperature a t which de- velopment proceeds results in an increase in the
M
dc, from 3.058 k0.022to 4.533 k0.033. But a t the same time there is an increase in mean weight, from 0.784f0.003 to 1.061 ko.006 mg.
4. Equations for the regression of log M dc on log mean body weight a t the various experimental temperatures employed are established. From these it is shown that under the present experimental conditions the great- est part of the total M dc change observed over the entire temperature range is correlated with the effect of temperature upon imaginal size.
5. In groups of Dichaete males of different average sizes raised a t the same constant temperature, the relation between M dc and log average body weight appears to be linear.
6. No evidence is found for a correlation between length of larval life and the M dc of Dichaete flies.
7. When temperature is decreased from 29.0' to 14.0°C, the M dc in- creases from 1.213 ko.015 to 1.530fo.025. However, over the same tem- perature range average body weight increases from 0.725 to 0.914 mg.
8. It is shown that if the size of Dichaete flies did not change from one temperature to another, there would be no or only a very slight change in the M dc.
9.'The application of these findings in the interpretation of other data concerning the effect of temperature upon character expression is dis- cussed.
LITERATURE CITED
ALZATOV, W. W., 1930 Phenotypical variation in body and cell size of Drosophila melanogasler. Biol. Bull. 58: 85-103.
ALPATOV, W. W., and PEARL, R., 1929 Experimental studies on the duration of life. XII. Influence
CHARACTER EXPRESSION I N DROSOPHILA 249
BODENSTEIN, D., 1939 Investigations on the problem of metamorphosis. V. Some factors deter-
BREHME, K. S., 1939 A study of the effects on development of ‘<Minute” mutations in Drosophila
BRIDGES, C. B., 1932 Apparatus and methods for Drosophila culture. Amer. Nat. 66: 250-273.
CASTLE, W. E., CARPENTER, F. W., CLARK, .4. H., MAST, S. O., and BARROWS, W. M., 1906 The effects of inbreeding, crossbreeding, and selection upon the fertility and variability of Dro- sophila. Proc. Amer. Acad. Arts Sci. 41 : 731-786.
CHILD, G. P., 1935a Phenogenetic studies on scute-1 of Drosophila melanogaster. I. The associa- tions between the bristles and the effects of genetic modifiers and temperature. Genetics 20:
109-126.
19351, Phenogenetic studies on scute-r of Drosophila melanogaster. 11. The temperature- effective period. Genetics 20: 127-155.
1936 The effect of starvation on the mean bristle numbers of SG-I in Drosophila melanogaster.
Amer. Nat. 70: 43-44.
1939 The effect of increasing time of development a t constant temperature on the wing size of vestigial of Drosophila melanogaster. Biol. Bull. 7 7 : 432-442.
COMBS, J. D., 1937 Genetical and environmental factors affecting the development of the sex- combs of Drosophila melanogasler. Genetics 2 2 : 427-433.
DRIVER, E. C., 1926 The temperature effective period-the key to eye facet number in Dro- sophila. J. Exp. Zool. 46: 317-332.
1931 Temperature and gene expression in Drosophila. J. Exp. Zool. 59: 1-28.
gaster. J. Exp. Zool. 59: 29-44.
Physiol. Zool. 3: 392-411.
Drosophila funebris und Drosophila melanogaster. Biol. Zbl. 51 : 209-218.
melanogaster with sexually dimorphic effects. J. Exp. Zool. 56: 363-368.
sophila. J. Exp. Zool. 39: 55-71.
heterozygotes of vestigial in Drosophila melanogaster. J. Exp. Zool. 61 : 223-244.
39: 43-53.
mining the facet number in the Drosophila mutant Bar. Genetics 24: 494-508.
melanogaster. Genetics 24: 131-161.
DRIVER, 0. W., 1931 Temperature effective periods in reciprocal crosses in Drosophila melano-
EIGENBRODT, H . J., 1930 The somatic effects of temperature on a homozygous race of Drosophila.
GAUSE, G. F., 1931 Uber den Einfluss verkiirster larvaler Ernahrungszeit auf die Eiergrosse von
HARNLEY, M. H., 1930 A critical temperature for lengthening of the vestigial wings of Drosophila
HERSR, A. H., 1924 The effect of temperature upon the heterozygotes in the Bar series of Dro-
HERSH, A. H., and WARD, ESTHER, 1932 The effect of temperature on wingsize in reciprocal
HERSH, R. K., 1924 The effect of temperature upon the full-eyed race of Drosophila. J. Exp. Zool.
HUXLEY, J. S., 1932 Problems of relative growth. xix+276 pp. New York: The Dial Press. IMAI, TAKEO, 1933 The influence of temperature on variation and inheritance of bodily dimen-
sions in Drosophila melanogaster. Arch. EntwMech. Org. 128: 634-660.
1937 Influence of temperature on the growth of Drosophila melanogaster. Science Reports Tohoku Imp. Univ. 11: 403-417.
KRAFKA, J. JR., 1920 The effect of temperature upon facet number in the Bar-eyed mutant of Drosophila. J. Gen. Physiol. 2: 409-464.
LI, J. C., and TSUI, Y. L., 1936 The development of vestigial wings under high temperature in Drosophila melanogaster. Genetics 21 : 248-263.
LUCE, W. M., 1926 The effect of temperature upon infra-Bar, an allelomorph of Bar eye in Dro- sophila. J. Exp. 2001.46: 301-316.
MACDOWELL, E. C., 1915 Bristle inheritance in Drosophila. Extra bristles. J. Exp. 2001. IQ:
61-98.
MARGOLIS, 0. S., 1935 Studies on the Bar series of Drosophila. I. The effect of the gene vestigial on facet number in Bar. Genetics 20: 156-171.
2 5 0 JAMES V. NEEL
NEEL, JAMES, 1937 Phenotypic variability in mutant characters of Drosophila funebris. J. Exp.
1940 The pattern of supernumerary macrochaetae in certain Drosophila mutants. (In Press.) PLUNKETT, C. R., 1926 The interaction of genetic and environmental factors in development. J.
Exp. Zool. 46: 181-24.
RIEDEL, H., 1934 Der Einfluss der Entwicklungstemperatur auf Fliigel und Tibialange von Drosophila melanogaster (wild, vestigial und die reziproken Kreuzungen). Arch. EntwMech. Org. 132: 463-508.
ROBERTS, E., 1918 Fluctuations in a recessive Mendelian character and selection. J. Exp. Zool.
SEYSTER, E. W., 1919 Eye facet number as influenced by temperature in the Bar-eyed mutant of Drosophila melanogaster (ampelophila). Biol. Bull. 37: 168-182.
STANLEY, W. F., 1931 The effect of temperature upon vestigial wing in Drosophila melunoguster, with temperature-effective periods. Physiol. Zool. 4: 394-408.
1935 The effect of temperature upon wing size in Drosophila. J. Exp. Zool. 69: 459-495.
ZELENY, CHARLES, 1923 The temperature coefficient of a heterozygote with an expression for the value of a germinal difference in terms of an environmental one. Biol. Bull. 4: 105-112.
ZOOl. 75: 131-142.