DOI: 10.1534/genetics.109.105429
Simulating the Yield Impacts of Organ-Level Quantitative Trait Loci
Associated With Drought Response in Maize: A ‘‘Gene-to-Phenotype’’
Modeling Approach
Karine Chenu,*
,†,1Scott C. Chapman,
‡Franc
x
ois Tardieu,
†Greg McLean,* Claude Welcker
†and Graeme L. Hammer
§*Queensland Primary Industries and Fisheries, Agricultural Production Systems Research Unit (APSRU), Department of Employment, Economic Development and Innovation, Toowoomba, Queensland 4350, Australia,†Institut National de la Recherche Agronomique,
Unite´ Mixte de Recherche 759, Laboratoire d’Ecophysiologie des Plantes sous Stress Environnementaux, 34060 Montpellier, France, ‡CSIRO Plant Industry, Queensland Bioscience Precinct, St. Lucia, Queensland 4067, Australia and
§
University of Queensland, School of Land, Crop and Food Sciences, APSRU, Brisbane, Queensland 4072, Australia
Manuscript received June 4, 2009 Accepted for publication September 9, 2009
ABSTRACT
Under drought, substantial genotype–environment (G3E) interactions impede breeding progress for yield. Identifying genetic controls associated with yield response is confounded by poor genetic correlations across testing environments. Part of this problem is related to our inability to account for the interplay of genetic controls, physiological traits, and environmental conditions throughout the crop cycle. We propose a modeling approach to bridge this ‘‘gene-to-phenotype’’ gap. For maize under drought, we simulated the impact of quantitative trait loci (QTL) controlling two key processes (leaf and silk elongation) that influence crop growth, water use, and grain yield. SubstantialG3Einteraction for yield was simulated for hypothetical recombinant inbred lines (RILs) across different seasonal patterns of drought. QTL that accelerated leaf elongation caused an increase in crop leaf area and yield in well-watered or preflowering water deficit conditions, but a reduction in yield under terminal stresses (as such ‘‘leafy’’ genotypes prematurely exhausted the water supply). The QTL impact on yield was substantially enhanced by including pleiotropic effects of these QTL on silk elongation and on consequent grain set. The simulations obtained illustrated the difficulty of interpreting the genetic control of yield for genotypes influenced only by the additive effects of QTL associated with leaf and silk growth. The results highlight the potential of integrative simulation modeling for gene-to-phenotype prediction and for exploitingG3Einteractions for complex traits such as drought tolerance.
C
ROP yield varies greatly among genotypes, but this genetic variation is not consistent among environ-ments. This presents a major challenge to plant breeding. Environmentally stable quantitative trait loci (QTL) were found for drought adaptation traits at the organ level. But what impacts do such QTL have on crop yield? We developed a ‘‘gene-to-phenotype’’ modeling approach that integrates physiological pro-cesses and incorporates their genetic controls. We estimated in silico the genotype–environment interac-tions that organ-level QTL might generate on yield in different drought conditions. Such a modeling ap-proach opens new avenues for crop improvement.Genotype–environment interactions—statistical vs.
predictive modeling approaches: Genotype–environ-ment (G 3 E) interactions impede plant breeding progress for complex traits such as yield and confound
the interpretation of genetic controls of adaptive traits. In drought-prone regions, the size of the yield variance component forG3Einteractions is frequently greater than the variance associated with genotype main effects (see Cooperand Hammer1996 for examples in wheat, sorghum, maize, and rice). Over the last century, numerous statistical methodologies have been devel-oped to analyze these effects and to predict the expected yield of genotypes across and/or within subsets of environments (i.e., to measure ‘‘stable/ broad’’ and/or ‘‘specific’’ adaptation). In recent years, mixed models have increasingly dealt with heterogene-ity effects across and within trials to explain genetic correlations among environments (e.g., Smith et al. 2001). The use of these models has been extended to identify quantitative trait loci (QTL) associated with yield variation and to estimate how these are influenced by various environment covariables (e.g., Boer et al. 2007). Recent developments of this method enable one to account for genetic correlations among both traits and environments (Malosettiet al.2006, 2008) and to
1Corresponding author:Queensland Primary Industries and Fisheries,
203 Tor St., Toowoomba, QLD 4350, Australia. E-mail: [email protected]
detect QTL for nonlinear functions (Ma et al. 2002; Malosetti et al. 2006), thus providing a powerful method for eco-physiologically inspired genetic models. New methods to characterize local environments as experienced by the plants (i.e., as influenced byG3E interactions) have also been proposed (e.g., Muchow et al. 1996; Chelle2005; Sadoket al. 2007; Chenuet al. 2008b). Such environment characterizations were dem-onstrated to aid the understanding of genotypic response to environment (e.g., Granier et al.2006; Chenu et al. 2007) and the unraveling of the yield variance compo-nent forG3Einteractions (Chapman2008). In a recent review, Cooperet al.(2006) discussed opportunities to apply mixed-model methods to exploitG 3 E interac-tions. A major challenge for these statistical methods is how to deal with the complex interactions occurring within plants among genes and among traits, asG3 E interactions for yield result from the integration over time of a multitude ofG3Einteractions at various organism levels (VanEeuwijket al.2005; Cooperet al. 2009).
Biophysical simulation models that integrate physio-logical processes and their associated genetic controls can contribute to the interpretation of G 3 E inter-actions at different organism levels, including yield (Hammer et al. 2002; Tardieu 2003; Yin et al. 2004; Chapman2008). Such predictive models are appropri-ate to describe and explorein silicomultiple combina-tions of genotypes (as defined by their alleles) and environments. Single physiological traits are usually governed by a multitude of genes, but analyzing a combination of only 10 genes with two alleles in 10 environments requires data for almost 600,000 combi-nations (3103 10 when including heterozygotes). The
enormous number of combinations that breeders would ideally analyze to identify best-adapted genotypes highlights a major interest for predictive approaches. Novel QTL-based or gene-to-phenotype modeling approaches have been developed to predict gene-to-phenotype associations at the crop level, largely focus-ing on genetic controls associated with plant phenology (e.g., Hoogenboom et al. 2004; Messina et al. 2006). However, the simulation of genes/QTL for complex traits, such as the responses of plant growth and archi-tecture to environment, remains a challenging issue, which requires the modeling of physiological processes that are stable across environments (Yin et al. 2000; Tardieu 2003; Hammer et al. 2006). We propose to illustrate the utility of such a modeling approach with an example for maize under drought.
Controls of key organ-level processes for drought adaptation in maize: Under drought conditions, the coordination of growth processes to efficiently utilize the scarce water supply and the sensitivity of grain production to stress are two key attributes of yield performance. In maize, substantial genetic variation has been observed in drought responses of leaf elonga-tion rate (Reymondet al.2003), which influence canopy
development and thus transpiration and crop water use. Significant genetic variability has also been observed for drought response of ear growth rate around flowering and for response of grain number per ear at maturity (Edmeades et al. 1993; Vargas et al. 2006). A short anthesis-silking interval (ASI) (Ribaut et al. 1997) is an indicator of these effects and has been used effectively in selection for improved yield under drought (Bolan˜ os and Edmeades 1993, 1996; Chapman et al. 1997a,b; Chapmanand Edmeades1999). Recently, several QTL affecting both leaf elongation and ASI have been found to colocalize (Welckeret al.2007).
Sufficient understanding of leaf elongation has been developed to propose a physiological and genetic model of leaf elongation response to drought (see Chenuet al. 2008a for additional details). Temperature, evaporative demand, and soil water deficit were identified as major environmental factors determining leaf elongation rate over periods of hours and days, whereas light and plant carbon balance had minor effects (Ben Haj Salah and Tardieu 1996, 1997; Tardieu et al.1999; Sadok et al. 2007). The parameters for the response curves of leaf elongation rate to temperature (or ‘‘potential leaf elongation rate,’’ parameter ‘‘a’’), evaporative de-mand (‘‘b’’), and soil water status (‘‘c’’) were found to be genotype specific and stable across environments (Ben Haj Salahand Tardieu1996; Reymondet al. 2003). QTL for these parameters were detected in two pop-ulations of temperate maize lines and several of these QTL colocalized with those identified in a tropical maize population (Reymond et al. 2003; Sadok et al. 2007; Welcker et al. 2007). Using such ‘‘environmentally stable’’ QTL to model leaf elongation rate avoids com-plex QTL–environment interactions that are commonly observed for directly measured traits such as leaf length (Reymond et al. 2004). Leaf elongation rate was suc-cessfully simulated over several days in different environ-ments for novel inbred lines defined only by their alleles at the QTL (Reymondet al.2003). Chenuet al.(2008a) incorporated this organ-level model (with time steps of minutes to hours) into the APSIM–Maize crop simula-tion model and hence captured the complex interac-tions of plants with their environment (e.g., the feedback of leaf growth on soil water depletion) during the entire crop cycle. For a maize hybrid, Dea, the model produced accurate predictions of leaf area, biomass, and grain yield when tested against independent data from con-trasting environments (Chenuet al.2008a).
rate of both the leaf and silk tissue. The yield of 1000 hypothetical recombinant inbred lines (RILs) was simu-lated under managed drought patterns (Tlaltizapa´n, Mexico) to describe the ‘‘yield–fitness adaptation land-scape.’’ A second set of simulations was conducted for a sample of years in a rain-fed production region (Sete Lagoas, Brazil) to evaluate in silico the effects for the drought patterns experienced in a field production system. These simulations mimicked ‘‘QTL experiments’’ and were used in mixed-model analyses to quantify the yield impact of individual leaf elongation QTL, either with or without their pleiotropic effect on silking and consequent grain set.
MATERIALS AND METHODS
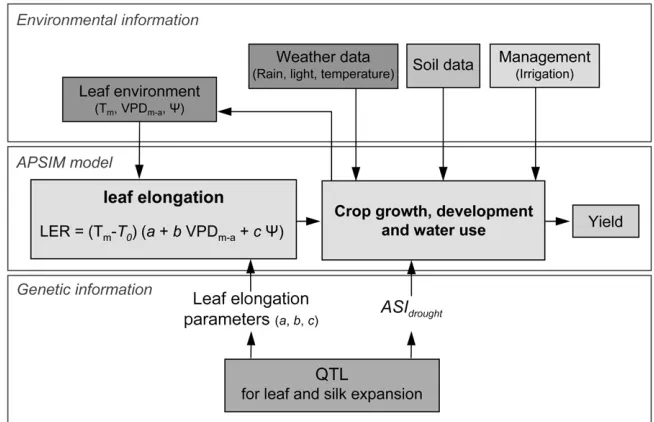
Overview: The APSIM crop model was adapted to allow simulation of the effects of QTL on both leaf and silk elongation (Figure 1). This model uses (i) genetic inputs with genotype-specific parameters that characterize different plant traits and (ii) environmental inputs (daily weather data, soil characteristics, and crop management such as sowing date or irrigation) to calculate phenotypic values for crop growth, development, and ultimately grain yield (outputs of the model). In this study, only the parameters related to drought response of leaf elongation rate (parametersa,b, andc) and ASI (ASIdrought) were modified among genotypes. Two hypo-thetical RIL populations were generated on the basis of known major QTL for leaf elongation parameters (Table 1, Figure 2), using the quantitative genetics simulation model QU-GENE Figure1.—Schematic view of the ‘‘gene-to-phenotype’’ model showing how the leaf elongation module interacts with the rest of the APSIM crop model. Environmental and genetic information is used as inputs to simulate leaf growth, crop growth and development, and grain yield. Leaf elon-gation rate (LER) is a function of leaf environmental factors [Tm, meristem tem-perature; T0, base temperature; VPDm-a, meristem-to-air vapor pressure deficit; c, predawn leaf water potential (negative val-ues)] and leaf elongation parameters (a, potential leaf elongation rate; b, response of leaf elongation rate to VPDm-a; and c, response of leaf elongation rate toc). High leaf elongation rate (LER) in a given envi-ronment is favored by high values of param-etersaandband low values ofc(i.e., LER favored by high potential leaf elongation rate and low sensitivity to either high evap-orative demand or soil water deficit).
TABLE 1
QTL for parameters of potential leaf elongation rate (a), response to evaporative demand (b), and response to soil water deficit (c) and for ASI response to drought
Additive effect
QTL name Chr.
Position (cM)
a (mm°Cd1)
b
(mm°Cd1kPa1)
c
(mm°Cd1MPa1)
ASIdrought (d)
qb1 1 154 0.080
qa1qb2 1 271 0.147 0.080
qa2 2 84 0.158
qc1 2 174 0.289 0.5
qa3qb3qc2 3 67 0.152 0.063 0.259
qc3 4 242 0.277
qb4qc4 5 79 0.065 0.261 0.5
qa4qb5qc5 5 186 0.228 0.064 0.259 0.5
qa5qb6qc6 8 92 0.184 0.051 0.302 0.5
qa6qc7 9 67 0.207 0.309
qb7qc8 10 0 0.060 0.257
The chromosome, the position, and the additive effect of the parent 1 allele are presented for all the QTL. QTL are named after the leaf parameter(s) they affect (e.g., qa1qb2 affects the parametersaandb). Values ofa,b,c, andASIdroughtwere 5.054 mm per degree day (mm°Cd1),0.948 mm°Cd1kPa1, 4.842 mm°Cd1MPa1, and 6 days for parent 1 and 5.986 mm°Cd1,1.552 mm
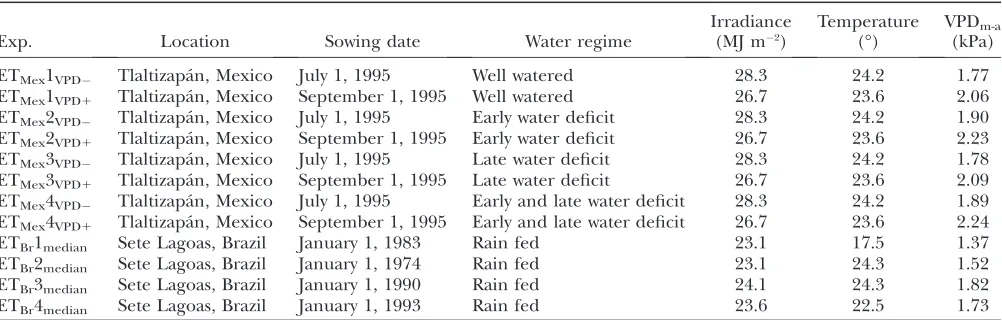
(Podlichand Cooper1998). The QTL of the first population generated were assumed to control leaf elongation alone (Reymondet al.2003), whereas in a second population they were assumed to influence both leaf and silk elongation (Welckeret al.2007). The yield phenotype of each line was simulated using an adapted APSIM crop model (Chenuet al. 2008a). A first set of simulations was carried out to determine gene-to-phenotype consequences on yield in managed drought environments with contrasting soil water contents and evaporative demands (resulting from different sowing dates and irrigation managements at Tlaltizapa´n, Mexico). A second set of simulations was conducted to estimate effects on yield of individual QTL for representative conditions experi-enced in a rain-fed maize-growing region (Sete Lagoas, Brazil; Table 2).
Phenotype prediction—a crop model to account for leaf and silk growth effects on yield: Like most crop models, APSIM (http://www.apsim.info/apsim/) simulates the pro-cesses of growth and development of a genotype (usually a com-mercial cultivar) in response to external environment variables. In this biophysical simulation model, the crop/genotype is defined by a set of parameters associated with algorithms that describe physiological processes (e.g., leaf development, solar radiation interception, water uptake, biomass and nitrogen accumulation, and retranslocation). The APSIM model has been extensively tested, in a broad range of conditions, during the last 20 years (http://www.apsim.info/apsim/). For each environ-ment, the model accepts as input descriptions of soil, weather data, and management decisions (e.g., date of irrigation and amount of water supplied). It operates on a daily time step to simulate the growth and development of the crop over time and
generates phenotypes for a multitude of traits, including crop leaf area, biomass, the quantity of water transpired every day, and the grain yield at harvest.
The standard maize crop model of the APSIM simulation platform (Wanget al. 2002; Keatinget al.2003) was extended by inclusion of the modified module for leaf development and expansion (Figure 1) by Chenuet al. (2008a). This allowed inputs of leaf response parameters (a,b, andc) calculated from the QTL allelic combination of any genotype. The modular design of APSIM facilitated such model development, by enabling the replacement of existing daily leaf-growth rou-tines with new hourly leaf-growth rourou-tines based on the leaf elongation rate (LER) model.
To incorporate the genetic variability for silk elongation and ASI in response to changes in growth rate due to stress, an additional algorithm replaced the existing APSIM routine that described kernel development. On the basis of the model of Edmeadesand Daynard(1979) and the results of Andrade et al. (1999), kernel number (KN) was estimated from the mean plant growth rate (PGR) between 130 degree days before and 260 degree days after flowering,
KN¼KNmaxð1ekðPGRPGRbase;gÞÞ; ð1Þ
kernels to be initiated. Drought-tolerant genotypes have a lower PGRbase,g. In practice, genetic variation inPGRbase,g is rarely measured, but is indirectly evaluated as a change in the relative timing of anthesis (pollen production on the tassel) and silking (appearance of silks from the husk), commonly referred to as ASI. Overall the ‘‘ASI effect’’ of the QTL was thus attributed to variations inPGRbase,g, while all the other variables in the model were held constant.
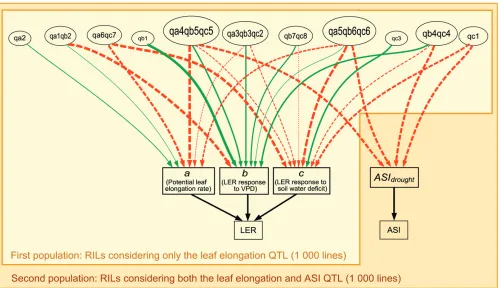
Simulated RIL populations:Eleven major QTL controlling leaf elongation rate response to drought (Table 1, Figure 2) were used to create a population of 1000 F2:8 RILs. The population was generated with the quantitative genetics simulation model QU-GENE (Podlich and Cooper 1998) and the Qu-Line/Qu-Cim breeding module (Wang et al. 2004). The QU-GENE User Interface software, together with the APSIM-LER data generated in this study, can be down-loaded from the software webpage (http://www.uq.edu.au/ lcafs/qugene/). Each QTL was assigned a location on the chromosomes and the two parents were characterized by their alleles for the QTL. Each allele was described by its additive effect relative to parent one (‘‘parent 1’’; see below). One thousand hypothetical RILs were generated from a single cross between the parents, followed by selfing (F2) and consequent single-seed descent. In a second population, which comprised the same 1000 RILs (as defined by their alleles), an additional pleiotropic effect on ASI-related traits was included for the four leaf elongation QTL known to colocalize with QTL for ASI under drought (Vargaset al. 2006; Welckeret al.2007; Figure 2).
The positions and additive effect sizes of the QTL for leaf elongation response to (i) meristem temperature (also re-ferred to as potential leaf elongation rate or parameteraof the LER model; Figure 1), (ii) evaporative demand, which was characterized by the meristem-to-air vapor pressure deficit (parameterb), and (iii) soil water deficit, which was charac-terized by the predawn leaf water potential (parameterc), were derived from experimental data reported on the cross between the two tropical inbred lines, Ac7643 and Ac7729/ TZSR W (Welckeret al.2007), also referred to as P1 and P2, respectively (Ribautet al.1996, 1997). The 11 QTL fora,b,
and c explained 55, 77, and 66% of the genetic variance, respectively. Note that no additional ‘‘undetected QTL’’ were simulated to account for the residual genetic variance.
To obtain yield estimation comparable to hybrid perfor-mance, the allelic combinations for the QTL (that defined an individual RIL) were simulated within the background growth and development characteristics known for the hybrid Dea (for detail, see Chenuet al.2008a) and with a final leaf number of 20, which is typical of medium to late season tropical maize (e.g., Chapmanand Edmeades1999) and is similar to that of the tropical lines P1 and P2 ( J. M. Ribaut, unpublished data). The values of a,b, andc for the inbred parent lines of the simulated populations (parent 1 and parent 2) were scaled from the mean values of P1 and P2 to the values of this ‘‘reference genotype’’ derived from Dea.
The QTL for silk elongation were each assigned similar effect sizes on ASI, increasing the ASI under drought (ASIdrought) with an additive effect of 0.5 day each (Vargas et al.2006; Welckeret al.2007) beyond the background value of the reference genotype of 6 days. For the first RIL population,PGRbase,g(Equation 1) was set at 1.2 g per day, a value similar to that for the hybrid used by Andrade et al. (1999). In the second RIL population, where the QTL effects on silk elongation were included,PGRbase,gvaried from 0.8 to 1.6 g per day on the basis of experimental data scaled to the reference genotype (Vargaset al. 2006; J. M. Ribaut, un-published data). As the kernel number response to plant growth rate (Equation 1) is related to ear growth (Andrade et al. 1999; Vega et al. 2001; Echarte et al. 2004) and ear growth rate determines the time of silking and ASI (Edmeades et al.1993; Borra´ set al.2007), it was assumed that the genetic variation in the KN–PGR relation (Equation 1) was related to the QTL effects for ASI. Genetic variations inPGRbase,gwere estimated as being proportional to genetic variations observed in ASI under drought (ASIdrought), with the shortest 4-day ASIdroughtcorresponding to the lowestPGRbase,gvalue of 0.8 g per day and the longest 8-dayASIdroughtcorresponding to the greatestPGRbase,gvalue of 1.6 g per day. A recent study (Borra´ s et al. 2009), published after the realization of this work, clearly
TABLE 2
Characteristics of thein silicofield experiments conducted using environmental data from Tlaltizapa´n (Mexico) and Sete Lagoas (Brazil)
Exp. Location Sowing date Water regime
Irradiance (MJ m2)
Temperature (°)
VPDm-a (kPa)
ETMex1VPD Tlaltizapa´n, Mexico July 1, 1995 Well watered 28.3 24.2 1.77 ETMex1VPD1 Tlaltizapa´n, Mexico September 1, 1995 Well watered 26.7 23.6 2.06
ETMex2VPD Tlaltizapa´n, Mexico July 1, 1995 Early water deficit 28.3 24.2 1.90 ETMex2VPD1 Tlaltizapa´n, Mexico September 1, 1995 Early water deficit 26.7 23.6 2.23
ETMex3VPD Tlaltizapa´n, Mexico July 1, 1995 Late water deficit 28.3 24.2 1.78 ETMex3VPD1 Tlaltizapa´n, Mexico September 1, 1995 Late water deficit 26.7 23.6 2.09
ETMex4VPD Tlaltizapa´n, Mexico July 1, 1995 Early and late water deficit 28.3 24.2 1.89 ETMex4VPD1 Tlaltizapa´n, Mexico September 1, 1995 Early and late water deficit 26.7 23.6 2.24
ETBr1median Sete Lagoas, Brazil January 1, 1983 Rain fed 23.1 17.5 1.37 ETBr2median Sete Lagoas, Brazil January 1, 1974 Rain fed 23.1 24.3 1.52 ETBr3median Sete Lagoas, Brazil January 1, 1990 Rain fed 24.1 24.3 1.82 ETBr4median Sete Lagoas, Brazil January 1, 1993 Rain fed 23.6 22.5 1.73
demonstrated the strong link between PGR, ear growth, and ASI.
First set of virtual experiments—simulation in managed drought environments to describe the yield-fitness adaptation landscape:In the first set of simulations, irrigation was applied to generate four managed-drought types to investigate how QTL effects translated to crop yield in contrasting climatic scenarios (Table 2, Figure 3). In these virtual experiments, crops were sown on July 1, 1995 (moderate evaporative demand environment), and September 1, 1995 (high evapo-rative demand environment), using weather data obtained from CIMMYT for their testing site in Tlaltizapa´n, Mexico (18.6°N, 99.1°W, 946 m). Irrigation was managedin silicoto obtain (i) a well-watered treatment (environment type 1, also called ‘‘ETMex1’’), (ii) an early water deficit from plant emer-gence to the beginning of the grain-setting period (ETMex2), (iii) an increasing water deficit during the grain-setting period (ETMex3), and (iv) a water deficit during both the vegetative and the grain-setting periods with an irrigation at the be-ginning of the grain-setting period (ETMex4). Environmental characteristics for these managed environments (ETMex1–4) are presented in Table 2 and Figure 3.
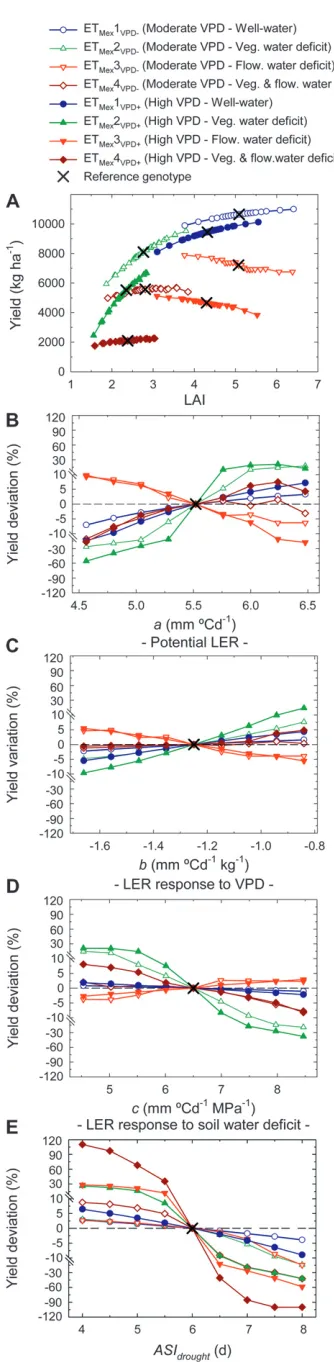
A sensitivity analysis was conducted to evaluate the impact of each of the LER and ASI parameters on leaf area and yield (Figure 4). Simulations were first performed using reference values of the different parameters (a,b,c, andASIdrought), which were set to the parental mean (i.e., value of the reference genotype). The sensitivity test was conducted by varying the value of one parameter at a time (for the full range of potential allelic values), while the other parameters remained at the reference value.
To account for the QTL effects on the different traits (‘‘QTL– trait network’’), the same simulations were then undertaken for all lines of the two RIL populations (Figure 2). The allelic combination that defined each RIL was used to calculate the values of the parameters for that RIL. Pleiotropic effects of QTL on leaf elongation parameters (due to colocalization of QTL affecting thea,b, andcparameters) were considered in simulations with the first population, while additional pleio-tropic effects on silk elongation (a, b, c, andASIdrought) were considered in the second population. The results of these simulations were represented as yield–fitness adaptation land-scapes (Kauffman1993; Podlichand Cooper1998) showing variation in yield as dependent on values of the traitsa,b, andc for the entire range of possible allelic combinations.
Second set of virtual experiments—simulation and statis-tical analysis of QTL experiments:In the second set of simu-lations, long-term simulations employing historical climate data and conventional agronomic practices were used to char-acterize and select a set of representative drought environ-ments for Sete Lagoas, Brazil (19.5°S, 44.2°W, 730 m). QTL experiments for each of these environment types were then carried outin silico, to mimic what might be experimentally done in a typical evaluation of a biparental population.
By first modeling the reference genotype (with parental mean for the values ofa,b,c, andASIdrought), the simulations were used to estimate yield and characterize the seasonal stress patterns experienced over years by rain-fed maize in this re-gion. Plants were sownin silicoon January 1 from 1960 to 2005, using the climatic data from Sete Lagoas, Brazil (SECTEC/ SIMEFO–Secretaria da Agricultura do Estado de Goia´s). They were grown in Oxisols/Latosols soils under (i) a virgin condition where an acidic subhorizon inhibits root growth beyond 30 cm depth and increases the occurrence of drought by limiting total transpirable soil water content (TTSW) to 35 mm and (ii) an ameliorated condition (incorporation of lime to increase subsoil pH) with rooting depth of 90 cm and TTSW of 90 mm (Heinemannet al.2008). For each
simu-lation, the temporal pattern of the daily fraction of transpir-able soil water (FTSW) was averaged every 100 degree days from emergence to harvest and centered around flowering. A cluster analysis was applied to these FTSW patterns, using the medoid clustering library (pam) in the R statistical package (R DevelopmentCoreTeam2008) to identify the four major environment types encountered. Similar methodologies have been used by Chapman et al.(2000) and Heinemannet al. (2008) to classify drought patterns for different target pop-ulations of environments.
The situation (combination of year and soil) that was most similar to the median of each cluster (‘‘median environment’’) was used for the QTL experiments to estimate the QTL effects on yield in the two RIL populations. The environments sampled thus represented the ‘‘best-case’’ scenario where experimental trials could be conducted to best represent the types of drought that occur in this given cropping system (i.e., soil, location, year, management). Environmental characteristics for the median situations (ETBr1–4median) are presented in Table 2.
The phenotypic data generated for the four median situations were analyzed by mixed models to estimate the effects on yield of individual QTL. Data were analyzed separately for the two populations. The analysis employed mixed models that were fitted using the ASREML library (Gilmouret al. 1997) implemented within R (R D evelop-mentCoreTeam2008) and accounted for QTL effects across multiple environments. In a first analysis, environments and known QTL were fitted as fixed main effects, and genotypes as random effects, to estimate the additive yield effects of the QTL across all environments. In a second analysis, the QTL were fitted as fixed QTL by environment effects to estimate the additive yield effects of the QTL within each environment. Residual genotypic variance components were simultaneously fitted to all four environments (Smithet al.2001) to account for heterogeneity among environments. Significance of each QTL was determined by a Wald test of the fixed effect (Boer et al.2007). Estimates were calculated of the proportion of genotypic variance explained by QTL across environments.
RESULTS
Simulated yield was increased by greater leaf elon-gation rate in well-watered and vegetative deficit envi-ronments and by lower ASI in all envienvi-ronments: To analyze the impact of drought and evaporative demand (VPD), four contrasting soil-moisture patterns were simulated for two sowing dates with fine tuning of the irrigation in a rain-free climate (Figure 3). A sensitivity analysis was conducted to estimate how the parameters for leaf elongation rate (a,b, andc) and ASI (ASIdrought) affected the simulated yield (Figure 4);i.e., the value of each parameter was varied in equal steps from the lowest to the highest value of all possible allelic combinations while other parameters were set to the mean of the parents.
Leaf elongation parameters significantly affected leaf area index (LAI) and led to an increase or a decrease in simulated yield, depending on the environment (Figure 4A; each point corresponds to a different value ofa,b, or c). In well-watered conditions (ETMex1), maximum
LAI was .5 m2of leaf per square meter of land, with
simu-lated yield of 10–12 tons ha1 (Figure 4A), which is
comparable to field observations under similar condi-tions (July plantings of 20-leaf maize genotypes) at this site in Mexico (Edmeades et al. 1999; J. M. Ribaut, unpublished data). For both planting dates (i.e., mod-erate and high VPD), parameters that increased LAI under well-watered or vegetative water deficit condi-tions had a positive impact on simulated yield with a yield increase up to 7% (well watered, ETMex1) and
21% (early stress, ETMex2), compared to the reference
genotype. In the presence of a water deficit around flowering (ETMex3–4), an increase in LAI had a
negli-gible or even a negative impact on simulated yield. Plants with the greatest LAI were particularly disadvan-taged in ETMex3, as they exhausted most of the water
supply prior to the reproductive period, which signifi-cantly affected their grain setting. For all these environ-ments (ETMex1–4), a greater VPD reduced both the
simulated LAI and yield.
In the model (equation in Figure 1), high LER in a given environment was favored by high values of parametera (i.e., high potential leaf elongation rate), high values ofb(i.e., low sensitivity to high evaporative demand), and low values ofc(i.e., low sensitivity to soil water deficit). However, when integrating these leaf elongation responses to the crop level, an increase in value of the leaf elongation parameters (a, b, and c) affected LER, LAI, and yield either positively or nega-tively depending on the environment (Figure 4, B–D), because of the plant–environment interactions (e.g., the feedback of leaf growth on soil water depletion).
Yield impact of potential leaf elongation (parameter a): The potential leaf elongation rate (parametera, Figure 4B) was a major determinant of yield, resulting in sub-stantial effects on simulated yield (from56% to121% across environments). Given its positive impact on leaf elongation and LAI, increasedawas positively correlated with the simulated yield under well-watered and vegeta-tive water deficit situations (ETMex1–2). In environments
subjected to a stress around flowering (ETMex3–4), plants
with higher values ofa, and hence greater LAI, exhausted their water supply and thus yielded less. Similarly, under a vegetative water deficit (ETMex2), plants with the greatest
values ofa(a$6 mm per degree day) consumed their water supply before the end of the vegetative period so that they had a lower simulated LAI at flowering and a reduced simulated yield.
Yield impact of leaf-elongation sensitivity to evaporative demand and water deficit (parameters b and c): In well-watered environments (ETMex1), a decrease in
sensitiv-ity to evaporative demand (higher values of parameter b; Figure 4C) or to water deficit (lower values ofc; Fig-ure 4D) had little impact on yield (,5% change in simulated yield). Both bandc had greater impacts on simulated yield under vegetative water deficits, espe-cially at high evaporative demand (ETMex2VPD1). For
the latter condition, increased b improved simulated
yield up to 14% (Figure 4C). Decreasedchad a greater impact as it improved simulated yield up to 21% under these conditions. However, when well-watered plants were subjected to a stress around flowering (ETMex3),
the increase in LAI arising from higherbor lowercled to greater water consumption and lower yield.
Yield impact of silk elongation (parameter ASIdrought):When considering the QTL effect associated with silk elonga-tion, an increased ASI (corresponding to an increased PGRbase,g) was associated with reduced simulated yield in all environments, especially when evaporative demand and water deficit were high (Figure 4E). When both vegetative and reproductive stresses occurred (ETMex4), yield was
more than doubled by favorable (low) ASI and the crop failed to yield in the simulations when ASI was.7 days.
QTL colocalization limited the possible trait combi-nations:In the sensitivity analysis (above), the full range of values was explored for each parameter, assuming no linkage between the QTL and no associations among the values of the different parameters (Figure 4). However, it had been experimentally shown that these parameters were associated with QTL that colocalized and thus formed a QTL–trait network (Figure 2). This limited the possible combinations of parameter values so that the RIL population had some gaps (shown as ‘‘white spaces’’ in Figure 5). Pleiotropic effects of the QTL for a and b were negatively correlated, as were those for band c, while those for a and c were always positively correlated (Table 1 and Figure 2). As a result, lines with the greatest potential leaf elongation rate (highest values of a) never had low sensitivity of leaf elongation rate to evaporative demand (high values ofb, Figure 5A) or low sensitivity to soil water deficit (lowc, Figure 5C). Hence, there was no possible QTL combi-nation for ideotypes that would have high leaf elonga-tion rate under both stress and nonstress condielonga-tions. In contrast, some lines with high values ofbalso had low values of c (Figure 5B) so that these lines had low sensitivity to both evaporative demand and soil water deficit. In the 1000 lines of the population (F2:8), most
lines had intermediate values fora,b, andcwhile,5% of them had extremely high (or low)a,b, orc.
QTL colocalization affected the best-yielding trait combination: Crop growth, development, and yield of each RIL were simulated in the eight managed environ-ments (four drought patterns in two
demand scenarios; Table 2 and Figure 3), taking into account the QTL effect either on leaf elongation alone or on both leaf and silk elongation (Figure 2). In both cases, an increase in evaporative demand tended to increase the effect ofa,b, andc, so only the results for the high evaporative demand conditions are presented (Figure 6). Figure 6, A and B, depicts the average effects of individual parameters on simulated yield, with values constrained by QTL colocalizations (Figure 2), while Figure 6, C and D, presents these effects for the different combinations of parametersa,b, andc, as yield–fitness adaptation landscapes.
First population (RILs considering QTL for leaf elongation alone):Compared to the sensitivity analysis, in which leaf elongation parameters were varied one at a time (Figure 4, B–D), the inclusion of pleiotropic QTL effects for the leaf elongation parameters (first population; Figure 2) reduced the average impact ofa,b, andcon simulated yield (Figure 6A). As in the sensitivity analysis, an in-crease inahad either a positive (ETMex1–2 and ETMex4)
or a negative (ETMex3) average impact on simulated
yield (Figure 6, A and C); b had a minor impact on simulated yield; and the average impact of c was sub-stantial only in the scenario with a vegetative water deficit during the vegetative phase (ETMex2). However,
in ETMex1 and -3, although the effects ofcwere small,
they were opposite to those found in the sensitivity analysis, as in these environments the effects of QTL for cwere mainly due to the pleiotropic effect of these QTL ona. Hence, the average impacts ofaandcon simulated yield were either positively (ETMex1 and -3) or negatively
(ETMex2 and -4) linked, depending on the water regime
(Figure 6A, I–III).
Second population (RILs considering QTL for both leaf and silk elongation): When the pleiotropic QTL effects on both leaf and silk elongation were considered, yield variability was greatly increased due to substantial modifications in the simulated yield impacts of param-etersa,b, andc(Figure 6, B and D). For instance, the influence of a in well-watered and vegetative water deficits (ETMex1–2) was decreased, while the impact of
a was increased for the flowering stresses (ETMex3–4;
Figure 6A, Ivs.6B, I). In all environments, effects ofb
andcwere increased by the inclusion of ASI effects and lines with higherbor lowercyielded more (Figures 4, C and D, and 6B, II and III), as alleles for shortASIdrought (lowPGRbase,g) also conferred reduced sensitivity of leaf elongation to evaporative demand (highb) and/or soil water deficit (low c) (Table 1, Figure 2). Overall, the jointly dominating effects ofaandband ofaandcthat were simulated in the first population (illustrated by a diagonal red/green pattern in Figure 6C, X–XII–XIV– XVI, and highlighted by a blue arrow in Figure 6C, XII– XVI) shifted toward a dominating effect ofborcin the second population (horizontal and vertical red/green pattern, respectively, in Figure 6D, X–XII–XIV–XVI). Although the alleles of QTL that confer shortASIdrought all had either a positive effect onbor a negative effect on c,chad a greater impact on yield thanbin all the stressed environments (ETMex2–4), as lines with highercyielded
better regardless of theirbvalue (horizontal green/red pattern of the impact ofbandc; Figure 6D, VII–XI–XV). Overall, the changes in yield–fitness adaptation land-scapes illustrate how the genotype (set of alleles), the genetic architecture (pleiotropy of QTL for effects on LER parameters a,b, and c and for QTL affecting silk elongation), and the environment all combine to influence the simulated yield. The best-yielding RIL (indicated by a star in the graphs in Figure 6, C and D) thus varied depending on both the genetic architecture and the environment.
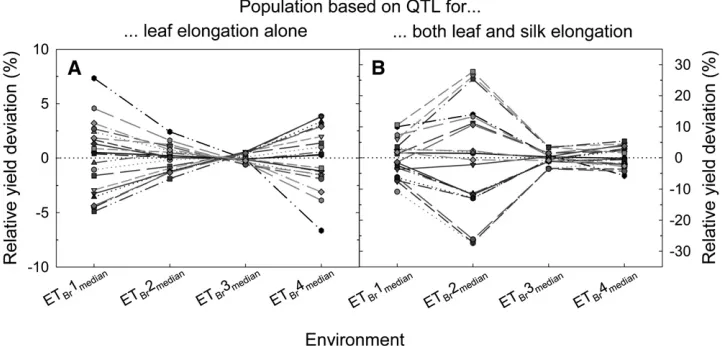
High genotype–environment interactions were gen-erated in the two populations in rain-fed maize-growing environments: A second set of simulations was per-formed over 45 years for a rain-fed cropping region in Brazil, and QTL effects were evaluated for scenarios representing the typical drought patterns found in that cropping system. The clustering of environments into four types (Figure 7) indicated that plants experienced a mild terminal stress with some vegetative stress (ETBr1,
37% of the situations), a stress commencing at the end of the vegetative period with some relief during grain filling (ETBr2, 24% of the situations), a mild terminal
stress during the grain set and filling periods (ETBr3,
situations). To mimic ‘‘ideal’’ QTL experiments that aim to sample a representative range of the environments characteristic of the targeted region,G3Einteractions and QTL impact were evaluated for the four sampled situations that were closest to the median of each environment type (Figure 8, Table 3).
Large G 3 E interactions for yield were generated across the four sampled environments (ETBr1–4median,
Figure 8), while flowering date occurred67 days after sowing and average yield varied from 2 to 8 tons ha1
(Table 3). Significant variation in yield occurred among genotypes in ETBr1–2 and ETBr4median, while yields were
similar among genotypes in ETBr3median. The ranking of
genotypes also varied greatly across environments, and this occurred for both populations (i.e., with QTL affecting leaf elongation alone or affecting both leaf and silk elongation). The crossover interaction for the first population (QTL for leaf elongation alone) oc-curred mainly in ETBr1median and ETBr4median, with a
magnitude of the variation around 10% in these envi-ronments. For the second population (QTL affecting both leaf and silk elongation), the genotypic variation in simulated yield was greater in the four sampled environments, with the highest variability simulated for ETBr1–2median.
Most QTL significantly affected the simulated yield in rain-fed maize-growing environments: Significant impacts on simulated yield were detected for the QTL in both populations in the four Brazilian median envi-ronments, using a mixed-model analysis (Table 3). In the first population (with leaf elongation effects alone), all QTL except qc3 had a significant impact on yield in at least one environment. Five of the 11 QTL (qb1, qa2, qa4qb5qc5, qa5qb6qc6, and qa6qc7) had a signif-icant yield impact for all four situations, with a mean additive effect ranging from 12 to 29 kg ha1. The
highest additive effects on yield (up to 125 kg ha1for
qa6qc7) were simulated in the ETBr1median
environ-ment, where plants were well watered and experienced only a late mild stress. In the sampled environments (ETBr1–4median), the additive effect of the leaf
elonga-tion QTL on yield was driven mainly by QTL for potential leaf elongation (parameter a), as they had greater mean QTL effects and explained the major part of the variance. However, the best-yielding lines in this ETBr1median environment performed poorly in
ETBr4median (Figure 8). The allelic effects of all QTL
in ETBr1–2median environments were reversed in the
ETBr3–4median environments (i.e., positive effects in
ETBr1–2medianwere negative in ETBr3–4medianand vice
versa; Table 3).
When the silk elongation effect was included in the simulations (second population), all the QTL for ASI (qa4qb5qc5, qa5qb6qc6, qb4qc4, and qc1) had a major impact on the simulated yield in all situations, varying from 184 to 252 kg ha1on average (Table 3). The effect
of the other QTL was then no longer significant in many cases (P,0.05). Furthermore, the inclusion of the QTL effects on silk elongation had a substantial impact on the proportion of yield variance explained by given QTL. For instance, two QTL fora(qa2 and qa6qc7) that each explained.20% of the yield variance in the four environments (ETBr1–4median) when only the leaf
effects were considered, each explained only 2% of the yield variance when the silk effects were included. In contrast, the relative yield variance explained by two QTL associated withASIdrought(qc1 and qb4c4) went from ,4% each when only the leaf effects were considered to30% each when the effects on silk elon-gation of these QTL were included. The results for both effect size and variance explained by the QTL empha-size that, for this QTL–trait network and these environ-ments, the relative importance of QTL for potential leaf elongation (parametera) is inferior to that of QTL for ASI (or PGRbase,g), when both leaf and silk effects are considered.
DISCUSSION
A gene-to-phenotype model to simulate crop-level impacts of organ-level environmentally stable genetic controls: Despite the increasing knowledge on poten-tially favorable genes and QTL alleles for traits like drought tolerance, their utility for breeding is difficult to demonstrate and hence selection for improved yield is still largely driven by crop-level observations of trait performance across diverse environmental conditions (Cooperet al. 2009). Recently, QTL-based models (also referred as gene-to-phenotype models) have been pro-posed to begin to integrate the QTL information obtained from trait-mapping studies to predict trait values at the crop level. Several models have successfully
Figure6.—Genotype–environment interactions on simulated yield for the RIL population when considering the QTL effect either on leaf elongation alone (A and C) or on both leaf and silk elongation (B and D) under contrasting soil water status and for high evaporative demand conditions (ETMex1–4VPD1; Figure 3). Average yield deviation (%) relative to the mean yield of the two
parents is presented for the lines in each population, depending on their value for the leaf elongation parametersa,b, andc(A and B) and depending on the combination of their values for these parameters (C and D). In C and D, a box plot presents the distribution of simulated yield in the panels I–V–IX–XIII for each situation; in the other panels, colors relate to the average yield impact of the parameters combination (red, negative effect; green, positive effect); the star (q) indicates the highest-yielding RIL
simulated the impact of QTL for flowering time on plant phenology and yield (e.g., Yin et al. 2005a,b; Messina et al. 2006). However, models focusing on complex traits such as growth processes resulted in large discrepancies between observed and predicted values (e.g., Yinet al. 2000), thus highlighting the importance of working with environmentally stable processes and QTL (e.g., Yin et al. 2003). Integrating effects of QTL affecting parameters related to key traits of sorghum adaptation was also proposed by Chapmanet al.(2003), but their study was based on hypothetical QTL and did not incorporate knowledge about the relative size or interactions between the QTL. The present study illus-trates a gene-to-phenotype modeling approach applied to simulate crop-level impacts of empirical environmen-tally stable QTL associated with leaf elongation rate. The approach was further extended to test the potential impact on yield of colocalizations observed between some of these QTL and QTL for ASI.
Although the present model has not been directly evaluated with field experiments, all the components of the model concerning the QTL for leaf elongation have been tested against independent data sets: the QTL effects on leaf elongation parameters (a,b, andc) were evaluated by predicting the response of new lines under drought conditions (Reymond et al. 2003), and the impact of leaf elongation parameters was tested for one genotype at the crop level under a range of contrasting drought scenarios (Chenu et al.2008a). A direct em-pirical evaluation could potentially be performed with near-isogenic lines constructed for specific allelic com-binations (e.g., lowest- and highest-allelic combinations for LAI/yield in specific drought types). However, this would require an extensive number of trials to be sure that the model is robust against small variations in ‘‘undetected QTL’’ and for the variation in any traits that are not currently accounted for in the model. The simulations concerning QTL affecting ASI were also based on processes reflecting our current knowledge of the physiological processes involved. However, further empirical experiments would be required to improve this part of the model, despite its robustness in agron-omic research (see below). Progress could be enhanced if robust modeling approaches with parameters associ-ated stably with genomic regions could be identified, as for the leaf elongation component.
Biophysical models to simulate yield–fitness adapta-tion landscapes and explore genotype–environment interactions for yield: By synthesizing our current knowledge on the physiological processes and their genetic controls, the model presented here allowed the generation of yield–fitness adaptation landscapes to explore G 3 E interactions at the crop level. Ideally, gene-to-phenotype modeling approaches should ac-count for all the complex interplay among genes, physiological traits, and the environmental conditions. Fitness adaptation landscapes have been introduced to
explore selection trajectories, given a certain number of genes (N) and a number of epistatic networks (K) among genes (NK models; Kauffman 1993). This approach has been extended for plant breeding appli-cations by introducing the environmental factor (E) to develop E(NK) models (Podlich and Cooper 1998; Cooper et al. 2005). While such genetic models are suitable to consider interactions among genes and environment for single traits, they define traits as being statistically influenced only by genes/QTL. They thus ignore the biophysical constraints that link physiologi-cal traits and greatly influence G3 E interactions for integrated traits like yield.
In this study, the genetic information that was input in the model for each parameter trait (a,b,c, andASIdrought) corresponded to relatively simple genetic E(NK) mod-els. Each of theseE(NK) models was defined by several QTL (N ranging from 4 to 8 depending on the considered trait; Table 1, Figure 2), no epistasis (K¼
0), and only one environment (E ¼1), as the additive effects for each trait did not change across environ-ments (environmentally stable traits). In contrast, the yield–fitness adaptation landscape that resulted from the simulations corresponded to a more complexE(NK) model. This latter model involved 11 QTL (considering all traits) for yield (N¼11; Table 1) and a large number
Figure8.—Simulated yield for a rain-fed crop in Brazil for hypo-thetical populations of recombi-nant inbred lines (RILs) when considering the effects of QTL on either leaf elongation alone (A) or both leaf and silk elonga-tion (B). The yield deviaelonga-tion (%) of each RIL in the popula-tion is presented relative to the average yield of the parents, for the situation that was closest to the median in each environment type (ETBr1–4median). For clarity only 20 RILs that were randomly chosen are presented.
TABLE 3
QTL impact on simulated yield and average simulated yield for the two hypothetical RIL populations based on QTL affecting either leaf expansion alone or both leaf and silk expansion
QTL
ETBr1median (kg ha1)
ETBr2median (kg ha1)
ETBr3median (kg ha1)
ETBr4median (kg ha1)
Mean QTL effect
(kg ha1) Pr
Variance explained
(%)
qb1 51/67a 18/49 6/2 13/12 12/25 ***/NS 4.4/0.4
qa1qb2 69/87 14/46 2/3 15/12 16/31 ***/NS 7.3/0.6
qa2 111/133 29/70 8/1 26/22 26/45 ***/* 19.7/1.6
qc1b 40/277 16/538 2/61 9/73 11/237 **/*** 2.6/27.5
qa3qb3qc2 47/63 5/31 1/4 10/10 10/27 */NS 3.3/0.3
qc3 25/26 10/15 1/1 6/6.5 7/8 NS/NS 1.0/0.0
qb4qc4b 45/296 20/578 5/61 12/73 12/252 ***/*** 3.6/31.6
qa4qb5qc5b 101/137 17/516 4.5/68 22/111 23/208 ***/*** 15.7/21.8
qa5qb6qc6b 80/127 14/446 4/60 18/102 18/184 ***/*** 9.8/16.6
qa6qc7 125/142 28/53 9/4 29/22 29/43 ***/* 24.9/1.7
qb7qc8 49/54 20/26 5/3 12/12 13/176 ***/NS 4.1/0.2
Simulated yield
8118/8355 5985/6786 5578/5634 2238/2258
The analysis was carried out for the situation closest to the median in each environment type found in the Brazilian simulations (ETBr1–4median, Figure 7). The additive effect in each environment, the average effect over the four environments, the degree of significance, and the genotypic variance explained are presented for each QTL. Values in boldface type correspond to QTL effects that were significant (Wald test,P,0.05) in the considered environment. Additive effects are presented for parent 1. *P,0.05; **P,0.01; ***P,0.001; NS, nonsignificant.
a
Result for the population based on QTL for leaf elongation only/on QTL for both leaf and silk elongation.
b
of environments (E), as yield varied across environmen-tal conditions due to the influence of both fluctuating weather conditions through the crop cycle and crop/ genotype interactions with the environment (e.g., feed-back of leaf growth on water balance). The biophysical model therefore provided the missing ‘‘trait part’’ of the E(NK) genetic models and allowed tractableNKmodels to be defined for key component traits.
In the near future, a combination of statistic and simulation models may be able to (i) dissect yield into key component traits that are environmentally stable, (ii) identify QTL for these traits in mapping popula-tions, and (iii) predict yield of various genotypes on the basis of their allelic combination for these QTL with NK models linked to biophysical models (Van Eeuwijk et al. 2005; Cooper et al. 2009). Currently, the construction of simulated data as presented in this study could be used in the development of new statistical analysis methods for QTL detection, given that a multitude of crop traits (400 state variables in the APSIM biophysical model;e.g., leaf area, biomass components) can be ‘‘known’’ for every day of the crop cycle in various environments (Cooper et al. 2006; Chapman2008).
Genetic controls of both leaf and silk elongation significantly affected simulated yield under drought conditions:While several studies have revealed a large genetic variability in the drought responses of leaf elongation rate (Reymond et al.2003, 2004; Welcker et al.2007), the effect of such variability on yield has not yet been assessed, partly because of the cost, impracti-cality, and limitation relative to empirical assessments. The simulations performed here across a set of environ-ments representing different drought patterns revealed that all of the QTL for leaf elongation had a significant
impact on yield except qc3 (Table 3). Large G 3 E interactions were generated, especially when compar-ing well-watered or vegetative stress conditions with terminal water-deficit conditions (Figures 6 and 8, Table 3). Alleles conferring greater leaf elongation rate gen-erally resulted in better simulated yield under well-watered and early water deficit conditions. In contrast, such alleles had a negative impact on simulated yield in situations with drought around flowering and during grain filling, where plants with greater leaf area were disadvantaged. Hence, the variability in leaf area re-sulting from different allelic combinations led to modi-fication in the timing and intensity of plant water extraction, making it a critical component of yield performance under drought.
When pleiotropic QTL effects on silk elongation and ASI were included (second population, Figure 2), QTL impacts on simulated yield were substantially modified and enhanced (Figures 6 and 8; Table 3), as the grain number was then directly affected by the impact of ASI andPGRbase,g (the threshold plant growth rate for establishment of grain number; Equation 1). Introduc-ing this silk elongation effect increased by 20 times the total genotypic variance for yield that was generated for the four Brazilian sampled environments, with a max-imum impact in mild-terminal and flowering stresses (ETBr1–2median; data not shown). While several
assump-tions were made about the QTL effect on silk elonga-tion in this study, the ranges of values for the model parameters were related to observed data (see materi-als and methods) and the results were consistent with
field observations. As observed in many field studies (e.g., Bolan˜ os and Edmeades 1996), the simulations showed that plants with a short ASI (lowPGRbase,g) per-formed better under a water deficit. Furthermore, the
importance of the direct impact of drought around flowering, as simulated here, was consistent both with frequent reports on colocalization of QTL affecting ASI and yield (Ribautet al.1996, 1997; Vargaset al.2006) and with the exploitation of this correlation in yield selection programs (Campos et al. 2004). Despite the importance of ASI under drought, the physiological processes involved are not yet fully explained. ASI is known as a reporter trait for rapid ear growth during the flowering period (Edmeadeset al.1993; Bolan˜ osand Edmeades1996). Recently the biophysical basis of ASI was demonstrated to be driven by the dynamics of ear growth and plant growth rate (Borra´ set al.2009), thus reinforcing the hypothesis made in this study. ASI is also known to be associated with modification of starch and sucrose dynamics that affect ovary abortion (for review, see Boyer and Westgate2004). While studies at the biochemical and cellular levels may identify an ultimate cause of ASI, physiological studies have shown that the phenotype observed under water deficit (delay in silk emergence) is clearly associated with changes in silk developmental processes (Fuad-Hassanet al.2008). In future models, the quantitative response of silk elonga-tion to environment could be integrated into the crop model in a more mechanistic fashion, similar to that for leaf elongation response (Chenuet al.2008a).
Toward gene-to-phenotype models to assist plant breeding: Modeling approaches can assist plant breed-ers to better undbreed-erstand theG3Einteractions that are associated with drought tolerance and that reduce yield heritability (Ceccarelli1996; Cooper1996; Bolan˜ os and Edmeades 1996; Edmeadeset al. 1999). Hammer et al.(2005) demonstrated, with simulations based on hypothetical genes, that gene-to-phenotype modeling could aid in optimization of marker-assisted selection (MAS), by accounting for the confounding effects associated with environment and gene context depen-dencies. In the present study, the simulated impact of QTL on yield varied from negative to positive depend-ing on the environment (Table 3). The quantitative inte-gration of physiological and genetic processes revealed, for example, that the two major QTL affecting the potential leaf elongation (parametera of the model), despite their similar impact on this trait, had contrasting effects on simulated yield (Figure 9). Furthermore, the yield effects of these two QTL greatly differed with the drought conditions (Figure 9). Sufficiently robust gene-to-phenotype models could thus be used to aid deci-sions on which traits and QTL should be targeted for broad or specific adaptation and to explore alternative selection methods (Chapman et al. 2003; Podlich et al. 1999, 2004; Hammer et al.2005). To the extent that leaf and silk elongation have the same genetic basis for drought response, indirect selection on leaf elonga-tion response could be done to select for reduced ASI under drought. This would be advantageous as selec-tion could be undertaken (i) during vegetative stages
(allowing crosses within the same season and therefore shorter cycles of selection), (ii) in either controlled environments or field trials, and (iii) for vegetative-stage stresses that are easier to manage than the stresses around flowering that are currently required for selec-tion on ASI.
To move from theoretical estimation to practical result is far from straightforward. A major concern of plant breeders is that many putative drought tolerance QTL identified are likely to have limited utility in ap-plied breeding because of their dependency on genetic background or their sensitivity to the environment (Chapman et al. 2003; Campos et al. 2004; Hammer et al. 2004; Podlich et al. 2004; Yadav et al. 2004). Precautions were taken in this study to work with QTL that were stable across environments and that were, at least for some of them, confirmed in several genetic backgrounds (Reymond et al.2003; Sadoket al. 2007; Welckeret al. 2007). However, the present model re-mains a greatly simplified representation of crop growth dynamics. Besides accounting for only few QTL, no epistatic effects were considered and only a small number of pleiotropic effects were included between QTL for leaf and silk elongation (Figure 2). Cooper et al.(2005) estimated in a simulation study the degree to which context-dependent gene effects (undetected QTL, epistasis, G 3 E interactions, and pleiotropy) would reduce the effectiveness of known QTL to im-prove genetic gain. To better represent real-world conditions, such confounding gene/QTL effects would need to be considered together with our biophysical model in anE(NK) genetic model.
Conclusion:The gene-to-phenotype model presented here illustrates how a new generation of crop models can integrate information on organ-level QTL effects, simulate their impact at the whole-plant level, and assist in weighting their importance in terms of yield in vari-ous environments. Within the APSIM crop model, the leaf submodel used here was based on physiological processes stable across environments that were charac-terized by environmentally stable QTL, thus enabling avoidance of QTL–environment interactions commonly observed for more complex traits such as leaf area or biomass accumulation (Yinet al.1999; Reymondet al. 2004). The addition of the ASI submodel was proposed to test in silico how colocalizations between some leaf elongation QTL and some QTL affecting directly the reproductive processes could affect yield.
The simulation obtained illustrated how genetic archi-tecture, by constraining QTL and trait combinations and by influencing their impact at the crop level, plays a key role in the generation of economic phenotype. Work has to be done now to combine such simulation models with more complex genetic models and to evaluate their predictive capacity against empirical data.
impor-tance of modeling approaches that synthesize the cur-rent biological knowledge to explore the highly complex gene-to-phenotype system.
We thank P. Bertin for data on the hybrid Dea, J. M. Ribaut for data on the mapping population (P1 by P2) and climatic data for Tlaltizapa´n, and A. Heinemann for climatic data for Sete Lagoas. We also thank A. Doherty and N. Hansen for technical support. This project was partly funded by the Generation Challenge Program.
LITERATURE CITED
Andrade, F. H., C. Vega, S. Uhart, A. Cirilo, M. Cantareroet al.,
1999 Kernel number determination inmaize. Crop Sci.39:453–459. Ben-Haj-Salah, H., and F. Tardieu, 1996 Quantitative analysis of
the combined effects of temperature, evaporative demand and light on leaf elongation rate in well-watered field and labora-tory-grown maize plants. J. Exp. Bot.47:1689–1698.
Ben-Haj-Salah, H., and F. Tardieu, 1997 Control of leaf expansion
rate of droughted maize plants under fluctuating evaporative de-mand. A superposition of hydraulic and chemical messages? Plant Physiol.114:893–900.
Boer, M. P., D. Wright, L. Feng, D. W. Podlich, L. Luoet al.,
2007 A mixed-model quantitative trait loci (QTL) analysis for multiple-environment trial data using environmental covariables for QTL-by-environment interactions, with an example in maize. Genetics177:1801–1813.
Bolan˜ os, J., and G. O. Edmeades, 1993 Eight cycles of selection for
drought tolerance in lowland tropical maize. II. Responses in re-productive behavior. Field Crops Res.31:253–268.
Bolan˜ os, J., and G. O. Edmeades, 1996 The importance of the
an-thesis silking interval in breeding for drought tolerance in trop-ical maize. Field Crops Res.48:65–80.
Borra´ s, L., M. E. Westgate, J. P. Astini and L. Echarte,
2007 Coupling time to silking with plant growth rate in maize. Field Crops Res.102:73–85.
Borra´ s, L., J. P. Astini, M. E. Westgate and A. D. Severini,
2009 Modeling anthesis to silking in maize using a plant bio-mass framework. Crop Sci.49:937–948.
Boyer, J. S., and M. E. Westgate, 2004 Grain yields with limited
water. J. Exp. Bot.55:2385–2394.
Campos, H., M. Cooper, J. E. Habben, G. O. Edmeadesand J. R.
Schussler, 2004 Improving drought tolerance in maize: a view
from industry. Field Crops Res.90:19–34.
Ceccarelli, S., 1996 Positive interpretation of genotype by
environ-ment interactions in relation to sustainability and biodiversity, pp. 467–486 in Plant Adaptation and Crop Improvement, edited by M. Cooperand G. L. Hammer. CAB International, Wallingford, UK.
Chapman, S., M. Cooper, D. Podlich and G. Hammer,
2003 Evaluating plant breeding strategies by simulating gene action and dryland environment effects. Agron. J.95:99–113. Chapman, S. C., 2008 Use of crop models to understand genotype
by environment interactions for drought in real-world and simu-lated plant breeding trials. Euphytica161:195–208.
Chapman, S. C., and G. O. Edmeades, 1999 Selection improves
drought tolerance in tropical maize populations: II. Direct and correlated responses among secondary traits. Crop Sci. 39: 1315–1324.
Chapman, S. C., J. Crossaand G. O. Edmeades, 1997a Genotype by
environment effects and selection for drought tolerance in tropi-cal maize. I. Two mode pattern analysis of yield. Euphytica95:1–9. Chapman, S. C., J. Crossa, K. E. Basfordand P. M. Kroonenberg,
1997b Genotype by environment effects and selection for drought tolerance in tropical maize. II. Three-mode pattern anal-ysis. Euphytica95:11–20.
Chapman, S. C., M. Cooper, G. L. Hammer and D. G. Butler,
2000 Genotype by environment interactions affecting grain sor-ghum. II. Frequencies of different seasonal patterns of drought stress are related to location effects on hybrid yields. Aust. J. Agric. Res.51:209–221.
Chelle, M., 2005 Phylloclimate or the climate perceived by
individ-ual plant organs: What is it? How to model it? What for? New Phy-tol.166:781–790.
Chenu, K., N. Franckand J. Lecoeur, 2007 Simulations of virtual
plants reveal a role forSERRATEin the response of leaf develop-ment to light inArabidopsis thaliana.New Phytol.175:472–481. Chenu, K., S. C. Chapman, G. L. Hammer, G. Mclean, H. BenHaj
Salahet al., 2008a Short-term responses of leaf growth rate to
water deficit scale up to whole-plant and crop levels: an inte-grated modeling approach in maize. Plant Cell Environ. 31: 378–391.
Chenu, K., H. Rey, J. Dauzat, G. Lydie and J. Lecoeur,
2008b Estimation of light interception in research environ-ments: a joint approach using directional light sensors and 3D virtual plants applied to sunflower (Helianthus annuus) and Ara-bidopsis thalianain natural and artificial conditions. Funct. Plant Biol.35:850–866.
Cooper, M., 1996 A strategy for yield improvement of wheat which
accommodates large genotype by environment interactions, pp. 487–511 inPlant Adaptation and Crop Improvement, edited by M. Cooperand G. L. Hammer. CAB International, Wallingford, UK.
Cooper, M., and G. L. Hammer, 1996 Plant Adaptation and Crop
Improvement.CAB International, International Rice Research In-stitute and the International Crops Research InIn-stitute for the Semi-Arid Tropics, Wallingford, UK.
Cooper, M., D. W. Podlich and O. S. Smith, 2005
Gene-to-phenotype models and complex trait genetics. Aust. J. Agric. Res.56:895–918.
Cooper, M., D. W. Podlich, C. M. Lo¨ ffler, F. VanEeuwijkand S. C.
Chapman, 2006 Genotype-by-environment interactions under
water-limited conditions, pp. 51–96 inDrought Adaptation in Cere-als, edited by J.-M. Ribaut. Food Products Press, New York.
Cooper, M., F. A. VanEeuwijk, G. L. Hammer, D. W. Podlich
and C. Messina, 2009 Modeling QTL for complex traits:
detec-tion and context for plant breeding. Curr. Opin. Plant Biol.12: 231–240.
Echarte, L., F. H. Andrade, C. R. C. Vega and M. Tollenaar,
2004 Kernel number determination in Argentinean maize hy-brids released between 1965 and 1993. Crop Sci.44:1654–1661. Edmeades, G. O., and T. B. Daynard, 1979 The development of
plant-to-plant variability in maize at different planting densities. Can. J. Plant Sci.59:561–575.
Edmeades, G. O., J. Bolan˜ os, M. Hernandez and S. Bello,
1993 Causes for silk delay in lowland tropical maize. Crop Sci.33:1029–1035.
Edmeades, G. O., J. Bolan˜ os, S. C. Chapman, H. R. Lafitteand
M. Banziger, 1999 Selection improves drought tolerance in
trop-ical maize populations: I. Gains in biomass, grain yield, and harvest index. Crop Sci.39:1306–1315.
Fuad-Hassan, A., F. Tardieuand O. Turc, 2008 Drought-induced
changes in anthesis-silking interval are related to silk expansion: a spatio-temporal growth analysis in maize plants subjected to soil water deficit. Plant Cell Environ.31:1349–1360.
Gilmour, A. R., B. R. Cullisand A. P. Verbyla, 1997 Accounting
for natural and extraneous variation in the analysis of field ex-periments. J. Agric. Biol. Environ. Stat.2:269–293.
Granier, C., L. Aguirrezabal, K. Chenu, S. J. Cookson, M. Dauzat
et al., 2006 PHENOPSIS, an automated platform for repro-ducible phenotyping of plant responses to soil water deficit inArabidopsis thalianapermitted the identification of an acces-sion with low sensitivity to soil water deficit. New Phytol.169: 623–635.
Hammer, G., S. Chapman, E. van Oosterom and D. Podlich,
2005 Trait physiology and crop modeling as a framework to link phenotypic complexity to underlying genetic systems. Aust. J. Agric. Res.56:947–960.
Hammer, G., M. Cooper, F. Tardieu, S. Welch, B. Walshet al.,
2006 Models for navigating biological complexity in breeding improved crop plants. Trends Plant Sci.11:587–593.
Hammer, G. L., M. J Kropff, T. R. Sinclair and J. R. Porter,
2002 Future contributions of crop modeling—from heuristics and supporting decision-making to understanding genetic regulation and aiding crop improvement. Eur. J. Agron.18: 15–31.
Hammer, G. L., T. R. Sinclair, S. C. Chapmanand E.vanOosterom,