DOI: 10.1534/genetics.105.051474
Segregating Variation in the Transcriptome:
Cis
Regulation and
Additivity of Effects
Kimberly A. Hughes,*
,†,1Julien F. Ayroles,
‡,2Melissa M. Reedy,* Jenny M. Drnevich,*
,3Kevin C. Rowe,*
,4Elizabeth A. Ruedi,
§Carla E. Ca´ceres* and Ken N. Paige*
*School of Integrative Biology,†Institute for Genome Biology,‡Department of Natural Resources and Environmental Sciences and§Program in Ecology and Evolutionary Biology, University of Illinois, Urbana, Illinois 61801
Manuscript received September 23, 2005 Accepted for publication April 12, 2006
ABSTRACT
Properties of genes underlying variation in complex traits are largely unknown, especially for variation that segregates within populations. Here, we evaluate allelic effects,cisand transregulation, and domi-nance patterns of transcripts that are genetically variable in a natural population ofDrosophila melanogaster. Our results indicate that genetic variation due to the third chromosome causes mainly additive and nearly additive effects on gene expression, thatcisandtranseffects on gene expression are numerically about equal, and thatcis effects account for more genetic variation than do transeffects. We also evaluated patterns of variation in different functional categories and determined that genes involved in metabolic processes are overrepresented among variable transcripts, but those involved in development, tran-scription regulation, and signal transduction are underrepresented. However, transcripts for proteins known to be involved in protein–protein interactions are proportionally represented among variable transcripts.
W
ITHIN-population genetic variability is a major source of phenotypic differences among indi-viduals and is the raw material for evolution, yet very little is known about the characteristics of genes under-lying this variation. Further, it is not clear what evolu-tionary processes maintain within-population variation in the face of natural selection and genetic drift (Bartonand Turelli1989; Lynchet al.1998; Charlesworth
and Hughes 2000; Turelli and Barton 2004), and
models to explain the maintenance of variation depend on parameters that have been difficult to estimate (Charlesworthand Hughes 2000).
Addressing these questions depends on measuring the effects and interactions of genes that segregate within natural populations (Mackay 2001). However,
reliable and unbiased data have been difficult to obtain because it is not usually possible to measure phenotypic effects of segregating alleles, except in rare cases of Mendelian segregation of discrete phenotypes. Quanti-tative trait loci (QTL) mapping studies can estimate allelic effects; however, most QTL have not been
re-solved to the level of individual loci, and most studies have investigated between- rather than within-population variation (Glazieret al.2002).
Oligonucleotide microarrays provide a novel tool for investigating within-population variation because they allow the simultaneous sampling of large numbers of phenotypes (mRNA abundance of thousands of differ-ent transcripts). A high proportion of these phenotypes exhibit significant within-population variation, even when only moderate numbers of individuals are sampled (Oleksiak et al. 2002; Townsendet al. 2003; Wayne
et al.2004). We therefore combined this technology with quantitative genetic experiments to measure patterns of genetic and phenotypic variation,cisand trans regula-tion, and dominance for.18,000 genes in adult male Drosophila melanogaster. We found thatcis-regulatory ef-fects predominate for transcripts with high levels of genetic variation and that variable transcripts tend to be involved in metabolic processes, but not in develop-mental or regulatory processes. We also found that most transcripts exhibited within-locus additivity or near ad-ditivity with respect to mRNA abundance, and few dis-played dominance or overdominance.
MATERIALS AND METHODS
Experimental flies: We obtained third-chromosome sub-stitution lines ofD. melanogaster from J. Leips (University of Maryland, Baltimore County) for this experiment. Within each substitution line, flies were identically homozygous for all
1Corresponding author: School of Integrative Biology, University of Illinois, 515 Morrill Hall, 505 S. Goodwin Ave., Urbana, IL 61801. E-mail: [email protected]
2Present address:Department of Genetics, North Carolina State Univer-sity, Raleigh, NC 27695.
3Present address:Roy J. Carver Biotechnology Center, Keck Center for Functional Genomics, University of Illinois, Urbana, IL 61801.
4Present address:Department of Biological Science, Florida State Uni-versity, Tallahassee, FL 32206.
genes on the third chromosome (C3), and each line contained a different wild-type C3 derived from a single natural pop-ulation in Raleigh, North Carolina (DeLucaet al.2003). All other chromosomes were identical across lines and were derived from the highly inbred SAM stock (Lyman et al. 1996). Thus, these isogenic lines differed only with respect to allelic variation of genes on C3. We checked homozygosity of the isogenic lines by typing each line for a set of seven variable microsatellite loci (four on C3 and three on C2). All were homozygous within each line.
We measured transcript abundance in equal-aged adult males from six different isogenic lines. We also intercrossed three of these lines (lines 33, 83, and 483) in all possible combinations to produce F1flies that were hybrids for alleles
on C3. Because all lines contained identical sex chromosomes, reciprocal crosses (e.g., 33 females383 males and 83 females3 33 males) produced flies that were identical for the nuclear genome. To eliminate differences between parental and F1
lines due to maternal effects, we pooled offspring from recip-rocal crosses and mixed them in equal numbers before ex-tracting RNA. These pooled F1flies were designated as lines
33383, 333483, and 833483.
For each isogenic and F1 line, we reared offspring from
replicate vials produced from two independent sets of parents (block A and block B) to produce true biological replicates. We housed block A flies in one incubator and block B flies in another; both blocks were reared and collected at the same time. Parents of experimental flies were reared from constant-density vials (7 males and females per vial), and males used for expression analysis were reared at a constant larval density of 25 per vial. Over a 2-day period (days 0 and 1), we collected males within 8 hr of eclosion and kept them in single-sex vials at low density (10 males per vial) until day 4 when all males were 3–4 days posteclosion. Because we wanted to assay males with appropriate experience for their age, we housed males with females from a laboratory strain (e/eon Ives outbred back-ground) beginning at day 4 and continuing until they were preserved for mRNA extraction on day 8. These mating vials were established at a density of 3 males and 3 females per vial, and four independent vials were maintained per genotype per block.
On day 8, we chose males from each genotype and block for extraction of mRNA, for a total of 18 extractions. For each extraction, we pooled six males chosen from the four mating vials in the appropriate block. Two males were chosen from each of two mating vials and one male from each of the two other vials. Males were flash frozen in random order between 13:00 and 15:00 hr CST. We extracted RNA from all block A flies on the same day and from all block B flies on the next day. Standard Trizol protocols were used for extraction and labeling with the MessageAmp aRNA kit. We hybridized labeled mRNA to Affymetrix Drosophila 2.0 GeneChips ac-cording to manufacturer’s protocols and scanned them with an Affymetrix GeneArray Scanner at the University of Illinois Affymetrix Core Facility.
Transcript abundance and genetic variation:Affymetrix Dro-sophila 2.0 GeneChip contains probes for 18,769 transcripts with 14 probes per transcript. Probe-level intensity values were obtained for each array from MAS 5.0, and all probe intensity values were standardized to the mean value for the array. We determined that 14,298 transcripts were detectable in experi-mental flies by comparing signals from perfect-match (PM) probes to those from mismatch probes across all arrays using a Wilcoxon sign-rank test (nranged from 162 to 213). This is probably a liberal test for transcript presence, but we deemed this appropriate because it includes more genes in the entire analysis than a more conservative test, so the false discovery rate (FDR, the expected proportion of significant results that are
false positives; Benjaminiand Hochberg1995) calculations for the remainder of the tests we applied are conservative. We used a cutoff of P , 0.04 for determining that a transcript was present, for an FDR of 0.05.
For subsequent analyses, we used only the mean-standardized PM intensity values from the 14,298 detectable transcripts (Chu et al. 2002). The consistency of probe-level measures from independent replicates of the same genotype was high (Pearson’sr¼0.94), indicating high repeatability of expres-sion measurements. We tested for significant variation in mRNA abundance among the C3 substitution lines, using gene-specific mixed linear models of the form Log2(PM)¼ m1L1P1L3P1B(L)1e, whereLwas the line effect, Pthe probe effect, andB(L) the effect of block nested within line.LandPwere fixed effects andB(L) was random to pro-vide the error term forL. These models were implemented in SAS PROC MIXED V. 9.1 (SAS Institute2002). Probe-level values were deleted as outliers if they had external Student-ized residuals.3. After outlier removal, 13,423 of the tested transcripts (94%) had residuals that were normally distributed (Shapiro–WilkP.0.05). For genes with significant among-line variation, we calculated genetic variance in transcript abundance (VG) as the among-line variance component from
a model that included the fixed effect of probe and random ef-fects of line and block within line. To compare genetic varia-tion among transcripts with different abundance levels, we calculated coefficients of genetic variation (CVG) as 100
ffiffiffiffiffiffi
VG
p
=x, wherex was the mean abundance of the transcript.
Cis and trans regulatory effects: Because the only allelic differences between C3 substitution lines were attributable to genes on C3, all genetic variation in transcript abundance was due to sequence variation on C3. Variable expression of genes on other chromosomes must have been due totrans-acting effects of alleles on C3. This does not imply that the variable genes on other chromosomes have nocis-regulatory mecha-nisms, only that cis effects would not have contributed to genetic variation in our experiment. Variation in abundance of C3 transcripts could be caused either bycis- or by trans-acting sequence differences, but the proportion subject to transregulation can be estimated from the number of variable transcripts on the other chromosomes. We therefore obtained chromosomal locations of genes producing each transcript with significant genetic variation, to determine the contribu-tions ofcis- and trans-regulatory effects. Chromosomal loca-tions were obtained from the Affymetrix database on February 3, 2005 (Liuet al.2003).
We used logistic regression to determine if the probability of a transcript occurring on C3 was significantly related to the magnitude of genetic variation as measured by CVG. However,
the logistic regression assumes that all transcripts are in-dependent, so the test might be too liberal. We therefore applied a conservative contingency-table test (Wayneet al. 2004), by dividing the 2329 variable transcripts into thirds (tertiles) on the basis of their CVGvalues and usingx2-tests to
determine if chromosomes were equally represented among tertiles (Table 1).
To determine the total number of cis- vs. trans-regulated transcripts, we also calculated the expected proportion of C3 genes that weretransregulated, assuming that the locations of trans-regulatory variants are randomly distributed relative to their target genes, which is consistent with data from yeast (Bremet al.2002; Yvertet al.2003). We based the estimate of
trans-regulated C3 genes on the proportion oftrans-regulated genes on the other major chromosomes inD. melanogaster(C2 and X).
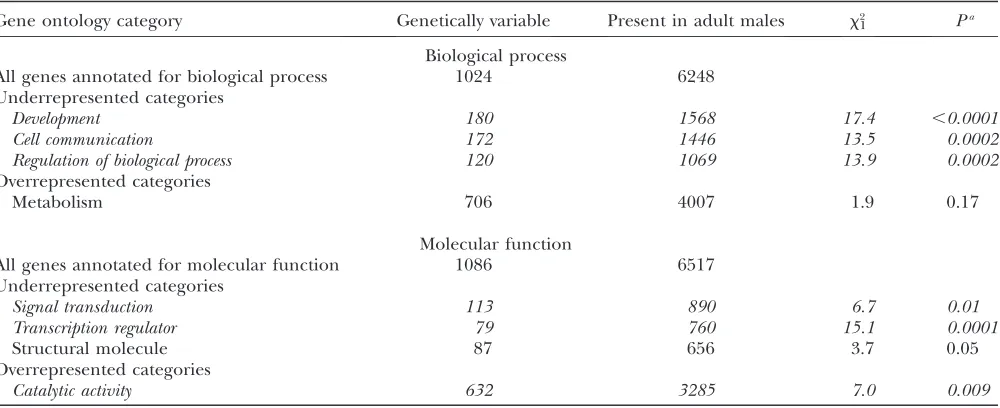
ontology (GO) mining tool (Liuet al.2003). The database contains biological process annotation for 6895 genes, of which 1024 were variable among genotypes in our experiment; it contains molecular function annotation for 7240 genes, of which 1086 were variable. We tested the following GO func-tional categories for over- or underrepresentation among genetically variable genes: ‘‘development,’’ ‘‘regulation,’’ ‘‘me-tabolism,’’ and ‘‘cell communication’’ for biological process and ‘‘catalytic (enzymatic) activity,’’ ‘‘signal transduction,’’ ‘‘regulation of transcription,’’ and ‘‘structural molecule’’ for molecular function (Rifkinet al.2003). We tested for dispro-portional representation of functional categories by compar-ing the frequency of each category among genetically variable transcripts to its expected frequency among all detectable transcripts. We used x2-tests for this analysis, because of the potential for nonindependence among transcripts in the same functional category. A category was judged to under- or overrepresented ifP,0.01. Less than 1 false positive is ex-pected under this criterion.
We also compared variable and nonvariable transcripts with respect to evidence for interactions among the protein products of the genes. Giotet al.(2003) reported .20,000 interactions between 7048 proteins encoded in theD. mela-nogastergenome. They were able to ascribe high, intermediate, or low confidence to these interactions, with high confidence assigned to 4780 interactions involving 4679 proteins. We compared genetically variable and nonvariable transcripts to the entire list of interacting proteins and, separately, to the high-confidence list and tested for nonrandom associations using a two-by-two contingency table analysis.
Dominance:To calculate dominance effects, we compared mRNA abundance in isogenic lines with that of the F1hybrid
offspring they produced. We first determined which tran-scripts were variable among the isogenic and F1lines that we
used in crosses: 33, 83, 483, 33383, 333483, and 833483, using the linear model described above. We found that 905 transcripts were significantly variable among these lines at P,0.013 (FDR of 0.2). For these 905 transcripts, we then determined if there was significant variation among lines that composed a cross (e.g., pairwise differences between lines 33, 83, and 33 3 83), using ESTIMATE statements in PROC MIXED and aP-value cutoff of 0.05. If there were pairwise differences, we calculated the dominance of transcript abun-dance as d/a, where ais half the difference in abundance between the isogenic parental lines andd is the difference between the F1 hybrid and the mean of the parental lines
(Falconer and Mackay 1996; Gibson et al.2004). If tran-script abundance in the hybrid is exactly intermediate to that in the parental lines,d¼0; thusd/a¼0 indicates within-locus additivity and |d/a| ¼ 1 indicates complete dominance. If |d/a|.1, overdominance (heterosis) of transcript abundance is indicated, meaning the hybrid falls outside the range of phenotypes spanned by the parents.
We determine if mRNA abundance in the two parental lines was significantly different using ESTIMATE statements in PROC MIXED, equivalent to testing 2a . 0. We also de-termined if the hybrid was significantly different from the mean of its parental lines, equivalent to testing |d|.0 and indicating significant deviation from within-locus additivity. Type IIIF-tests for both effects had 2 numerator d.f. and 3 denominator d.f. This is an appropriate test for dominance if the dependent variable is linearly related to transcript abun-dance. Benchmark trials have shown that log2(PM) is linearly
related to log2(abundance) (Cope et al. 2004) with slope estimates between 0.67 and 0.87. For the range of values we observed (4.8,log2(PM),11.6), log2(PM) and abundance
are nearly linearly related. We also calculated dominance by assuming a linear relationship between PM and abundance;
the results were nearly identical. We therefore report only results obtained on the log scale because of better distribu-tional properties of all variables on this scale.
To determine if transcripts displayed significant overdom-inance, we calculated 80 and 95% confidence intervals fora and dusing ESTIMATE statements within PROC MIXED. If upper and lower limits fordandadid not overlap, we con-cluded that there was statistical support for overdominance.
RESULTS
Cisandtransregulatory effects:Of the 14,298
detect-able transcripts, 2329 (16.3%) showed significant vari-ation among isogenic lines at P , 0.01 (FDR ¼0.06, supplemental Table 1 at http://www.genetics.org/ supplemental/). The CVGvalues for these genes ranged
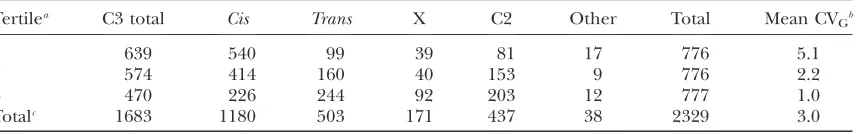
from 19.0 to 0.3. Genes located on C3 were substantially overrepresented among genetically variable transcripts: C3 accounted for 44% (6338) of all detectable tran-scripts and for 72% (1683) of the genetically variable transcripts (x12 ¼626, P , 105). This pattern is
con-sistent with substantialcisregulation of genetically var-iable transcripts.
C3 was also overrepresented among the transcripts exhibiting the most variation when the analysis is limited to the 2329 transcripts with significant genetic variation (Figure 1). The probability of a transcript occurring on C3 was positively related to CVG
(likeli-hood ratiox12¼61.4,P,0.0001), while the probability
of a transcript occurring on the other chromosomes was negatively related to CVG(X chromosomex12¼26.0,P,
0.0001; chromosome 2x12¼43.8,P,0.0001) (Table 1).
Using the tertile method, the representation of C3 was significantly heterogeneous (x22 ¼ 94.2, P , 0.0001),
with 82% of transcripts in the highest tertile occurring on that chromosome, compared to 74% in the middle tertile and 60% in the bottom tertile (Table 1).
Of 5410 C2 transcripts that were detectable in our study, 81 (1.5%) were genetically variable and in the top tertile of all CVGvalues, 153 (2.8%) were variable and in
the middle tertile, and 203 (3.8%) were variable and in the bottom tertile (supplemental Table 1 at http://www. genetics.org/supplemental/). The proportions were very similar for the 2250 detectable X chromosome transcripts: 39 (1.7%) were in the top, 40 (1.8%) were in the middle, and 92 (4.1%) were in the bottom tertile of all genetically variable transcripts. Taking the propor-tion oftrans-regulated genes on X and C2 as the pro-portion of detectable transcripts that are expected to betransregulated by genes on C3 and applying these proportions to the detectable C3 transcripts, we expect 0.01563 6338 ¼99 C3 transcripts in the top tertile, 0.012536338¼160 in the middle tertile, and 0.03853 6338¼244 in the bottom tertile of genetically variable transcripts to betrans regulated by other genes on C3 (Table 1).
Over all tertiles,cisregulation thus accounts for 1180/ 2329 ¼ 51% of the genetically variable transcripts. However, it accounts for 70% of all transcripts in the top tertile of genetic variation, 53% of transcripts in the middle tertile, and 29% of those in the bottom tertile (Table 1). Because the mean standardized genetic var-iance (CVG)2for transcripts in the top tertile is 5.4 times
higher than that for transcripts in the middle tertile and 26 times higher than that for transcripts in the bottom tertile (Table 1), we conclude that cis effects are re-sponsible for substantially more genetic variance in gene expression than aretranseffects and consequently thatciseffects are larger on average than aretranseffects (Meiklejohnet al.2003; Wayneet al.2004).
To determine if variation in mRNA sequences among inbred lines was a potential source of bias in this analysis (Hsieh et al. 2003), we filtered the 2329 genetically
variable transcripts on the basis of a measure of the average between-line correlation of hybridization sig-nals within an individual probe: Cronbach’s a (SAS Institute 2002). For each gene on each array, we
sequentially deleted probes with the largest values of external Studentized residuals (rS) from the original
linear model until the value of Cronbach’saexceeded 0.90. We filtered all genes that did not achieve this level ofaafter deleting probes with rS#1.0. This left 1712
genes with known chromosomal locations, of which 112
were on C1, 327 were on C2, and 1273 were on C3. Thus, nearly the same proportion of genes occurs on C3 as on the unfiltered list of variable genes. Sequence variation at probe sites apparently did not bias our estimate of the proportion ofcis- andtrans-regulated transcripts.
Functional classification and interacting transcripts: Classification of genetically variable transcripts into biological process categories indicated that develop-mental, cell communication, and regulatory processes were significantly underrepresented, compared to their frequency among all transcripts in our sample (Table 2). Metabolic processes were overrepresented, but not significantly so. Two molecular function categories were also underrepresented: signal transduction and tran-scription regulation. Structural molecules were also underrepresented, but the deviation was nonsignificant by the conservative contingency-table analysis we used. Catalytic activity was the only molecular function cate-gory that was overrepresented.
When we compared variable and nonvariable tran-scripts with respect to the number of interacting pro-teins, we found no significant associations. Of the 2329 variable transcripts, 1115 are associated with proteins known to be involved in interactions, and 1214 are not. Of the 11,969 transcripts that were detectable in our sample but not genetically variable, 5533 were associ-ated with interacting proteins, and 6436 were not. There is thus no evidence of association between variability and interaction (x12 ¼ 2.13, P ¼ 0.14). When we
re-stricted the analysis to high-confidence protein–protein interactions (Giotet al.2003), the results were similar:
731 variable transcripts were associated with high-confidence interacting proteins, and 1598 were not, while the numbers for nonvariable transcripts are 3690 of 8279, respectively. Again, there is no evidence of association (x12 ¼ 0.28, P ¼ 0.59). Furthermore, the
mean number of interactions per transcript is nearly identical for variable and nonvariable transcripts. Vari-able transcripts average 0.64 (SE¼ 0.03) interactions per transcript and nonvariable ones average 0.60 (SE¼ 0.01) interactions.
Dominance of transcript abundance:We detected at least one pairwise difference between the parental and
TABLE 1
Chromosomal location of transcripts in each tertile of genetic coefficient of variation
Tertilea C3 total Cis Trans X C2 Other Total Mean CV
Gb
1 639 540 99 39 81 17 776 5.1
2 574 414 160 40 153 9 776 2.2
3 470 226 244 92 203 12 777 1.0
Totalc 1683 1180 503 171 437 38 2329 3.0
aTertile 1 comprises transcripts with the most genetic variation in expression; tertile 3 comprises those with
the least.
bThe mean standardized genetic variance for each tertile is the square of the mean CV
G.
F1lines in 1589 cases (646 in cross 33383, 620 in cross
333483, and 323 in cross 833483). Parental lines were significantly different from each other (i.e., a .0) in 1549 of these cases. The hybrid was significantly differ-ent from the mean of the pardiffer-ental lines (i.e., |d|.0) in only 205 cases. This disparity was not due to differential power of the tests, because they had the same degrees of freedom, median standard errors were not strikingly different (SE[d]¼0.04; SE[a]¼0.03), but medians of the estimates themselves were quite different (median d¼0.06, mediana¼0.19). Distributions foraanddare shown in Figure 2, A and B, and all values of standard errors are provided in supplemental Table 2 at http:// www.genetics.org/supplemental/.
Distributions of dominance values are shown in Figure 2C. Median values were 0.03 (Wilcoxon test, P.0.50), 0.08 (P,0.001), and 0.14 (P,0.001) for the three crosses, respectively. In each cross,.66% of values fell between 0.5 and 10.5, indicating additivity or intermediate dominance. Overall, 1128 transcripts had d/avalues consistent with additivity or intermediate domi-nance (0,|d/a|,0.5), 330 had values consistent with intermediate-to-complete dominance (0.5,|d/a|,1), and 131 had values consistent with overdominance (|d/a|.1).
Of the apparently overdominant transcripts, seven were significantly overdominant using a stringent crite-rion of nonoverlap of the 95% confidence intervals of d and a; 30 were significant using 80% confidence intervals. A previous study of dominance of mRNA abundance phenotypes used a cutoff of |d/a|.1.32 on the log2(PM) scale, instead of confidence limits, to
indicate overdominance (Gibsonet al.2004). This
ap-proach protects against underestimation of the number of overdominant transcripts because of low statistical power. Using this criterion, 88 (3.7%) transcripts dis-played overdominance, in broad agreement with the results of Gibson et al. (2004). There were few
tran-scripts with |d/a|.3, and all were associated with small values ofa(Figure 3). Excluding values ofa,0.1, there were no significant associations between a and |d/a| (cross 33383, Pearson’sr¼ 0.04,P¼0.39,N¼546; cross 333483,r¼0.007,P¼0.87,N¼552; crosses 333 83 and 833483,r¼ 0.03,P¼0.62,N¼265).
DISCUSSION
Over 16% of the transcripts present in adult males demonstrated significant genetic variance in expression within a single population when only C3 (40% of the genome) varied among genotypes. This is only slightly smaller than the proportion of genes showing within-population phenotypic variation in Fundulus (18%, Oleksiaket al.2002) and/or the proportion of genes
varying between inbred lines from different source populations in D. melanogaster (25%, Gibson et al.
2004). This comparison suggests that quantitative ge-netic variation for mRNA abundance is at least as prevalent within populations as it is between popula-tions ofD. melanogaster. Our results indicate that within-population variation in gene expression is due largely to the segregation of many nearly additive alleles, that, numerically, cis effects account for about half the genetically variable transcripts, and that cis effects contribute substantially more to genetic variance in
TABLE 2
Gene ontology (GO) categories under- or overrepresented among genetically variable transcripts
Gene ontology category Genetically variable Present in adult males x12 Pa
Biological process
All genes annotated for biological process 1024 6248
Underrepresented categories
Development 180 1568 17.4 ,0.0001
Cell communication 172 1446 13.5 0.0002
Regulation of biological process 120 1069 13.9 0.0002
Overrepresented categories
Metabolism 706 4007 1.9 0.17
Molecular function
All genes annotated for molecular function 1086 6517
Underrepresented categories
Signal transduction 113 890 6.7 0.01
Transcription regulator 79 760 15.1 0.0001
Structural molecule 87 656 3.7 0.05
Overrepresented categories
Catalytic activity 632 3285 7.0 0.009
Significant categories (two-sidedP,0.0001) are indicated in italics.
aCalculated by contingency-table analysis, comparing the representation of a category among genetically variable transcripts to
expression that do trans effects. Previous studies of modes of regulation have yielded mixed results, with some reporting a high proportion oftrans regulation (Montoothet al.2003; Yvertet al.2003; Wayneet al.
2004; Harbisonet al.2005) and some reporting mostly
cis(Wittkoppet al.2004). However, most of these studies
evaluated regulation by using between-population or between-species crosses.Transeffects may be more typical of between- than of within-population variation, since selection acting within populations may strictly limit variation in trans-acting genes with multiple down-stream effects (Denveret al.2005).
One previous study of within-population variation in D. simulansalso reported evidence for bothcisandtrans regulation, and found that trans effects were more numerous thanciseffects (Wayneet al.2004), but that
cis effects were larger than trans effects (a result also reported by Meiklejohn et al. 2003). Thus there are
transcripts had our lines differed for all chromosomes. However, a likely explanation of this difference is that different genetic components of variation were mea-sured in the two studies (additive variance in the pre-vious studyvs.variation among homozygous lines in ours). Homozygous genetic variance is expected to exceed additive variation within populations (Charlesworth
and Hughes 1996), and experiments confirm this
ex-pectation (Hughes1995a,b; Hugheset al.2002). Thus
our observation of more genetically variable transcripts might simply reflect higher power to detect the larger variances associated with inbred lines.
We also detected an approximately equal numerical representation of cis- than of trans-acting variation in contrast to the study of within-population variation inD. simulans, but like that study, ours indicates thatciseffects are on average larger thantrans. We could detect only
transcript variation that was caused by sequence varia-tion on C3. If patterns ofcisandtransregulation differ between chromosomes, and particularly if they differ between sex chromosomes and autosomes, our results would not be representative of sex-linked variation. We know of no direct evidence for such differential patterns of regulation, however. Further, genetic variation on other chromosomes would be likely to induce some additional trans effects on C3, although interchromo-somal epistatic interactions could also increase the level ofcis-acting variation. Studies comparing chromosome extraction lines directly to whole-genome inbred lines from the same population could be used to address this issue. Finally, the two sets of results are reconcilable if genes that are highly variable within D. melanogaster (mostlycisregulated) are also characterized by greater sequence divergence between species and are therefore less likely to be detected in cross-species hybridizations. Evidence for a positive correlation of within-species variation and between-species divergence has come from studies of genes involved in reproduction (Begun
et al. 2000) and cell-surface proteins (Lazzaro2005);
evaluation of the genomewide pattern awaits genome sequencing of other Drosophila species.
Functional analysis of genetically variable transcripts provides insight into the selective constraints that operate on within-population variation. Transcripts involved in Figure2.—Continued.
metabolic/catalytic processes tend to be genetically variable, while those involved in development, tran-scriptional regulation, and signal transduction do not. Metabolic transcripts may be more variable than devel-opmental and regulatory ones because they are sub-ject to weaker purifying selection or because variation is actively maintained in metabolic enzymes by hetero-zygote advantage, genotype–environment interaction, or other forms of balancing selection. Strong purify-ing selection on developmental and regulatory tran-scripts may be common if small deviations in transcript abundance disrupt highly integrated developmental and regulatory pathways. Conversely, balancing se-lection mediated by a variable environment could be particularly relevant to metabolic enzymes, which me-diate interactions directly between the organism and its environment.
Genetic variation is not disproportionately repre-sented among transcripts that produce proteins that interact with other proteins. Because transcriptional, translational, and metabolic proteins are all enriched among those engaged in protein–protein interactions (Giotet al.2003), and metabolic genes are likely to be
genetically variable, but regulatory genes are not, this result is not too surprising. However, our results do suggest that protein interaction itself does not constrain or enhance within-population genetic variation.
Dominance patterns indicate that overdominance is rare, and within-locus additivity is typical of segregating variation in transcript abundance. Over 97% of variable transcripts had significant expression differences be-tween two homozygous parents, but only 13% had F1
values that deviated significantly from the midpoint of parental values. There is no obvious relationship be-tween |d/a| anda, as might be expected if genes with large differences between parental lines tend to be dominant or overdominant. This preponderance of additivity contrasts with results from a recent study of crosses between inbred lines derived from different source populations (Gibson et al.2004). In our study,
71% of dominance values fell between0.5 and10.5, while only 15% of values fell in that range in the previous study (calculated from supplemental informa-tion for males in Gibsonet al.2004). It might be argued
that this difference derives from pooling of reciprocal crosses in our experiment, since Gibsonet al.detected differences between F1reciprocal males in 9% of
tran-scripts tested. However, that study crossed inbred lines that differed at all chromosomes. Male flies from reciprocal crosses thus had different X (and Y) chro-mosomes, and this could account for differential expression in reciprocal males and for some cases of apparent dominance in males in that experiment. In our study, all lines had the same X, C2, and Y chro-mosomes, so males from reciprocal crosses had identi-cal genotypes and should have identiidenti-cal expression patterns, aside from maternal effects.
Another possible contributor to different dominance patterns in the two studies is that different filtering criteria were used. Gibson et al. (2004) included a
transcript in all dominance calculations if at least one significant pairwise difference was detected among their 12 genotype/sex categories, even though any given dominance value was calculated from only 3 of the 12 categories. We used a more stringent criterion and calculated dominance values only for transcripts show-ing significant differences among the three genotypes actually used in the dominance calculation.
Because these experimental differences are unlikely to completely account for the large differences in dom-inance patterns in the two studies, we believe that the discrepancy reflects real differences in the genetic architecture of the lines used. The most obvious dif-ference is that we investigated a random sample of within-population variation, while Gibson et al. used crosses between inbred lines derived from two different source populations (Ore-R and 2b). Although there appears to be limited molecular population structure in D. melanogasteroutside of Africa (Dieringeret al.2005),
substantial population differentiation has been found among non-African populations for many quantitative traits (DeJongand Bochdanovits2003; Schmidtet al.
2005), even on a microgeographic scale (Wayne et al.
2005). In addition, neutral markers have been shown to drastically underestimate population structure for adaptive traits in other species (Karhuet al.1996). We
therefore suggest that differences in the genetic archi-tecture of nonneutral quantitative traits might depend critically on the level at which the variation is investi-gated (i.e., betweenvs.within populations).
Alternately, the process of inbreeding itself might lead to different genetic architectures. The lines used by Gibsonet al.were produced by many generations of brother–sister mating, which provides an extended op-portunity for selection to operate. Furthermore, one of the lines, 2b, underwent selection for low male mating ability during the course of inbreeding. Our lines were produced by sampling third chromosomes directly from a natural population using balancer chromosomes. Third chromosomes that were homozygous lethal or that had very low homozygous fitness would have been removed by this process, but selection was otherwise minimized, and most genetic variation would have been preserved in these lines.
We thank and C. Hartway, J. Leips, C. Milling, C. Whitfield, M. Whitlock, and two anonymous reviewers for insightful comments on manuscript drafts and C. Wilson for conducting the Affymetrix hybrizations and scanning. This work was supported by National Science Foundation awards DEB-0296177 (K.A.H.) and DEB-0092554 (K.N.P.) and by the University of Illinois Urbana Campus Research Board (C.E.C., K.A.H, and K.N.P.).
LITERATURE CITED
Barton, N. H., and M. Turelli, 1989 Evolutionary quantitative
genetics: how little do we know. Annu. Rev. Genet.23:337–370. Begun, D. J., P. Whitley, B. L. Todd, H. M. Waldrip-Dailand A. G.
Clark, 2000 Molecular population genetics of male accessory
gland proteins in Drosophila. Genetics156:1879–1888. Benjamini, Y., and Y. Hochberg, 1995 Controlling the false
discov-ery rate: a practical and powerful approach to multiple testing. J. R. Stat. Soc. Ser. B57:289–300.
Brem, R. B., G. Yvert, R. Clintonand L. Kruglyak, 2002 Genetic
dissection of transcriptional regulation in budding yeast. Science
296:752–755.
Charlesworth, B., and K. A. Hughes, 1996 Age-specific
inbreed-ing depression and components of genetic variance in relation to the evolution of senescence. Proc. Natl. Acad. Sci. USA93:6140– 6145.
Charlesworth, B., and K. A. Hughes, 2000 The maintenance of
genetic variation in life history traits, pp. 369–391 inEvolutionary Genetics from Molecules to Morphology, edited by R. S. Singhand
C. B. Krimbas. Cambridge University Press, Cambridge, UK.
Chu, T. M., B. Weirand R. Wolfinger, 2002 A systematic statistical
linear modeling approach to oligonucleotide array experiments. Math. Biosci.176:35–51.
Cope, L. M., R. A. Irizarry, H. A. Jaffee, Z. J. Wuand T. P. Speed,
2004 A benchmark for affymetrix GeneChip expression mea-sures. Bioinformatics20:323–331.
De Jong, G., and Z. Bochdanovits, 2003 Latitudinal clines in
Drosophila melanogaster: body size, allozyme frequencies, inversion frequencies, and the insulin-signalling pathway. J. Genet. 82:
207–223.
DeLuca, M., N. V. Roshina, G. L. Geiger-Thornsberry, R. F. Lyman,
E. G. Pasyukovaet al., 2003 Dopa decarboxylase (Ddc) affects
variation inDrosophilalongevity. Nat. Genet.34:429–433. Denver, D. R., K. Morris, J. T. Streelman, S. K. Kim, M. Lynchet al.,
2005 The transcriptional consequences of mutation and natu-ral selection in Caenorhabditis elegans. Nat. Genet.37:544–548. Dieringer, D., V. Nolteand C. Schlotterer, 2005 Population
structure in AfricanDrosophila melanogasterrevealed by microsatel-lite analysis. Mol. Ecol.14:563–573.
Falconer, D. S., and T. F. C. Mackay, 1996 Introduction to
Quantita-tive Genetics.Longman, Essex, UK.
Gibson, G., R. Riley-Berger, L. Harshman, A. Kopp, S. Vachaet al.,
2004 Extensive sex-specific nonadditivity of gene expression in Drosophila melanogaster.Genetics167:1791–1799.
Giot, L., J. S. Bader, C. Brouwer, A. Chaudhuri, B. Kuanget al.,
2003 A protein interaction map of Drosophila melanogaster. Science302:1727–1736.
Glazier, A. M., J. H. Nadeauand T. J. Aitman, 2002 Finding the
genes that underlie complex traits. Science298:2345–2349. Harbison, S., S. Chang, K. Kamdarand T. Mackay, 2005
Quan-titative genomics of starvation stress resistance in Drosophila. Genome Biol.6:R36.
Hsieh, W. P., T. M. Chu, R. D. Wolfinger and G. Gibson,
2003 Mixed-model reanalysis of primate data suggests tissue
and species biases in oligonucleotide-based gene expression pro-files. Genetics165:747–757.
Hughes, K. A., 1995a The evolutionary genetics of male life-history
characters inDrosophila melanogaster.Evolution49:521–537. Hughes, K. A., 1995b The inbreeding decline and average
domi-nance of genes affecting male life-history characters inDrosophila melanogaster.Genet. Res.65:41–52.
Hughes, K. A., J. A. Alipaz, J. M. Drnevichand R. M. Reynolds,
2002 A test of evolutionary theories of senescence. Proc. Natl. Acad. Sci. USA99:14286–14291.
Karhu, A., P. Hurme, M. Karjalainen, P. Karvonen, K. Karkkainen
et al., 1996 Do molecular markers reflect patterns of differenti-ation in adaptive traits of conifers? Theor. Appl. Genet.93:215– 221.
Lazzaro, B. P., 2005 Elevated polymorphism and divergence in the
class C scavenger receptors ofDrosophila melanogasterandD. sim-ulans.Genetics169:2023–2034.
Liu, G., A. E. Loraine, R. Shigeta, M. Cline, J. Cheng et al.,
2003 NetAffx: Affymetrix probesets and annotations. Nucleic Acids Res.31:82–86.
Lyman, R. F., F. Lawrence, S. V. Nuzhdinand T. F. C. Mackay,
1996 Effects of singleP-element insertions on bristle number and viablility inDrosophila melanogaster.Genetics143:277–292. Lynch, M., L. Latta, J. Hicksand M. Giorgianni, 1998 Mutation,
selection, and the maintenance of life-history variation in a nat-ural population. Evolution52:727–733.
Mackay, T. F. C., 2001 The genetic architecture of quantitative
traits. Annu. Rev. Genet.35:303–339.
Meiklejohn, C. D., J. Parsch, J. M. Ranz and D. L. Hartl,
2003 Rapid evolution of male-biased gene expression in Dro-sophila. Proc. Natl. Acad. Sci. USA100:9894–9899.
Montooth, K. L., J. H. Mardenand A. G. Clark, 2003 Mapping
determinants of variation in energy metabolism, respiration and flight in Drosophila. Genetics165:623–635.
Oleksiak, M. F., G. A. Churchilland D. L. Crawford, 2002
Varia-tion in gene expression within and among natural populaVaria-tions. Nat. Genet.32:261–266.
Rifkin, S. A., J. Kimand K. P. White, 2003 Evolution of gene
expres-sion in theDrosophila melanogastersubgroup. Nat. Genet.33:138– 144.
SAS Institute, 2002 SAS/STAT User’s Guide, Version 9.SAS Institute,
Cary, NC.
Schmidt, P. S., L. Matzkin, M. Ippolito and W. F. Eanes,
2005 Geographic variation in diapause incidence, life-history traits, and climatic adaptation in Drosophila melanogaster. Evolu-tion59:1721–1732.
Townsend, J. P., D. Cavalieriand D. L. Hartl, 2003 Population
genetic variation in genome-wide gene expression. Mol. Biol. Evol.20:955–963.
Turelli, M., and N. H. Barton, 2004 Polygenic variation
main-tained by balancing selection: pleiotropy, sex-dependent allelic effects andG3Einteractions. Genetics166:1053–1079. Wayne, M. L., Y.-J. Pan, S. V. Nuzhdin and L. M. McIntyre,
2004 Additivity andtrans-acting effects on gene expression in maleDrosophila simulans.Genetics168:1413–1420.
Wayne, M. L., A. Koroland T. F. C. Mackay, 2005 Microclinal
var-iation for ovariole number and body size inDrosophila melanogaster in ‘Evolution Canyon’. Genetica123:263–270.
Wittkopp, P. J., B. K. Haerumand A. G. Clark, 2004 Evolutionary
changes incisandtransgene regulation. Nature430:85–88. Yvert, G., R. B. Brem, J. Whittle, J. M. Akey, E. Foss et al.,
2003 Trans-acting regulatory variation in Saccharomyces cerevi-siae and the role of transcription factors. Nat. Genet.35:57–64.